Error Detection in Service-Oriented Distributed Systems Andrei Korostelev1,2, Johan Lukkien1, Jan Nesvadba2 1
2 Department of Mathematics and Computer Science Storage Systems and Applications, Philips Research Laboratories, Prof. Holstlaan 4, Eindhoven University of Technology, P.O. Box 513, 5600 MB, 5656 AA Eindhoven, The Netherlands Eindhoven, The Netherlands email: {a.v.korostelev, j.j.lukkien}@tue.nl,
[email protected]
Abstract - The development of high-level approaches in software design for distributed systems has led to coordinationbased architectures (e.g., UPnP, JXTA, Web services). Further decoupling of components from their application context leads to so-called Service-Oriented Architectures (SOA). A SOA is based on a service as a first-class object; applications then appear by composing these services at runtime. This paper presents and analyses a solution for error detection in a SOA context. We derive a fault model for error detection from the SOA architecture, introduce quantifiable parameters to evaluate efficiency of this solution, and incorporate the solution into the distributed multimedia framework Cassandra developed at Philips Research.
I. INTRODUCTION In distributed applications, the distributed nature, the lack of centralised control and the lower reliability of network communication all lead to an increased probability of failure, which often has partial nature. In a SOA [1] context such failures are observed by service users as delivered service failures. We propose and study an approach for detection of delivered service failures in SOA systems. We analyse the efficiency of this approach for different layers, typical for a SOA system. The final design was derived from the results of this analysis and was built in the Cassandra Framework [2].
II. ERROR DETECTION APPROACH We consider a typical SOA system as consisting of services used to compose applications and residing in components. Components are deployment units represented by executable programs, which contain and expose services. Components in turn run inside network nodes. We assume delivered service failures are one of the following: • Service failure observed as a violation of a service’s contract; • Failure of the component containing the service, observed as termination of the component’s process; • Failure of the node containing the component and observed as non-reachibility of the node via the network. These considered failures represent a fault model of a SOA system. Our detection approach takes this model as a starting point. In order to define and measure the quality of the error detection, the following quantitative parameters are introduced: detection time (time that elapses between occurrence and observation of an error), network overhead (the amount of communication), and detection accuracy (the fraction of correct error diagnoses).
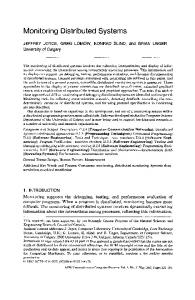
A. System architecture. The error detection system consists of entities monitored for errors (monitored objects) and error monitoring entities (monitors). With respect to the fault model, the monitored objects are services, components, and nodes. Accordingly we have service monitor, component monitor and system monitor. Each monitored object provides an error monitoring interface to communicate with a monitor. The system is split into four error monitoring layers, as depicted in Fig 1. System monitor
Network layer
Node Component monitor
Local layer
Comp Service monitor
Component layer
Service
Service layer
Fig. 1. Layered error monitoring.
B. Monitoring protocols. There are two basic interaction primitives used for error monitoring: push and pull [3]. In the push model a monitored object periodically sends heartbeat-messages to its monitor, in the pull model the monitor periodically sends heartbeat requests to the object. Each monitor is responsible for monitoring all objects on one layer. The monitor concludes about the error state of its object by analysing the object’s state information queried at so-called object’s internal access point (IAP) or an external access point (EAP). IAP allows querying internal state of a monitored object, whereas EAP gives access to the object’s physical state. For example, a point at which we retrieve a service’s state by calling an accessor method of the object implementing this service represents an IAP of this service; whereas a process identifier is an EAP for a running component. Each monitored object contains an internal monitor (IM). IM is attached to the object’s IAP and provides the parent monitor with a Boolean answer about the object’s error state by analysing the object’s internal state. Below we define two error monitoring protocols, one for each access point type. • Internal monitoring protocol (IMP). A monitor interacts solely with the object’s IM through the provided error-
monitoring interface. IMP internally uses either push or pull monitoring model. • External monitoring protocol (EMP). A monitor observes the object’s physical state at the object’s EAP using push or pull monitoring. The role of the IM in the EMP protocol is limited to notifying the parent monitor about errors reported by child monitors. We define a monitoring event as an event which triggers an update of the monitor’s knowledge about its child object’s error state. Besides receiving monitoring events, a monitor can also receive an error notification about a failed object located underneath its child object layer and sent by the child object’s IM. In this case the monitor merely propagates this message upwards. A monitor’s state chart is displayed in Fig 2. Heartbeat [IMP] “alive” [EMP]
Error [not from child] / Propagate upwards
Object Ok
/ Propagate error upwards
Fig 2. State machine for a monitor using IMP or EMP protocol.
Because both the object’s IM and the monitoring connection can fail, the error diagnostics of the object’s failure can take the following values: correct detection of the object’s failure (true positive, TP), correct diagnosis of the absence of the object’s failure (true negative, TN), erroneous detection of the object’s failure (false positive, FP), or a miss of the object’s failure (false negative, FN). Fig. 3 explores error diagnostics results for each protocol by analysing causes of monitoring events. IMP monitoring events
Error from child
connection ok
connection ok obj. ok
obj. failed
TN
Detected monitoring conn. breakdown / expired heartbeat connection non-ok
connection ok
TP
obj. failed
obj. ok
FPIMFail
Detection time (ms)
Overhead (bps)
Accuracy (0..1)
IMP
E(TIMP) + nTIMPDmax
nc/TIMP
1- (FPIMFail +FPIMPConn)/N
EMP
E(TEMP) + nTEMPDmax
nc/TEMP
1- (FNEAP + FPEMPConn)/N
Table 1. The impact of choosing a monitoring protocol on the efficiency parameters. n=1 for push, n=2 for pull monitoring.
Error [from child, IMP] Detected “Failed” [EMP] Expired monitoring heartbeat [IMP] conn. breakdown “alive” [EMP] Object failed
Heartbeat
FPIMFail emphasises that the given false positives are a result of IM failures. FPConn represents the number of false positives that happen because of a monitoring connection breakdown, while the object is still alive. FNEAP indicates that faulty heartbeats were generated by the object’s EAP because the object’s failure did not bring it into a failed physical state. Table 1 concludes the analysis of monitoring protocols by quantifying the efficiency of each protocol. T stands for the monitoring interval, TDmax is a maximum delivery time, E(T) denotes the expected time to the object’s failure in an interval of length T, c is a monitoring message size, N is a number of monitoring events.
obj. ok
TP FPConn
obj. failed
TP
EMP monitoring events
Analysing Table 1, both protocols will provide the same overhead and delivery time, if we can set TIMP equal to TEMP, and TIMPDmax equal to TEMPDmax for these protocols. In this case a choice of a protocol solely depends on which of them provides better accuracy. IMP reaches the best accuracy when IM is not prone to self-failures; EMP reaches the best accuracy when the object’s failures always affect the object’s physical state.
III. RESULTS AND CONCLUSIONS The results of this analysis were incorporated and evaluated in the Cassandra Framework developed at Philips Research. Cassandra is a distributed middleware platform for prototyping A/V processing algorithms such as speech recognition, commercials detectors or face detectors, and represents a typical SOA system. Series of simulations showed high efficiency of error detection, covering the most common Cassandra breakdowns: service failures as a result of bugs in underlying A/V algorithms, non-reliability of the used UPnP [4] stack resulting in fail-stops of UPnP devices representing components, distribution of nodes (over 20 PCs in a typical setup) resulting in a lack of centralized control. Future steps are related to dealing with detected errors, which includes error treatment and fault diagnostics. An interest lays in dynamic instantiating of a certain error detection approach and a transparent treatment based on runtime properties of the SOA system.
REFERENCES “Alive” connection ok obj. ok
TN
“Failed” connection ok
obj. failed
FNEAP
Detected monitoring conn. breakdown / expired “alive” connection non-ok
connection ok obj. failed
TP
obj. failed
TP
obj. ok
obj. failed
FPConn
TP
Fig. 3. Error diagnostics results for IMP and EMP protocols through analysing monitoring events causes.
[1] J. McGovern et al. Java Web Services Architecture. Morgan Kaufmann Publishers, July 2003. [2] Cassandra: real-time multimedia content analysis. http://www.research.philips.com/technologies/storage/cassandra/ [3] P. Felber et al. Failure detectors as first class objects, In Proc. 9th IEEE Intl. Symp. on Distributed Objects and Applications, Edinburgh, Scotland, Sept. 1999 [4] UPnP. www.upnp.org