Cognitive Psychology 42, 113–157 (2001) doi:10.1006/cogp.2000.0744, available online at http://www.idealibrary.com on
Error Monitoring in Speech Production: A Computational Test of the Perceptual Loop Theory Robert J. Hartsuiker and Herman H. J. Kolk University of Nijmegen, Nijmegen, The Netherlands A theory of speech monitoring, proposed by Levelt (1983), assumes that the quality of one’s speech is checked by the speech comprehension system. This system inspects one’s own overt speech but would also inspect an inner speech plan (‘‘the inner loop’’). We have elaborated and tested this theory by way of formalizing it as a computational model. This model includes a new proposal concerning the timing relation between planning the interruption and the repair: the proposal that these two processes are performed in parallel. We attempted to simulate empirical data about the distribution of error-to-cutoff and cutoff-to-repair intervals and the effect of speech rate on these intervals (these intervals are shorter with faster speech). The main questions were (1) Is an inner monitor that utilizes the speech perception system fast enough to simulate the timing data? (2) Can the model account for the effects of speech rate on these intervals? We conclude that including an inner loop through the speech comprehension system generates predictions that fit the empirical data. The effects of speed can be accounted for, given our proposal about the time course of planning interruption and repair. A novel prediction is that the error-tocutoff interval decreases with increasing position in the phrase. 2001 Academic Press Key Words: monitoring; perceptual loop theory; main interruption rule.
Speakers continuously inspect the well-formedness of their own speech. Consider the events that often follow a speech error: Speech is interrupted and a new attempt is made at producing the erroneous word or phrase. This new attempt is called a ‘‘repair’’ (Levelt, 1983). The process of inspecting one’s own speech and taking appropriate action when errors are made is referred to as speech monitoring. Speech can be monitored for errors that stem from miscomputations at each linguistic level: for the appropriateness The research reported in this paper was funded by a grant from the Dutch Society for Scientific Research, NWO (575-21-004). We thank Frank Wijnen, Dirk-Bart Den Ouden, Claudy Oomen, Albert Postma, Sieb Nooteboom, and two anonymous reviewers for useful comments on earlier versions of this paper. Claudy Oomen and Albert Postma are thanked for making their data available to us. Address correspondence and reprint requests to Robert J. Hartsuiker at the Department of Psychology, University of Edinburgh, 7 George Square, Edinburgh EH8 9JZ, Scotland. Email:
[email protected]. 113 0010-0285/01 $35.00 Copyright 2001 by Academic Press All rights of reproduction in any form reserved.
114
HARTSUIKER AND KOLK
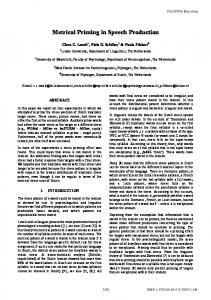
FIG. 1. Temporal structure of error, interruption point (‘‘cutoff’’), and repair, for a hypothetical speech error and self-correction. The interval labeled 1 denotes the error-to-cutoff time. Interval 2 is the cutoff-to-repair time.
of a given word or phrase in the current context, but also for semantic, syntactic, phonological, and prosodic aspects. An example (in Dutch) of a repair, following a syntactic error is given in (1), followed by a word-by-word translation in English. (1) Ik wist dat de heer In ‘t Veld nevenwerkzaamheden hadden, uh, had. I knew that Mr. In ‘t Veld additional jobs had (pl.), er, had (sng.)
In this example, the speaker produced a subject–verb agreement error: Whereas the subject (Mr. In ‘t Veld) was singular, the corresponding verb was plural. However, the error was detected and a repair was initiated. Indeed the correct, singular, form is subsequently produced, following a pause filled with an editing term (‘‘uh’’). In the present article we will consider the time course of interrupting and repairing. Important data are the moment when speech is halted (the interruption) and the moment when the repair begins. The interval between the onset of the error word and the interruption is called the error-to-cutoff interval. The interval between the interruption and the onset of the repair is referred to as the cutoff-to-repair interval (Blackmer & Mitton, 1991). The temporal structure of error and repair is illustrated in Fig. 1. One of the first systematic studies of monitoring was conducted by Levelt (1983). In this study participants described paths through a network of colored circles. Speech errors and repairs were scored and analyzed, with respect to variables such as which part of the word was interrupted, the use of editing terms, and the number of words in the original utterance that were repeated in the repair. An important finding from that study was that erroneous words were often interrupted quite early. For instance, consider (2). (2) Neem de v.horizontale lijn. . . . Take the v.horizontal line. . . .
Given the network description task, it is quite plausible that the speaker had first generated ‘‘vertical,’’ but interrupted and repaired the utterance. However, considering the early moment the word is interrupted (right after the first phoneme), it seems unlikely (although not impossible) that this error was detected by the speaker while listening to her own overt speech. It is unlikely because there would remain extremely little time for perception of the error, deciding that there is an error, and, consequently, effectuating the
MONITORING MODEL
115
interruption. All of these processes take time and the sum of these durations is likely to be larger than the time required to produce the next phoneme in the word. Thus, instead of only assuming monitoring of overt speech, Levelt (1983; 1989) proposed that such fast interruptions can be explained by an ‘‘inner monitoring loop.’’ The representation being monitored would be ‘‘inner speech’’ (Anderson, 1982; Dell & Repka, 1992; Sokolov, 1972; Weber & Castleman, 1970), which Levelt called a ‘‘phonetic plan.’’ According to Levelt (1989), this representation is the output of the phonological encoding stage of processing and contains or points to the relevant plans for guiding articulation. Such plans are then input for the articulator (Levelt, 1989), the module which controls the speech musculature. An amendment to that theory was made by Wheeldon and Levelt (1995) to explain their results in a phoneme monitoring task. In that task, Dutch/ English bilinguals were presented English words and monitored for the occurrence of a given phoneme in the Dutch translation of these words. The location of the target phoneme in the word varied. Given the theory that the representation being monitored is phonetic, one would expect that differences in articulation times between different phonemes are reflected in the monitoring times. However, there was no such relation. This led Wheeldon and Levelt to postulate that the representation being monitored is more abstract, i.e., a phonological representation, containing phonemes and metrical information. This means (in contrast to the earlier theory) that the perception mechanism has direct access to representations being constructed in production.1 The possibility of an inner monitor has also been proposed in the domain of action planning in choice reaction time tasks (e.g., Bernstein, Scheffers, & Coles, 1995). These authors elicited an event-related component in the EEG signal, the so-called error-related negativity (ERN). They hypothesized that this component reflects a mismatch between representations of the actual response and of the intended response. Because the onset of the ERN is quite early, these authors concluded that the representation of the actual response was determined by central (inner) mechanisms, rather than by visual or proprioceptive feedback. The assumption of an inner monitoring mechanism implies that errors may sometimes be detected and intercepted before they are articulated. In other words, these errors do not become overt. Nevertheless, such early interruptions could have repercussions for the fluency of speech, because the part of the utterance that was wrong needs to be repaired. If this repair is not available at the time of interruption, there would be a pause, perhaps filled with an editing term like ‘‘uh.’’ Alternatively, an interruption could occur within the wrong word but before the erroneous part of the word is said. For instance, the speaker may have generated a speech plan corresponding to 1
Although the authors do not explicitly state that this implication holds.
116
HARTSUIKER AND KOLK
[verticil] instead of [vertical]. Early interruption of the erroneous word followed by a restart could then lead to a part-word repetition (e.g., ‘‘ver.vertical’’). On the basis of these arguments, Levelt (1983) assumes that various speech disfluencies, i.e., (filled) pauses, prolongations, and repetitions, are signs of covert repair. It is important to note that hesitations and repetitions can also be ascribed to different factors than covert repair, such as transient increases in processing load, temporary inaccessibility of a needed piece of information, or advance planning of upcoming units (Clark & Wasow, 1998; Garrett, 1982). In other words, the term ‘‘covert repair’’ may be more specific than the phenomenon it labels (Blackmer & Mitton, 1991). This is an important point, because it reveals an inherent weakness of considering covert repairs as evidence for an inner monitor: It is unknown what is being repaired in a covert repair and we do not know if something is being repaired in a ‘‘covert repair.’’ Parenthetically, we would like to remark that the notion of covert repairing plays an important role in the stuttering theory of Postma and Kolk (1993; Kolk & Postma, 1997). This theory assumes that nonfluencies in stuttering are caused by prearticulatory interruption of speech. According to this theory, people who stutter have a disorder in phonological encoding, leading to (pathologically) many errors in their speech plans. Since the inner monitor is assumed to function normally, many of these errors would be covertly repaired, yielding stuttered speech. Thus, the Levelt (1983, 1989) theory of monitoring postulates an inner monitor, which operates on a prearticulatory representation of the utterance (a phonetic plan). A second important assumption is that the phonetic plan is inspected by the speech comprehension system. In other words, we use the same mechanism for comprehending speech and for monitoring our own speech. In the remainder of this article, we refer to the Levelt (1983, 1989) theory as the ‘‘perceptual loop theory.’’ The architecture of the monitoring system is depicted in Fig. 2. Figure 2 shows that the phonetic plan, the end product of formulating, feeds into the parser. The output of that processing stage, parsed speech, flows into the conceptualizer. The conceptualizer is the processing stage that generates messages for speaking, but it is also the locus of the monitor. Further, the phonetic plan will be temporarily stored in an articulatory buffer, in order to handle asynchronies between formulating and articulating. Another assumption of the perceptual loop theory is the ‘‘main interruption rule,’’ first proposed by Nooteboom (1980). This rule states that when an error is detected (internally or externally) speech is immediately halted. The rule is based on the observation that interruptions do not respect word boundaries. However, according to Levelt (1983) an exception to this rule are so-called appropriateness repairs. These are incidents in which the utterance is not really an error, but is rather too unspecific. For instance, instead
MONITORING MODEL
117
FIG. 2. Blueprint of the monitoring model, based on the theory of Levelt (1989), with a number of amendments.
of ‘‘a tall glass’’ the speaker simply produces ‘‘a glass.’’ Levelt found that appropriateness repairs were often delayed until the end of the word. A function of immediate interruption might be to signal to the listener that an error has occurred. Another important aspect of the main interruption rule concerns the beginning of restart planning. According to the main interruption rule, restart planning takes place, and only takes place, in the time following the actual interruption of speech. It is crucial to notice what ‘‘immediate’’ means in the main interruption
118
HARTSUIKER AND KOLK
rule. Stopping speech is something which requires that ongoing movements of the articulatory apparatus are turned off, which by itself will take some time. Levelt (1983) suggested that the interval between the internal emission of a ‘‘stop’’-signal and the actual interruption would be about 200 ms. This indeed seems a reasonable assumption given the literature on the stopping of movements (De Jong, Coles, Logan, & Gratton, 1990; Ladefoged et al., 1973; Logan & Cowan, 1984). Logan and Cowan presented an overview of many empirical studies of stopping and developed a mathematical model that estimates the so-called stop-signal reaction time. This time is the duration between the presentation of an overt stop-signal and the actual interruption of movement. The overview reported in Logan and Cowan shows that 200 ms is a reasonable estimate for the stopping of a wide range of movements, including typewriting and speech. The purpose of the present paper is to test whether an elaborated version of the perceptual loop theory and the main interruption rule is consistent with existing time course data (Blackmer & Mitton, 1991; Oomen & Postma, in press). In particular, we try to simulate time intervals between error and cutoff and between cutoff and repair. The perceptual loop theory has never before been formalized and tested through simulation. Thus, it is unclear whether the predictions of the theory are consistent with existing data. The present paper attempts to fill this gap. We also spell out a novel, testable prediction which the model generates. In the remainder of this section, we will briefly discuss the evidence for and against the perceptual loop theory. We will then outline the plan of this paper. EVIDENCE FOR THE PERCEPTUAL LOOP THEORY
The perceptual loop theory localizes monitoring in the perception apparatus. In this respect it contrasts with a number of different proposals that localize monitoring either in the speech production system itself (Laver, 1980; Van Wijk & Kempen, 1987) or in a network of nodes that is hypothesized to control both speech perception and speech production (MacKay, 1992a). Let us review the evidence in support of the perceptual loop theory. We will first discuss some of the evidence that supports an important aspect of the perceptual loop theory: the notion of an inner monitor. Then we will turn to evidence that supports the perceptual loop theory more specifically. The first line of evidence for an inner monitor comes from a study reported by Lackner and Tuller (1979). These authors elicited speech errors with or without white noise, which masked auditory feedback. If participants detected an error in their own speech they pushed a button. In the condition with white noise, speech errors were often detected and detection latencies were shorter than in the condition without noise. This suggests that some form of inner monitoring must have taken place, because the masking noise would have blocked the outer loop. Furthermore, it suggests that this inner
MONITORING MODEL
119
monitoring channel is faster than the outer monitoring channel, just as the perceptual loop theory would predict (comparable effects of noise masking were obtained by Postma & Kolk, 1992). A second source of evidence comes from studies in which slips of the tongue were elicited using the SLIP procedure (e.g., Motley, Camden, & Baars, 1982). In this procedure, the participant is shown word pairs and is required, in a certain proportion of the trials, to read them out loud. In a typical experimental trial, a number of word pairs would be presented that had the same initial consonant for each first word and each second word (e.g., bid-meck; bud-muck; big-men). Then the critical word pair would have these consonants reversed, e.g., mad back. This procedure would often lead to slips of the tongue, e.g. bad back, mad mac, or bad mac. Studies with this paradigm revealed that exchanges of consonants that led to a taboo word (e.g., tool kits → cool tits) were made significantly less often than ‘‘normal’’ exchanges. This suggests the error creating a taboo word is detected and repaired through an inner monitoring system. In further support of that hypothesis stands the finding that subjects that did not produce the taboo word did have an elevated galvanic skin response, suggesting that the taboo word was generated internally. A further source of evidence for inner monitoring is a study reported by Dell and Repka (1992) (see also Postma & Noordanus, 1996). These authors asked participants to recite tongue twisters, either in overt speech or in inner speech, and to report any speech errors. Indeed, in both the inner speech and outer speech conditions, many speech errors were reported.This supports, once again, the notion of a system that can detect errors before they are articulated. A further finding that Dell and Repka reported is of importance. The distribution of different types of errors (e.g., with respect to position of phoneme in the word) was similar for the inner and the outer speech conditions. This suggests that language production processes are the same in both inner and outer speech (with the exception of articulation), leading to similar speech errors. But it also suggests that monitoring processes are the same for inner speech and outer speech, therefore yielding a similar distribution of speech errors that are reported. Although these findings do not exclusively support the perceptual loop theory, they do support two important preconditions for that theory: First, there is prearticulatory monitoring. Second, the monitoring system is similarly sensitive to errors in inner and outer speech, which is consistent with the notion that both inner and outer speech feed into the same analysis system. Support for the main interruption rule comes from studies by Levelt (1983) and Bre´dart (1991). Levelt concluded that error repairs were often wordinternal. This shows that speakers do not wait for the rest of the word to be completed. Instead, they interrupt as soon as possible. Bre´dart (1991) analyzed error repairs in spontaneous speech. He found an effect of word length: Shorter words were more likely to be completed entirely. Such length effects
120
HARTSUIKER AND KOLK
did not occur for appropriateness repairs. Thus, consistent with the main interruption rule, erroneous words are interrupted as soon as possible. In the delay required to produce the interruption, short words, as opposed to long words, are often completed. Summing up, the studies on error detection under noise and the studies with the SLIP task support the notion of internal monitoring. The similarity between the distributions of inner and outer speech errors suggests that these errors are detected by the same monitor. Finally, the findings in Levelt (1983) and Bre´dart (1991) support the main interruption rule. CRITICISMS OF THE PERCEPTUAL LOOP THEORY
The perceptual loop theory has also met with criticism in recent years, both on theoretical grounds (MacKay, 1992a, 1992b), and on empirical grounds (Berg, 1986; Blackmer & Mitton; 1991; Liss, 1998; Marshall, Robson, Pring, & Chiat, 1998; McNamara, Obler, Au, Durso, & Albert, 1992). MacKay’s (1992a, 1992b) most important criticism concerns the fact that the perceptual loop theory is not specific enough to generate testable predictions. We will not go into this criticism here, since it is a purpose of our paper to specify the perceptual loop theory further. Berg (1986) takes issue with the assumption that the detection of an error automatically leads to an interruption and restart. According to him, there is also a ‘‘decision component’’ that evaluates whether the error should be ignored or whether it needs to be corrected and where the cutoff should be placed. Berg reports evidence for this planning of the cutoff from the distribution of cutoffs in his corpus of speech errors. He argues, for instance, that when the cutoff is placed right after a word-internal /d/, this phoneme is devoiced (which is the rule for word-final /d/ in German). This accommodation suggests that the cutoff is planned along with phonological material in the immediate preceding context. Another source of criticism comes from the neuropsychological literature. Given the localization of monitoring in the speech perception system, one would expect a relation between the two in different kinds of neurological impairment affecting language and speech. However, cases have been observed with impairments in monitoring (e.g., in jargon aphasia) but with relatively preserved comprehension (Marshall et al., 1998). In some of these cases, subjects fail to detect errors in their own speech, but do detect them when they are spoken by another person. Another example is that of McNamara et al. (1992). These authors investigated error repair in patients with Parkinson’s disease and with dementia of the Alzheimer type and compared them to a group of age-matched controls. It was found that both groups of patients corrected significantly fewer errors than the controls. This is especially striking since the patients with Parkinson’s disease had, in all likelihood, no problems with language comprehension. On the other hand, it
MONITORING MODEL
121
should be noted that the perceptual loop theory considers monitoring as comprising a number of subprocesses. Patients may have disturbances in some of these subprocesses but not in all of them. Thus, the finding of poor monitoring skills but unimpaired comprehension is not convincing evidence against the perceptual loop theory. The reverse dissociation is also reported. Marshall, Rappaport, and GarciaBunuel (1985) reported the case of a patient with good monitoring, despite poor comprehension skills. This latter case may be considered particularly wounding for the perceptual loop theory, because that theory implies that a necessary requirement for monitoring is unimpaired comprehension. It is important to note that this patient had a severely impaired auditory comprehension of sentences, words, and even nonlinguistic sounds. However, on a test of reading comprehension using mostly identical stimuli as in the auditory test, the patient performed well. This leaves open the possibility that the patient had an impairment in auditory recognition processes (the stage labeled ‘‘Audition’’) in Fig. 2, but that parsing and monitoring can still proceed through the inner loop (which bypasses auditory processing). Another study that claims to have found spared monitoring, despite comprehension problems, is that of Schlenk, Huber, and Willmes (1987). They studied the incidence of overt and covert repairs (they termed the latter category ‘‘prepairs’’) in three aphasic groups. These groups were Broca’s aphasics, Wernicke’s aphasics, and amnesic aphasics. The task was the description of pictures with sentences, taken from the Aachen Aphasia Test (AAT). In all patient groups, there were many more ‘‘prepairs’’ than repairs. Schlenk et al. concluded that prearticulatory monitoring is spared compared to postarticulatory monitoring. They further concluded that there must be an inner monitor which is unrelated to language comprehension, because the patients with Wernicke’s aphasia showed as many prerepairs as the other two groups, despite their relatively worse comprehension. How convincing is this evidence? Schlenk et al. reported that the Wernicke’s aphasics scored significantly worse on the auditory comprehension part of the AAT. However, this test includes auditory sentence comprehension. This leaves open the possibility that auditory word recognition is relatively unimpaired in that aphasic group, leaving important aspects of monitoring intact. The main interruption rule has also been challenged in recent years. Among these challenges is a study by Blackmer and Mitton (1991). They performed acoustical measurements on self-corrections in the speech of callers to a Canadian radio program. They were particularly interested in errorto-cutoff and cutoff-to-repair intervals. According to the main interruption rule, only the time after the interruption is used for planning the repair. If this is true, the cutoff-to-repair interval should reflect the duration of restart planning. However, Blackmer and Mitton (1991) showed that the time from cutoff-to-repair was often 0 ms. Furthermore, in almost 50% of the errors, the duration of the cutoff to-repair interval was extremely short (less than
122
HARTSUIKER AND KOLK
100 ms). Notice, by way of comparison, that it takes at least 170 ms to begin articulation of a prepared monosyllabic word (Sternberg, Monsell, Knoll, & Wright, 1978) upon presentation of a ‘‘Go’’-signal. Klapp and Erwin (1976) reported an even higher prepared response time for monosyllabic words (310 ms). Thus, these cutoff-to-repair intervals are inconsistent with the main interruption rule. Oomen and Postma (in press) performed a controlled production experiment and also measured error-to-cutoff and cutoff-to-repair intervals. Like Blackmer and Mitton, these authors obtained many self-repairs with very short cutoff-to-repair intervals and cutoff-to-repair intervals of 0 ms. According to Blackmer and Mitton (1991), the existence of such short cutoff-to-repair intervals is inconsistent with the main interruption rule, because repairs that follow the interruption with an interval of 0 ms must have been planned before the interruption. We return to the issue of the main interruption rule in the next section. Parenthetically, Blackmer and Mitton explained the existence of repairs with very short cutoff-to-repair intervals, by proposing a new monitoring mechanism which is localized at the level of the articulator. These authors assume that the articulator has an autonomous restart capability: As soon as this mechanism detects a lack of input, it restarts the production of previous material. Indeed, many of the repairs ‘‘on the fly’’ were repetitions of the form ‘‘I-I-I think. . .’’. Notice that the autonomous restart mechanism is not a monitor for errors, but rather a monitor for lack of input. Oomen and Postma (1999) provided further empirical evidence that appears to argue against the perceptual loop theory. In their experiment, participants described networks consisting of colored line drawings connected by multiple lines in two speech rate conditions: fast and normal. These conditions were determined by the speed with which a dot moved through the network. The rationale for the speed manipulation was a hypothesis derived from the perceptual loop theory. The hypothesis is that if speech rate is high, the articulator will process a given speech plan faster. Therefore, the time that the speech plan is stored in the articulatory buffer decreases. As a consequence, the onset of speech is somewhat earlier relative to the moment of interruption, increasing the error-to-cutoff interval.2 This is the case because the onset of speech depends on the end of the buffer time, but the moment of interruption depends on the beginning of the buffer time. The results did not confirm this prediction. Restricting the data to repairs of speech errors, the mean error-to-cutoff time was 453 ms in the normal condition and 311 ms in the fast condition. This difference was significant. Interestingly, Van Hest (1996) made a similar prediction with respect to 2
Oomen and Postma do remark that buffering is not the sole determinant of monitoring. They also suggest the possibility of differential use of computational resources for monitoring in speeded versus normal speech.
MONITORING MODEL
123
monitoring in a second language. She hypothesized that when bilinguals use their second language, interruptions are earlier than when they use their native language. The reason is that speech in the second language is slower, there is thus more buffering, and hence more time for detection and interruption. Whereas Oomen and Postma found an opposite from predicted effect of speech rate, Van Hest (1996) found no effect of language on the duration of error-to-cutoff intervals (although one should be careful in interpreting null effects; there may have been a statistical power problem). Summing up, there have been a number of criticisms on the perceptual loop theory. Criticisms from the neuropsychological literature concerned a lack of relation between monitoring and comprehension in populations with language impairments. However, there may well be alternative explanations for these findings. The finding of good comprehension in some patients, but poor monitoring skills, can be attributed to impairments to other subprocesses of monitoring (e.g., comparing intended and produced representations, generating intended representations, or storing these representations). The finding of poor comprehension, but a spared ability to monitor for errors is more wounding to the theory. However, it is conceivable that many patients classified as having poor comprehension have mainly problems with comprehension at the sentence level, leaving, e.g., word recognition intact. Criticisms from the psycholinguistic literature concerned the seemingly wrong predictions of the perceptual loop theory with respect to the placement and timing of interruption and repair. We turn to that issue in the next section. A MODIFIED MAIN INTERRUPTION RULE
Should we reject the main interruption rule on the basis of the data reported by Blackmer and Mitton (1991)? The main interruption rule would remain unchallenged if these repairs with very short cutoff-to-repair intervals are appropriateness repairs, which would not be interrupted immediately. However, Blackmer and Mitton reject this possibility: Many of the very short intervals were obtained with error repairs. A second possibility that would leave the main interruption rule intact in important respects is that the planning of the repair takes place in the interval between the detection of the error and the actual interruption. Blackmer and Mitton also reject this possibility. According to them the conceptualizer, formulator, and articulator are roughly simultaneously halted. Because the conceptualizer is occupied with planning some other utterance in the time before it is interrupted, it cannot be occupied with restarting in that period. However, notice that all depends on the assumption that the conceptualizer, formulator, and articulator are stopped simultaneously. This assumption may very well be wrong. It is important to realize that interrupting and repairing are quite different processes. Repairing is only necessary if the monitor detects an error. Interrupting is necessary for a variety of reasons. Sup-
124
HARTSUIKER AND KOLK
pose I am talking to you. Suddenly, the door of the room bursts open and someone shouts at us in a loud tone of voice. In all likelihood I will interrupt my speech, even though there were no errors in the speech I was producing. Other reasons for interrupting could be a need to cough, sneeze, or clear one’s throat. Yet another reason could be that in a dialogue an interlocutor ‘‘takes the floor, ’’ forcing you to interrupt. Therefore, we will consider interrupting of speech as an act of motor control that directly regulates the articulator. It thus bypasses the stages of formulation (see Fig. 2). This means that the repair can be constructed parallel to the planning of the interruption. An empirical argument in support of this notion can be derived from data reported in Ladefoged et al. (1973). These authors measured the time to inhibit speech after the presentation of a stop signal. This time was on average about 200 ms, independently of whether the signal was given in the beginning or in the end of the phrase. However, if the signal was given somewhat before the onset of speech, the time to stop increased. The authors excluded the possibility that this delay was caused by additional demands on signal perception. They concluded that it is necessary to start speech before a stop signal can have an effect. Ladefoged et al. interpreted this finding as follows: Interruption does not have an effect on the ‘‘speech organization’’ system, which creates a speech plan and stores it in a buffer. Only when the speech plan is fully encoded and stored in the buffer can an interruption exert an effect. This implies, consistent with the modified main interruption rule, that the process of interruption directly halts the articulator, bypassing linguistic processes. An important question addressed in the present article is to which extent the distribution of cutoff-to-repair intervals can be simulated, when we assume this modified version of the main interruption rule. PLAN OF THIS PAPER
As is clear from the overview above, the perceptual loop theory has not remained unchallenged. In particular, a number of findings concerning the time course of interruption and repair have been reported that seem to argue against this theory. It is not clear whether the model predicts these intervals, because until now there has not been a computational version of the theory that allows the calculation of such intervals. The purpose of the present paper is to present such a computational model that implements and elaborates the perceptual loop model. The model serves to answer the following questions: (1) do we need to postulate an inner monitor to explain the error-to-cutoff and cutoff-to-repair interval distributions reported in the literature (Blackmer & Mitton, 1991; Oomen & Postma, in press)? (2) If so, is the speech perception system, via which inner monitoring would occur, fast enough to obtain these intervals? (3) Is the modified main interruption rule consistent with the time course data of cutoff-to-repair intervals? (4) Can the model account for the
MONITORING MODEL
125
effects of speech rate on error-to-cutoff and cutoff-to-repair times obtained by Oomen and Postma? Implementation of the model required an elaboration of some of the stages and processes involved in speech production and monitoring that are not explicitly proposed in the original descriptions of the perceptual loop theory. A novel prediction concerns the effect of error location in the phrase on the timing of the interruption. In the remainder of this paper, we will first describe the model in some detail. Explicit attention will be given to input, output, and processing assumptions. Subsequently, we will report four simulation studies. MODEL DESCRIPTION
The present model extends and formalizes the monitoring theory of Levelt (1983, 1989). The model adds up temporal durations of a number of processing stages in order to predict the timing of interrupting and repairing. The model consists of a series of stages of speech production, speech comprehension, and monitoring. We distinguish the same stages as Levelt (1989) with respect to speech production (conceptualizing, formulating, and articulating), comprehension (audition, parsing), and monitoring (with Levelt, we assume the monitor is localized in the conceptualizer). A graphical depiction of the processing stages in the present model is represented in Fig. 2. Our model extends Levelt (1989) in two important respects. First, we distinguish two stages of articulation: (1) a selection stage, which selects or activates motor programs, and (2) a command stage, which controls execution of the unit. This implementation of articulatory processing is based on the work of Sternberg and colleagues (i.e., Sternberg et al., 1978; Sternberg, Wright, Knoll, & Monsell, 1980; Sternberg, Knoll, Monsell, & Wright, 1988). Notice that articulatory processing is unspecified in both Levelt’s (1989) theory and in a recent successor to that theory (Levelt, Roelofs, & Meyer, 1999) which is mainly concerned with lexical access. According to Sternberg and colleagues, the stages of articulation are serial and process a unit composed of a stressed (strong) syllable and any associated unstressed (weak) syllables. A graphical representation of the proposed model of articulation is represented in Fig. 3. According to Sternberg et al. (1988), the time interval between two units is the sum of the duration of the command stage for the first unit and the duration of the selection stage of the second unit. A second extension of the Levelt (1989) theory concerns monitoring itself and in particular the main interruption rule. We have distinguished three processing components within the monitor: comparing, restarting, and interrupting. Parsed speech, output from the speech comprehension system, is compared with a target (comparing). If the parsed speech matches the target, no action will be taken. However, if an error is detected, two parallel processes will be simultaneously set into motion: interrupting and restarting. As
126
HARTSUIKER AND KOLK
FIG. 3. Stages in articulation and definition of interunit time, as defined by Sternberg et al. (1988).
mentioned earlier, interrupting the speech stream is a process which will take some time itself, estimated by Levelt (1983) to last about 200 ms (see also Logan & Cowan, 1984). In the present model, we test the modified main interruption rule, which assumes that planning the interruption and generating the repair are parallel processes that start simultaneously and affect different stages. This rule is relevant with respect to the distribution of cutoff-to-repair intervals. The results of Simulations 1 and 2 do not depend on whether the modified or the old version of the main interruption rule is used, because these simulations deal with error-to-cutoff intervals only and not with cutoff-to-repair intervals. The two interruption rules make differential predictions only with respect to the latter type of interval. Simulation 3 deals with cutoff-to-repair intervals and explicitly tests the modified main interruption rule. Input to the Model Units of processing that are proposed to be relevant in speech production are the phonological phrase, the phonological word, the stress group, and the syllable (Booij, 1995; Nespor & Vogel, 1986; Sternberg et al., 1978, 1980, 1988; Wheeldon & Lahiri, 1997). The phonological phrase consists of a lexical head and all preceding or following function words (Booij, 1985). The phonological word consists of a lexical word and one or more cliticized function words (Wheeldon & Lahiri, 1997). The stress group consists of a strong syllable and one or more weak syllables (Sternberg et al., 1987). An example of a phonological phrase, consisting of three phonological words, each containing two syllables, is the Dutch phrase naar een blauwe tafel (to a blue table), which has the phonological structure (3) ϕ(ω(σ(na:) σ(r@n)) ω(σ(blA/) σ(w@)) ω(σ(ta:) σ(f@l))),
in which ϕ stands for a phonological phrase, ω for a phonological word, and σ for a syllable (phonemes are typed according to the Computer Phonetic Alphabet). It should be noted that theorists have not reached consensus about the
MONITORING MODEL
127
exact nature of the units of speech processing. For instance, there are no definitions of the phonological phrase that phonologists generally agree upon (Den Ouden, 1997). Furthermore, whereas Sternberg et al. (1988) regard the stress group as the unit of articulation, Wheeldon and Lahiri (1997) consider this to be the phonological word (a superordinate unit in the prosodic hierachy). Given this controversy, our model assumptions can only be a crude approximation with respect to the composition and size of processing units. However, we will demonstrate in Simulation 2b that the answers to our main questions do not depend on the particular assumptions made about the composition of the input. So what does the model input look like? In our simulations we generate distributions of processing times (i.e., error-to-cutoff intervals and cutoffto-repair intervals). Input to the model consists of a number of artificial phrases (either 100 or 1000) each of which represents a hypothetical phonological phrase. Each phrase consists of a number of digits. Each digit, except the last one, represents a single phonological word. The value of the digit represents the number of syllables in each word. The final digit indicates which word contains an error. An example of this coding scheme is (3′), which is an abstraction of (3). (3′) 2 2 2 1.
This codes for the following. There is a phonological phrase containing three words. Each word contains two syllables, and there is an error in the first word. In sum, a simulation consists of presentation to the model of a number of artificial phrases such as (3′). Each trial consists of an abstract representation for a (hypothetical) phonological phrase with an error in one of its constituent words. The input is not coded for the position within the word the error occurs, nor for the type of error. Processing Times in the Model An overview of the basic durations for each time interval is provided in Table 1. It is essential to remark that the simulations are stochastic. Each basic time interval is transformed by adding random noise, in order to obtain variation in the predicted error-to-cutoff times. Variation is necessary in order to be able to fit distributions of time intervals. The amount of noise was a parameter in many of the simulations. In order to prevent the transformed time intervals from becoming too close to 0 or even negative, the minimum duration for each transformed interval was set at 30 ms. In the remainder of this section, we will discuss the assumptions about the duration of each component, first for production and then for comprehension. In the subsequent section, we will provide an algebraic definition of the model.
128
HARTSUIKER AND KOLK
TABLE 1 Basic Duration of Each Time Interval in the Model Stage
Symbol
Duration (ms)
Per unit
Phonological encoding Selection Command Audition Parsing Comparing Interrupting Restart planning
Tphon Tsel Tcom Taud Tparse Tcomp Tint Trestart
110 100 100 50 100 50 150 50
σ ω σ ω ω ω ω ω
Note. ‘‘Restart planning’’ is a parameter that represents the duration of repeated execution of selection processes before phonological encoding minus the time benefit obtained from priming the to-be-selected units.
Production We will now list the assumptions about the duration of each production component. To begin with, we assume that the times for message generation and grammatical encoding are constant for each phonological phrase. Time for phonological encoding takes a constant value of 110 ms per syllable. This estimate is based on a study reported in Wheeldon and Levelt (1995) in which participants monitored for the occurrence of segments in target words. The 110 ms was the difference in reaction time between the onset consonant of the first syllable and of the second syllable in that task. The next two stages in production are articulatory stages: selection and command. It should be noted that these stages were uncovered in a very constrained experimental paradigm: the prepared speech paradigm. This task required the speaker to generate an utterance and start articulating it, when a ‘‘go’’-signal is presented after a variable interval. It remains a matter of further research whether the Sternberg et al. (1978, 1980, 1988) model also applies to running speech. However, not all details of the Sternberg model are essential for our present purposes. Crucial are the assumptions that it takes some time to select a plan for action and, consequently, to execute that plan. It is also crucial that the combined duration of selection and command defines the interunit time between syllables and thus the speaking rate. We simplify the durational aspects somewhat: in particular, in the Sternberg et al. model, the duration of selection is a linear function of the number of elements in the buffer (there is an increment of about 10–15 ms for each additional element). However, as an approximation we assume that the selection stage is constant, independent of the number of elements in the phrase or in the buffer at a given point in time. We assume that the duration of the command stage is a constant multiplied
MONITORING MODEL
129
by the number of syllables in the phonological word. The linear dependence on the number of syllables in the command stage is also a (minor) simplification: According to Meyer (1994) the duration of a spoken word increases with the total number of syllables in that word, but to a smaller extent than would be expected on the basis of linear extrapolation. In addition, phonetic studies (Crystal & House, 1988a–1988d, 1990) have shown that the utterance duration for a given syllable depends on such variables as the CV structure and the stress value for that syllable. These variables are not taken into account in the present model. Comprehension and Monitoring On the comprehension side, we have defined temporal relations for the processes of auditory analysis (as part of the outer loop), of parsing speech, and of the three monitoring processes: comparing, interrupting, and restarting. These processing times are constant for each phonological word. They are 50 ms for auditory input processing, 100 ms for parsing, 50 ms for comparing, and 150 ms for interrupting. These figures conform to the lower limit of an estimation reported in Levelt (1989, p. 473). Levelt cites work by Marslen-Wilson and Tyler (1980) that shows word recognition is possible about 200 ms after word onset. More recent evidence using an eye-tracking paradigm confirms this estimate (Allopena, Magnuson, & Tanenhaus, 1998). On the basis of that figure, Levelt estimates the duration of internal word recognition to be 150–200 ms. The interrupting parameter is set at a value of 150 ms (in some simulations, this parameter is systematically varied). This basic duration is compatible with data reported on the stopping of movements in general (Logan & Cowan, 1984) and on the stopping of speech in particular ( Ladefoged et al., 1973). Logan and Cowan report an estimate for the stop-signal reaction time of 200 ms, the time between the presentation of the stopping signal and the effectuation of the interruption. Because it takes some time to perceive the stopping signal, a small value (say 50 ms) should be subtracted from the 200 ms, resulting in a duration for implementing the interruption itself of 150 ms. The last parameter, restart planning, determines the duration between error detection and the onset of a restart. We assume that the conceptualizing and grammatical encoding parts of the restart take only a little time, especially for repairs of phonological errors, in which case the conceptualization and grammatical encoding processes will in general have the same, correct representation still available. We further assume that the preparatory processes preceding the utterance of the repair are a function of the duration of the phonological and articulatory processes, but that there is also a gain from earlier attempts at the same word: a priming effect. There are many reports (e.g., Forster & Davis, 1984) that there is a facilitation in reaction time when a given word is named a second time. In the present model, the increment
130
HARTSUIKER AND KOLK
in time because of repeated conceptualization and grammatical encoding for the restarted word and the decrement in time because of the facilitatory priming effect are accounted for in a single parameter. This parameter is set at 50 ms. Output of the Model With the assumptions about stages, durations, and processing mechanisms sketched above, we now have sufficient information to add up the relevant temporal durations for the production of a given phonological phrase with an error in a given position. The model calculates a number of time intervals: (1) error-to-cutoff interval if the error is intercepted by the inner loop; (2) error-to-cutoff interval if the error is intercepted by the outer loop; (3) cutoffto-repair times for inner and outer loop. These time intervals are calculated for each phrase that is presented as input, so that we obtain distributions of intervals. These intervals are calculated in the following manner (see Fig. 2). First, on each particular trial, each basic duration (Tx ) is transformed according to Eq. 1: τ x ⫽ Max(30, G(Tx ; S ⋅ Tx )),
(1)
where the function G(M; SD) yields a random number, drawn from a Gaussian distribution with mean Tx and SD of S ⋅ Tx . Subsequently, the maximum (the function Max) is taken of the resulting duration and 30 ms. The error-to-cutoff intervals are determined by subtracting the moment of word onset (the beginning of the command stage) for a given unit i from its moment of interruption(M int, i ). The beginning of word onset is calculated according to Eq. 2: Begin com, i ⫽ End phon, i ⫹ Max(0, End com, i⫺1 ⫺ End phon, i ) ⫹ τ sel, i .
(2)
In Eq. 2, each value End x, i is defined as the sum of the beginning of onset of process x for unit i (Begin x, i ) and the duration of that process (τ x, i ). Equation 2 shows that the beginning of word onset for word i depends on the moment when phonological encoding is completed, a buffer time if the previous word (i ⫺ 1) is still being articulated, and the duration of the selection stage. The moment of interruption, when the error is detected through the inner loop, is defined according to Eq. 3. When the error is detected through the outer loop, the moment of interruption is defined according to Eq. 4: M int, i, In ⫽ End phon, i ⫹ C parse, i, i⫺1 ⫹ τ parse, i ⫹ C comp, i, i⫺1 ⫹ τ comp, i ⫹ τ int, i
(3)
MONITORING MODEL
131
M int, i, Out ⫽ Begin com, i ⫹ τ aud, i ⫹ C parse, i, i⫺1 ⫹ τ parse, i ⫹ C comp, i, i⫺1 ⫹ τ comp, i ⫹ τ int, i .
(4)
Equation 3 shows that the moment of interruption for word i through the inner loop depends on the end of phonological encoding for that word (at that moment, the word becomes available for inspection), the time to parse the word, the time to compare the parsed word with the intended representation, and the time to implement the interruption in speech. Equation 4 shows that the moment of interruption for word i through the outer loop depends on the onset of the word in overt speech, the time for auditory processing of the word (resulting in a phonetic string), the time to parse the phonetic string, the time to compare the parsed word with the intended representation, and the time to implement the interruption. In Eqs. 3 and 4, each correction factor C x, i, i⫺1 for process x and unit i is defined according to Eq. 5: C x, i, i⫺1 ⫽ Max(0, End x, i⫺1 ⫺ End x⫺1, i ).
(5)
In Eq. 5, x⫺1 refers to the preceding stage. The effect of these correction factors is a delay in the beginning of stage x for unit i, when that stage is still occupied with unit i⫺1. Notice that there is no correction factor for the peripheral stages of interrupting and audition. The reason for not correcting asynchronies between interrupting a previous unit and comparing is that we are not concerned with the situation in which more than one unit of a given phrase is erroneous. We further assume that auditory processing is continuous; that is, audition begins as soon as the signal is physically present. Finally, the cutoff-to-repair interval is defined as the difference between the beginning of the repair (Eq. 6) and the moment of interruption (Eq. 7). Begin repair ⫽ Begin int ⫹ τ restart ⫹ τ phon ⫹ τ sel
(6)
M int ⫽ Begin int ⫹ τ int .
(7)
Equations 6 and 7 show that both of the relevant moments in time can be defined relative to the beginning of the interruption process (that is, the moment the error is detected). Because of this temporal alignment, it does not matter for the calculation of this interval which loop actually detected the error. SIMULATION STUDIES
We will report four simulation studies, which attempt to assess the predictions of the perceptual loop theory with respect to the time course of interruption and repair. In a fifth subsection, we will spell out a novel model prediction with respect to the position of the error. The target data concern only
132
HARTSUIKER AND KOLK
error repairs. We ignore appropriateness repairs, for two reasons. The first reason is that Levelt (1983, 1989) suggested the existence of a conceptualizer-internal monitoring loop, dealing with appropriateness repairs. If this is true, appropriateness repairs could be instantiated by one of three monitoring loops (outer, inner, conceptualizer-internal), thus complicating the issue. The second reason is that appropriateness repairs would constitute an exception to the main interruption rule: Their interruption is delayed. Including these repairs would thus alter the timing of interruption. Simulation 1: Error-to-Cutoff Intervals Generated by the Outer Loop The purpose of the first simulation was to show that an inner monitoring mechanism is necessary in order to account for the distribution of error-tocutoff intervals, as reported by Blackmer and Mitton (1991) and by Oomen and Postma (in press). Of course, Levelt (1983) already reported error repairs like v.horizontal. Given the average duration of a single consonant of about 70 ms (Crystal & House, 1988b) it is unrealistic to assume that such repairs are generated by the outer monitoring loop. However, repairs with the cutoff right after the first segment are infrequent (comprising 4.2% of the errors in Berg, 1986). Another argument one might raise against the inner loop is that it is unclear what ‘‘covert repairs’’ are. If these incidents are indeed repairs of errors, it is obviously necessary to postulate an inner monitor that generated them. On the other hand, it is possible that incidents classified as ‘‘covert repairs’’ are not repairs at all (Clark & Wasow, 1998), in which case an inner monitor does not have to be postulated. Thus, it seemed important to us to compare, through simulation, the model predictions with respect to the complete empirical distribution of error-to-cutoff intervals, when error monitoring is accomplished through the outer loop only. Target data. The data to be simulated are the distribution of error-to-cutoff intervals of overt error repairs. Blackmer and Mitton (1991) obtained an average error-to-cutoff duration of 426 ms and a standard deviation of 300 ms. They further reported that many error-to-cutoff intervals were very short, with 14.5% below 150 ms (for all overt repairs, including appropriateness repairs). We have gathered more detailed information about the distribution of error-to-cutoff intervals by analyzing the sample of data obtained by Oomen and Postma (in press). In that experiment, 24 subjects described 20 networks of colored line drawings, 10 in a ‘‘fast’’ speaking rate condition and 10 in a ‘‘normal’’ speaking rate condition. Oomen and Postma took a sample of 20% of the data and measured the duration of error-to-cutoff intervals. We selected a subset of these intervals, taking only incidents which were unambiguously error repairs and which were not part of multiple interruptions or repairs. There were 98 repairs that satisfied these restrictions, 39 in the ‘‘normal’’ speech condition and 59 in the ‘‘fast’’ speech condition. We removed three intervals that were more than 3 SD away from the mean.
MONITORING MODEL
133
FIG. 4. Histogram of the empirical distribution of error-to-cutoff intervals. Labels on the horizontal axis indicate the midpoint of each category.
There remained a corpus of 95 intervals, 57 in the fast condition and 38 in the normal condition. The distribution of error-to-cutoff intervals is provided in Fig. 4. The empirical distribution had a mean of 321 ms, a median of 300 ms, and a standard deviation of 195 ms. The proportion of intervals shorter than 200 ms was 0.32. As can be seen in Fig. 4, the distribution of error-to-cutoff intervals was positively skewed (skewness was 0.92). Notice that the mean durations and the standard deviations are shorter than those reported by Blackmer and Mitton (1991). This can be explained by the removal of outliers in the current analysis. Method. If the ‘‘outer loop’’ were the only monitoring loop, as is tested in this simulation, a repair is initiated on the basis of the overt signal. The time course of the interruption process then depends only on the perception parameters and on the interruption time, as can be seen by subtracting Eqs. 2 and 4. The composition of the input phrase is also irrelevant for the outer loop predictions, because the comprehension and monitoring durations do not depend on the number of syllables or on the number of preceding words. The basic durations, as listed in Table 1, were used, except for the varied parameters (see below). The comprehension and comparing parameters create a constant value of about 200 ms between the onset of a word and the detection of the error. Notice that these parameters were set at a minimal value, relative to the duration of 200 ms for word recognition reported in the literature, rather than at a typical value. The consequence of this choice of parameters is that we maximize the probability of finding a fit between empirical and model distributions. The reason is that if we set these durations at longer values, the model would predict very long error-to-cutoff intervals on average.
134
HARTSUIKER AND KOLK
The parameters varied were (1) interrupting time. This parameter was varied between 100 and 250 ms in steps of 50 ms; (2) the scaling factor S of the SD of Gaussian noise added to each basic duration (see Eq. 1). We varied this parameter, which we will refer to as noise level from now on, between 0 (no noise) to 2.6 (extreme noise), in steps of 0.2 for noise levels below 1.0 and in steps of 0.4 for higher noise levels. The input consisted of 99 artificial phrases that each represented three disyllabic words. In 33 phrases the error was in the first word, in 33 in the second word, and in 33 in the third word.
Results and discussion. For each combination of the parameters interruption duration and noise level, the model was run with 99 phrases and the distribution of the error-to-cutoff intervals was analyzed. Thus, for each combination of parameters, a distribution was generated based on 99 data points. We compared each predicted distribution with the empirical distribution obtained by Oomen and Postma using a Kolmogorov–Smirnov test for twoindependent samples. This test is sensitive to differences in the distribution with respect to central tendency, dispersion, skewness, etc. (Siegel & Castellan, 1988). In Table 2, we show the mean, standard deviation, and skewness of each simulated distribution and the p value, obtained from the Kolmogorov–Smirnov test. A significant value indicates that the empirical and simulated distributions are different. TABLE 2 Model Distributions of Error-to-Cutoff Intervals and Fit with Empirical Distribution for Each Combination of Noise Level and Interruption Time (Tint ) in Simulation 1 Noise level Tint
0.2
0.4
0.6
0.8
1.0
1.4
1.8
2.2
2.6
100 M SD Skewness p
302 34 0.30 .0005
307 61 0.16 .0005
338 98 0.08 .005
336 103 0.70 .0005
366 145 0.86 .05
379 185 0.84 .05
462 275 0.96 .0005
477 254 0.56 .0005
589 358 0.76 .0005
150 M SD Skewness p
346 34 0.33 .0005
356 85 0.16 .0005
393 118 0.50 .0005
412 187 0.86 .005
403 171 0.90 .0005
508 241 1.03 .0005
557 316 1.41 .0005
616 371 0.77 .0005
662 389 0.88 .0005
200 M SD Skewness p
407 46 0.24 .0005
391 101 0.22 .0005
410 137 0.21 .0005
427 163 0.21 .0005
448 184 0.23 .0005
546 367 0.97 .0005
615 379 0.94 .0005
678 398 0.47 .0005
675 422 1.07 .0005
250 M SD Skewness p
443 53 ⫺0.29 .0005
465 109 0.24 .0005
460 159 0.21 .0005
502 210 0.37 .0005
501 269 0.51 .0005
589 288 0.64 .0005
638 406 0.71 .0005
665 406 0.74 .0005
757 523 0.99 .0005
Note. Predicted distributions are based on the outer loop only, with 99 phrases.
MONITORING MODEL
135
Table 2 shows that the simulated distribution differs significantly from the empirical distribution for each parameter combination tested. This demonstrates that the model with only an outer loop is not capable of predicting realistic error-to-cutoff intervals. Inspection of the simulated distributions shows that there are different reasons for some of these significant differences. In most of the generated distributions the means were much too high. An exception to this were the distributions that were obtained when the interruption time was 100 ms. In the low noise level conditions, the standard deviations of these distributions were much too low. The best fit is obtained when the interruption time is 100 ms and the noise level is 1.4. Even that distribution was, however, significantly different from the empirical distribution. The finding that none of the tested combinations of interruption time and noise level produced a well-fitting distribution is not an artifact of the values of the other model parameters. First, values of the production parameters do not influence the outer loop predictions, nor does the composition of each input phrase. Second, the parameters that do determine the distribution, the parameters on the perception side, are all chosen to be as minimal as possible (auditory processing 50 ms, parsing 100 ms, and comparing with intended word 50 ms). If these parameters had been chosen to be larger, the resulting distributions of error-to-cutoff times would have even larger means than the ones obtained with the present parameters. As a result, these distributions would differ even more from the empirical data than the present distributions. Finally, it cannot be argued that the goodness of fit test is so sensitive to distributional differences that it is impossible to generate predictions that do not differ from the empirical distribution. In fact, if we reduce the interruption time to an unrealistic value of 0 or 50 ms (and set noise levels between 1.4 and 1.8) distributions are obtained that do fit the empirical data. In sum, the conclusion of the first simulation is the following. It is impossible to generate the empirically obtained distributions of error-to-cutoff intervals with a model that contains an outer monitoring loop only, unless one makes unrealistic assumptions about the time for interrupting. Simulation 2: Combining the Outer and Inner Loops Simulation 1 showed that it is impossible to simulate the empirical distribution of error-to-cutoff intervals with a model that contains only an outer loop. The implication is that the inner loop contributes to this distribution. Although many of the errors detected by the inner loop will be corrected covertly, a fraction of these errors, the errors that are discovered relatively late, will be corrected overtly, contributing to the empirical distribution of error-to-cutoff times. In this simulation, we attempt to obtain a better fit with the target data using a combination of the inner and outer loops. An important problem is determining the extent to which each monitoring loop contributes to the
136
HARTSUIKER AND KOLK
distribution of error-to-cutoff intervals. We will assume that the inner loop has the first opportunity to intercept an error, but misses a given proportion of the errors that are present. The outer loop will only operate on those errors not detected by the inner loop. Notice therefore that the distribution of errorto-cutoff intervals results from two different types of incident: Errors that are detected relatively late by the inner loop and result in overt repairs, and errors that are not detected by the inner loop, but are detected and corrected by the outer loop. A given distribution of overt repairs will then consist of two fractions, one fraction for each monitoring loop. We can estimate the fractions of overt repairs generated by each loop for a given data set if we know two empirically observable quantities. The first quantity, which we call β, is the proportion of covert repairs out of all repairs (overt and covert). The second quantity, δ, is the proportion of errors that are repaired out of all overt errors. Given a number of assumptions, it can be shown (see Appendix) that these two quantities allow us to estimate p, the accuracy of the monitor and x, the proportion overt repairs out of the errors which are detected by the inner loop. The parameters p and x allow us to estimate how much each loop contributes to the total number of overt repairs. Oomen and Postma (in press) obtained values for β of 0.49 and 0.55 and values for δ of 0.52 and 0.57 in fast and normal speech conditions respectively. The estimated proportion of overt repairs made by the outer loop then varies between 0.71 and 0.74. We tested two situations: (1) a situation that corresponds closely to this estimate (i.e., 67% outer loop and 33% inner loop 3 ); (2) a situation in which the contribution of each loop is quite different (50% outer loop and 50% inner loop). We tested the second situation in order to see the robustness of a possible fit, given that our estimations depend on certain assumptions. Violations of these assumptions would have consequences for the calculation of the proportion overt vs. covert repairs. Method. Model distributions were generated on the basis of the predicted error-to-cutoff intervals for each monitoring loop and the parameter that specified the contribution of the outer loop (either 50 or 67%). First, the error-to-cutoff intervals generated by the inner loop were ordered and only intervals with a value larger than 0 ms were considered. Second, depending on the contribution parameter, either 50 or 33% of these intervals were selected at random. These intervals constituted the fraction of error-to-cutoff intervals produced by the inner loop. For the remaining 50 or 67% of the phrases, the error-to-cutoff interval based on the outer loop was selected. As in Simulation 1, the durations of the interruption interval and the noise level were varied. The basic durations (see Table 1) were used for all other temporal intervals, and we used the same set of input phrases as before. Again, the Kolmogorov–Smirnov test was used to decide whether the observed and predicted distributions differed significantly.
Results and discussion. The mean, standard deviation, and skewness of each predicted distribution and the significance of the Kolmogorov–Smirnov test (two-tailed) are listed in Table 3 (for a partitioning of 67% outer loop 3
A close approximation, rather than the exact value, was chosen for practical reasons.
137
MONITORING MODEL
TABLE 3 Model Distributions of Error-to-Cutoff Intervals and Fit with Empirical Distribution for Each Combination of Noise Level and Interruption Time (Tint ) in Simulation 2 Noise level Tint
0.2
0.4
100 M 240 245 SD 99 109 Skewness ⫺0.88 ⫺0.05 p .0005 .005
0.6
0.8
1.0
1.4
1.8
2.2
2.6
281 129 ⫺0.26 ns
266 129 0.36 ns
288 144 0.50 ns
341 210 0.92 ns
324 234 1.25 ns
389 268 1.06 ns
422 298 1.46 .05
298 134 0.08 ns
293 165 0.65 ns
325 173 0.49 ns
409 239 0.87 .05
390 264 0.98 ns
516 580 360 404 0.99 0.95 .0005 .0005
150 M 278 SD 110 Skewness ⫺0.79 p .05
300 121 ⫺0.44 ns
200 M 330 SD 120 Skewness ⫺1.1 p .005
345 129 ⫺0.53 .005
344 153 ⫺0.04 .05
358 189 0.41 .05
423 236 0.45 .005
472 308 0.64 .005
544 567 575 348 331 471 0.89 0.40 1.51 .0005 .0005 .0005
250 M 371 373 SD 138 161 Skewness ⫺0.95 ⫺0.14 p .0005 .005
386 188 0.48 .05
422 223 0.54 .005
467 503 259 343 0.45 1.37 .0005 .005
570 680 755 365 509 534 1.03 1.00 1.17 .0005 .0005 .0005
Note. Predicted distribution is based on a combination of 33 intervals generated by the inner loop and 66 intervals generated by the outer loop.
and 33% inner loop monitoring) and Table 4 (for an equal partitioning of both monitoring loops). As is shown in Tables 3 and 4, both partitionings yield distributions that fit well for a wide range of the noise parameter, in particular for interruption times of 150 ⫾ 50 ms. This is important, because those are the most plausible times (the 200 ms that Logan & Cowan propose for signal-stop RT, with a value between 0 and 100 ms subtracted for signal perception). Tables 3 and 4 show that in addition to the many parameter combinations yielding well-fitting distributions, there are distributions that are significantly different from the empirical distribution. They are different for three different reasons: (1) central tendency and dispersion are too large; (2) central tendency and dispersion are too small; (3) skewness is different. Given these different patterns, it cannot be argued that the good fit comes about because the comprehension parameters were set at minimal durations so as to optimize the fit (as was the case in Simulation 1). In sum, we were able to simulate the empirically obtained distribution
138
HARTSUIKER AND KOLK
TABLE 4 Model Distributions of Error-to-Cutoff Intervals and Fit with Empirical Distribution for Each Combination of Noise Level and Interruption Time (Tint ) in Simulation 2 Noise level Tint
0.2
0.4
0.6
0.8
1.0
1.4
1.8
2.2
2.6
100 M 209 215 251 SD 104 105 123 Skewness ⫺0.32 ⫺0.01 ⫺0.09 p .0005 .0005 .10
232 126 0.43 .05
253 144 0.67 .10
310 196 0.90 ns
292 205 0.79 ns
339 237 1.12 ns
373 253 1.35 .10
150 M 241 SD 119 Skewness ⫺0.29 p .05
268 122 ⫺0.19 ns
270 138 0.17 ns
260 154 0.86 ns
283 158 0.45 ns
368 230 1.00 ns
355 249 0.97 ns
469 336 1.07 .005
524 381 1.06 .0005
200 M 293 SD 130 Skewness ⫺0.62 p .10
312 134 ⫺0.35 ns
310 149 0.03 ns
325 183 0.55 ns
386 233 0.54 .05
430 291 0.76 .05
491 337 1.17 .005
515 541 317 460 0.52 1.73 .0005 .0005
250 M 337 SD 144 Skewness ⫺0.52 p .05
339 163 ⫺0.02 ns
355 196 0.59 ns
395 226 0.62 .05
427 251 0.72 .005
457 335 1.64 .05
529 631 703 337 492 525 0.80 1.07 1.25 .0005 .0005 .0005
Note. Each predicted distribution is based on a combination of 49 intervals generated by the inner loop and 49 intervals generated by the outer loop.
of error-to-cutoff intervals, when the outer loop is combined with an inner monitoring loop. In the remainder of this paper, we will fix the partitioning of the distribution at 33.3% inner loop and 66.7% outer loop, because that partitioning corresponds closely to the decomposition based on empirical estimations. Simulation 2a: Duration of Articulation The previous simulation showed that a combination of the inner and outer loop yields a good fit with empirically obtained distributions. However, all the data in Tables 3 and 4 are based on simulations with a number of fixed parameters. It is not clear whether the results generalize across parameter values or across different compositions of the phrases. Therefore, we performed two additional simulations, exploring the effect of temporal manipulations of articulatory processing (this simulation) and of the composition of the input (Simulation 2b).
139
MONITORING MODEL
TABLE 5 Model Distributions of Error-to-Cutoff Intervals and Fit with Empirical Distribution in Simulation 2a Noise level Tsel , Tcom
0.6
0.8
1.0
1.2
1.4
100 M SD Skewness p
296 137 ⫺0.03 ns
316 158 0.57 ns
325 176 0.35 ns
381 206 0.99 .05
358 240 0.90 ns
150 M SD Skewness p
287 139 0.30 ns
298 150 0.23 ns
325 187 0.58 ns
366 199 0.33 .05
387 228 0.57 .05
200 M SD Skewness p
290 161 0.22 ns
310 133 ⫺0.10 ns
327 173 0.26 ns
319 174 0.44 ns
385 192 0.41 .05
Note. The three different values for Tint and Tcom correspond to speech rates of 150, 225, and 300 ms per syllable. The noise level (S) is varied between 0.6 and 1.4 and articulation duration (Tsel and Tcom ) between 100 and 200 ms. Tint is held constant at 150 ms.
Method. The basic duration of the articulation parameters for selection and command (Tsel and Tcom ) was varied between 100 and 200 (with the constraint that both parameters had the same value 4 ). The noise level was varied between 0.6 and 1.4 in steps of 0.2. The same set of basic parameters was used as in the previous simulations and the same set of 99 input phrases was used.
Results and discussion. Table 5 reports the mean, standard deviation, and skewness of each generated distribution and the p value of the Kolmogorov– Smirnov test. Table 5 shows that for a range of values of the articulatory parameters, yielding speech with a rate ranging from 150 to 300 ms per syllable, there is a fit between the empirical and simulated distributions. This range of speech rates encompasses the empirical speech rates that Oomen and Postma (1999) obtained (ranging from 222 to 277 ms per syllable). Simulation 2b: Phrase Structure In the present simulation, the effect of the composition of the input phrase on the distribution of error-to-cutoff intervals was studied. We kept the con4
This constraint was built in to reduce the degrees of freedom of the model.
140
HARTSUIKER AND KOLK
TABLE 6 Model Distributions of Error-to-Cutoff Intervals and Fit with Empirical Distribution in Simulation 2b Phrase structure 1 1 1 1 2 2 2 2
1 1 2 2 1 1 2 2
1 2 1 2 1 2 1 2
M
SD
Skewness
p
344 327 323 332 312 311 337 311
154 182 147 153 146 161 166 168
0.31 1.3 0.31 ⫺0.01 0.13 0.38 0.39 0.67
.10 ns ns .10 ns ns ns ns
Note. Phrase structure is varied, so that the word in each of three positions consists of either one or two syllables. The noise level (S) is kept constant at 0.8, Tint is held at 150 ms, and Tsel and Tcom at 100 ms.
straint that each phrase was three words long, but varied the number of syllables for each word. Method. The number of syllables for each of three words in the phrase was systematically varied (one or two). Thus, there were eight different compositions, as is shown in Table 6. For each composition, 99 phrases were run, balancing the position of the error. The basic set of parameters was used and the noise level was set at 0.8.
Results and discussion. Table 6 shows the mean, SD, and skewness of predicted distributions and the p value of the Kolmogorov–Smirnov test. Table 6 shows that the model predictions are robust to variations of the composition of the phrase. This is important, because it shows that our model predictions for a given phrase do not depend critically on the way the phrase would be parsed in a particular phonological theory (e.g., it does not matter critically whether a given syllable is the last syllable of the first word or the first syllable of the second word). Of course, we certainly acknowledge the possibility that more detailed assumptions about phonological structure could lead to more accurate predictions. However, the present approximation of the structure of a given set of input phrases suffices for our present purpose of fitting the distributions. In sum, the variations of the model reported in Simulations 2a and 2b show that the conclusions from Simulations 1 and 2 are valid. These conclusions do not depend on the values of the articulatory parameters (Simulation 2a) or the composition of the input phrases (Simulation 2b). Simulation 3: Cutoff-to-Repair Intervals with the Modified Main Interruption Rule In this simulation we attempted to account for the empirical distributions of cutoff-to-repair intervals, assuming the modified main interruption rule.
MONITORING MODEL
141
This rule, in contrast to earlier proposals by Blackmer and Mitton (1991) and Levelt (1989), allows restart planning to start concurrently with the process of interruption. This new assumption has important consequences for the time course of processing, since it allows for cutoff-to-repair intervals of 0 ms. Another goal of this simulation is to establish whether the model simulates the effect of speech rate on the mean duration of cutoff-to-repair intervals. Oomen and Postma (in press) found that these intervals were significantly shorter in the condition with fast speech. Does an effect of speech rate follow from our model? This raises an important question: How are the different production processes affected by an increase in speech rate? We will discuss the issue in more detail in Simulation 4. For now, we assume that faster speech implies that every production process is decreased with a constant factor. We will first report the results of a single run with the model, attempting to fit the overall distribution of cutoff-to-repair intervals. Second, we will report simulations in which speech rate is varied. The latter simulations are done by first setting the standard articulatory parameters (Tsel and Tcom ) so that the duration per syllable corresponds to that of normal speech. Simulations with fast speech were performed by decreasing Tsel and Tcom so that the duration per syllable of fast speech is obtained, and then the duration of phonological encoding and restart planning was decreased with the same factor. Target data. Target data were the cutoff-to-repair intervals based on the corpus of 98 repairs taken from Oomen and Postma (in press). We removed a single outlier, which differed more than 3 SD from the mean. Many of these time intervals (11.3%) had a value of 0 ms. The empirical distribution is shown in Fig. 5. Table 7 reports the mean, standard deviation, and skewness of the empirical and model distribution for the overall corpus and for the fast and normal conditions. In the larger corpus of Oomen and Postma, the mean duration was 354 ms in the normal condition and 245 ms in the fast condition. As is shown in Table 7, in our subset of 97 repairs, the mean duration was 276 ms in the normal condition and 259 in the fast condition. If the outlier is included the mean duration in the normal condition is 308 ms. The difference in our subset is much smaller, but it is important to notice that the exclusion of a single outlier was responsible for a difference of almost 30 ms. In the means that Oomen and Postma (1999) reported, outliers were not excluded. Importantly, the difference they found was still significant. Method. First, we attempted to simulate the overall distribution of cutoff-to-repair intervals, with the basic parameter set (Table 1). Pilot simulations showed that in order to obtain wellfitting predicted distributions, we had to increase the duration of articulatory processing. We increased Tsel and Tcom to 170 ms each and held all other basic parameters constant. This value of 170 ms is realistic given the speech rates that Oomen and Postma (1999) observed. The noise level was 0.4 and we used 99 phrases, consisting of triplets of disyllabic words. The
142
HARTSUIKER AND KOLK
FIG. 5. Histogram of the empirical distribution of cutoff-to-repair intervals. Labels on the horizontal axis indicate the midpoint of each category.
TABLE 7 Mean, SD, and Skewness for Overall, Normal, and Fast Empirical and Simulated Distributions of Cutoff-to-Repair Intervals in Simulation 3 (Data Points More than 3 SD from Mean Are Excluded)
Overall Data Model Normal Data Model Fast Data Model
M
SD
Skewness
266 293
237 192
1.55 0.27
276 313
236 207
0.88 0.34
259 207
239 166
2.00 0.57
location of the error was balanced. The resulting generated distribution was compared with the empirical distribution using a Kolmogorov–Smirnov test of goodness of fit. Second, we ran simulations with a normal and a fast variant. In the normal variant, Tsel and Tcom were set at 185 ms each, and all other intervals were held constant. In the fast variant, Tsel and Tcom were each set at 148 ms. All other production parameters were decreased with the factor 0.8, which is equivalent to the decrease in the articulatory parameters. As a result, phonological encoding was set at 88 ms and restart planning was set at 40 ms in fast speech.
MONITORING MODEL
143
Results and discussion. The mean and standard deviation of the simulated distribution (‘‘overall condition’’) are reported in the second row of Table 7. As in the empirical distribution, there were many intervals with a duration of 0 ms (11.1%). The generated and empirical distributions did not differ significantly on the Kolmogorov–Smirnov test for two-independent samples (D ⫽ .16; p ⫽ .151). The model thus simulated the overall distribution of cutoff-to-repair intervals. Does an effect of speech rate follow from our model? The distributional characteristics of the normal speech and fast speech conditions are listed in the fourth and sixth rows of Table 7. The table shows that the mean predicted cutoff-to-repair time in fast speech was much shorter (207 ms; SD ⫽ 166 ms) than that in normal speech (313 ms; SD ⫽ 207 ms). In sum, the model correctly produces a decrease in cutoff-to-repair times with faster speech. Why does the model predict this effect? The duration of the cutoff-torepair interval in the model depends on the difference between the production parameters (phonological encoding, selection, restart planning) and the interruption time, as can be inferred from Eqs. 6 and 7. If any of the production parameters (except Tcom ) decreases, the cutoff-to-repair time will also decrease. Thus, the prediction follows quite naturally from the assumption that in faster speech, the production processes require less time. Simulation 4: Effects of Speech Rate on Error-to-Cutoff Intervals The purpose of the present simulation was to model the effect of speech rate on the distribution of error-to-cutoff intervals. This raises a theoretically important question: How are the different processing stages affected by a manipulation of speech rate? Is the duration of each stage modified or are only the output stages affected? Oomen and Postma (in press) assumed the latter alternative. These authors showed that there was a significant effect of speech rate on the mean duration of error-to-cutoff intervals. The mean duration was 311 ms in the fast condition and 453 ms in the normal condition. In our subset of these data, there was also a large difference between the two conditions (mean durations were 288 ms in the fast condition and 371 in the normal condition, outliers were removed). Oomen and Postma had expected a difference in the opposite direction. They reasoned that when speech rate is fast, articulatory processes take less time. Therefore the speech plan would have to be kept in the articulatory buffer for a shorter period, because the buffer time is a function of the difference between the duration of articulatory processing and the duration of phonological encoding (see Eq. 2). If buffer time is shorter, the error-tocutoff interval will be longer, because the internal monitoring loop would have a smaller temporal advantage over articulation. This dependence on buffer time comes about because the inner loop can start to work on a unit at the beginning of buffer time. The articulator, on the other hand, has to wait to the end of buffer time (but see Footnote 2).
144
HARTSUIKER AND KOLK
Unfortunately, there is an important problem with this account. It is tacitly assumed that an increase in speech rate has consequences for the speed of articulatory processes only. However, it is quite conceivable that an increase in speech rate has consequences for the durations of other production processes as well. Notice that an influential model of language production (Dell, 1986) explicitly simulated some of the effects of speech rate by decreasing the duration of phonological encoding. In Simulation 3, we also shortened the duration of phonological encoding in the simulation of rate effects on cutoff-to-repair intervals. If the assumption is correct that phonological encoding is faster in fast speech, speech rate would have only a small effect on buffer duration. We can show this by considering two possible effects of fast speech on the duration of production processes. First, speaking faster might imply that all production processes are decreased with an additive factor a (a ⬎ 0). If that is so, buffer time will remain constant. Second, speaking faster might imply that phonological encoding and articulation durations are proportionally shortened with a multiplicative factor m (m ⬍ 1). If that is true, buffer time will decrease with a multiplicative factor (1 ⫺ m). This decrease in buffer time, however, is much smaller than the decrease in buffer time if only articulation were to be sped up (i.e., then the decrease in buffer time will be (1 ⫺ m) times the duration of articulation).5 Thus, when the decrease is additive there is no effect on buffer time and when it is multiplicative there is a only a relatively small decrease in buffer time. In addition to an increase in the speed with which speech is produced, there could be an increase in the speed of comprehension. This is plausible, given the observation that if our interlocutors speak faster, we are forced to parse their speech faster as well. The same may hold for our self-produced speech. Faster comprehension processes yield shorter error-to-cutoff intervals, which could compensate an eventual delay resulting from shorter buffering. Finally, we assume that the speed of interruption is not affected by the instruction to speak faster. This is consistent with the assumption, embodied in the modified main interruption rule, that interruption is an act of motor control. Therefore it is not affected by the speed of linguistic processes. In the present simulation, we compare the effects of four possible manipulations of parameters on the mean duration of error-to-cutoff intervals. Each manipulation corresponds to one of the hypothesized ways in which faster 5 We will show this for the second word in a phrase. The buffer time is Tcom ⫹ Tsel ⫺ Tphon . We will refer to the sum Tcom ⫹ Tsel as Tart . If there is a proportional decrease in both articulation and phonological encoding, the difference in buffer time between normal and fast speech is (Tart ⫺ Tphon ) ⫺ (m ⋅ Tart ⫺ m ⋅ Tphon ). This reduces to (1 ⫺ m)(Tart ⫺ Tphon ). If there is a decrease in articulation only, the difference in buffer time is (Tart ⫺ Tphon ) ⫺ (m ⋅ Tart ⫺ Tphon ). This reduces to (1 ⫺ m) ⋅ Tart .
145
MONITORING MODEL
TABLE 8 Means and Standard Deviations (Final Column) for Error-to-Cutoff Intervals in Different Speech Rate Conditions in Simulation 4 Speech
Tphon
Tsel
Tcom
Taud
Tparse
Tcompare
Normal Fast Fast, Add., Tphon Fast, Mult., Tphon Fast, Mult., Tphon , Tperc
110 110 73 88 88
185 148 148 148 148
185 148 148 148 148
50 50 50 50 40
100 100 100 100 80
50 50 50 50 40
M (SD) 370 378 375 386 317
(192) (192) (196) (191) (169)
Note. Fast speech always implies that Tsel and Tcom are shorter than in normal speech. ‘‘Add.’’ means one or more stages are additively decreased with a factor a ⫽ 37. ‘‘Mult.’’ means one or more stages are multiplicatively decreased with a factor m ⫽ 0.8. ‘‘Tperc’’ means that in addition to phonological encoding, the perception processes are shortened. The noise level is 0.8.
speech affects the duration of processing: (1) articulation is decreased; (2) all production processes are decreased (additively); (3) all production processes are decreased (proportionally); (4) all production and perception processes are decreased (proportionally). Method. First, we set the articulatory parameters so that the durations per syllable were equal to the mean duration in normal speech as obtained by Oomen and Postma (Tart ⫽ 185). We then ran a number of pilot simulations, in which we varied the noise level. We found, that with a noise level of 0.8, Tsel and Tcom of 185, Tint of 200 ms, and the basic values for all the other parameters, a mean error-to-cutoff interval was produced that closely corresponded to the empirical mean (data, 371 ms; model, 370 ms). We then ran four simulations of ‘‘fast speech,’’ each of which corresponded to different assumptions about speech rate. First, we only shortened Tsel and Tcom to 148 ms (corresponding to the correct duration per syllable in empirical fast speech). Second, we decreased each production process with a constant duration of 37 ms. Third, we decreased each process, multiplicatively, with a factor of 0.8. Fourth, we decreased the production and the perception parameters, multiplicatively, with a factor of 0.8. Each simulation was based on 990 phrases.
Results and discussion. The mean and SD of each predicted distribution are listed in Table 8, for each simulation of normal and fast speech. The first four rows of the table show that the error-to-cutoff intervals are insensitive to manipulations of the production parameters, whether these manipulations affect articulation only or all production stages. The last row, however, shows that if both perception parameters and the production parameters are decreased with the same factor, error-to-cutoff intervals become much shorter. Why does a decrease in production times only have no effect on durations of error-to-cutoff intervals? We will illustrate this by considering predicted error-to-cutoff intervals when there is no noise, using (1) the parameters corresponding to normal speech and (2) the parameters corresponding to fast speech with articulation and phonological encoding decreased with factor 0.8. The error-to-cutoff intervals are, respectively, 195 ms, ⫺140 ms, and ⫺475 ms, for the first, second, and third words produced with normal speech
146
HARTSUIKER AND KOLK
rate and 232 ms, ⫺36 ms, and ⫺304 ms for phrases produced with fast speech rate (we will discuss the effect of position in the next section). The negative error-to-cutoff intervals denote that speech can be interrupted earlier than the theoretical onset of speech for that word. With respect to our simulations, we have assumed that in such situations a covert repair will occur: Negative error-to-cutoff intervals did not contribute to the predicted distributions. In the simulations with noise, we expect the mean error-to-cutoff intervals generated by the inner loop to be located around these values for each position (although there will be substantial variation in these times). This implies that most of the errors committed on the second and third word of the phrase are covertly repaired and that errors in the initial position largely determine the predicted error-to-cutoff interval. But if that is the case, buffer time is unimportant, since words in the first position are not buffered (there is no previous word that has to be completed). Thus, the error-to-cutoff interval depends only on the relative timing of production processes and the interception process and not on the amount of buffering. A Novel Prediction from the Model: Effects of Error Location on Errorto-Cutoff Time We argued in the discussion section of Simulation 4 that buffer time has no effect on the duration of error-to-cutoff times. This does not mean that the buffer is irrelevant with respect to these durations, but that these durations are importantly determined by units that were not buffered. In fact, the model predicts that the duration of the error-to-cutoff interval depends on the position of the error in the phrase: Errors in the beginning of the phrase lead to longer error-to-cutoff intervals than errors in the end. Why does the model predict this position effect? The error-to-cutoff time depends on the time interval for the articulation of the word relative to the time interval for monitoring and interrupting. The difference between these times depends on the duration of buffering: The longer the word is buffered, the larger is the temporal advantage of the monitor relative to the articulator. Thus, with longer buffering times error-to-cutoff intervals are shorter. If there is sufficient buffering, the error-to-cutoff interval will become negative and then the repair becomes covert. The position effect comes about because the duration of buffering depends on the position of the word in the phrase. Suppose the first word is erroneous. In that case, once the phonetic plan is delivered, the articulator starts to work on it right away, because there is no previous word being articulated. If the error is in the second word, the articulator will be occupied with the first word when the phonetic plan for the second word is created. Thus, the second word will have to be buffered for a period which equals the difference between the durations of articulation and phonological planning. If the error is in the third word, the phonetic plan has to be buffered even longer, because
MONITORING MODEL
147
FIG. 6. Illustration of the position effect. The buffer time, and thus the error-to-cutoff time, linearly increases with position in the phrase for internally generated repairs.
there is even more delay in the onset of articulation. Not only does articulation of the previous word take longer than phonological encoding of the current one, causing a delay, it also starts later, causing a further delay. We have illustrated this effect in Fig. 6 and expressed it algebraically below. As can be seen in Eq. 2, the (hypothetical) beginning of articulation of an erroneous word depends on a correction factor for buffer time. This correction factor is provided in Eq. 8: C buf ⫽ Max(0, End com, i⫺1 ⫺ End phon, i ).
(8)
If we assume that the duration of phonological encoding, selection, and command are equal for each unit and there is no noise, we can rewrite Eq. 8 as Eq. 9, below, in which n indicates the position of the word in the phrase (for the first word, n ⫽ 1): C buf ⫽ Max(0, (n ⫺ 1) ⋅ (Tsel ⫹ Tcom ⫺ Tphon )).
(9)
Equation 9 shows that buffer time increases linearly with n. Even if the assumption of equal duration for each unit does not hold, it is still the case that there is an increment in buffer time for unit n, for the time that unit n ⫺ 1 was buffered. Suppose we performed a production experiment that would systematically compare interruptions and repairs for errors with different positions in the phrase. Then the following predictions can be made. First, the proportion of covert repairs relative to overt repairs should increase with position. Second, in an experiment that would remove the contribution of the outer loop (e.g., by presenting white noise through headphones, cf. Lackner & Tuller, 1979) error-to-cutoff times should be shorter for farther positions in the phrase.
148
HARTSUIKER AND KOLK
GENERAL DISCUSSION
We have presented a computational model of monitoring and error repair that predicts the time course of overt error repairs. The model consists of a number of stages that process phrases incrementally. The model’s general architecture is based on the sentence production theory of Levelt (1989) and the theory of articulation proposed by Sternberg et al. (1988). We have formalized and elaborated these models. An essential difference from earlier proposals is the modified main interruption rule that we implemented and tested. This rule differs from earlier proposals in two important respects. First, the processes of interruption and repair are considered two simultaneously starting parallel processes, beginning immediately upon error detection. In earlier proposals (e.g., Levelt, 1983, 1989) it is suggested that these processes are serial and that repair has to wait until interruption is complete. That proposal is inconsistent with the data. Our proposal, on the other hand, does simulate the empirical distribution of cutoff-to-repair intervals. Second, in our model, interruption is considered as directly influencing the level of articulation, but repair entails a restart at intervening levels of production. The implication is that we expect repair, as opposed to interruption, to be sensitive to manipulations of speech rate, which would effect the duration of linguistic encoding processes. We have presented four simulation studies with the model. The first simulation showed that it is impossible to simulate empirical distributions of error-to-cutoff intervals using only an outer monitoring loop, unless unrealistic assumptions are made. This finding once again supports the notion of an inner monitoring mechanism. Importantly, it also shows that the model is constrained: It is not possible to simulate any arbitrary distribution of repair times with it. The second simulation showed that if the predicted distribution is based on both inner monitoring and outer monitoring, a good fit is obtained with the empirical distribution, across a range of parameter settings. This second simulation thus provides evidence for the perceptual loop theory: It is indeed the case that the perceptual loop is fast enough to generate error-to-cutoff intervals of a duration as short as found in the empirical data (even when we limit the contribution of the inner loop to only 33% of the error-to-cutoff intervals). Simulation 3 showed that the model simulates the distribution of cutoffto-repair intervals. This simulation further showed that the shortening of cutoff-to-repair intervals follows quite naturally from the model, because the cutoff-to-repair interval depends on the difference between the reformulation time and the interruption time. Given our assumption that interruption time is constant, the intervals will be shorter when production takes less time. Simulation 4 showed that the effect of speech rate on error-to-cutoff intervals also follows from the model (shorter intervals with faster speech). A
MONITORING MODEL
149
precondition is, however, that faster speech implies that all temporal parameters are sped up, including the parameters on the comprehension side (Tparse and Tcompare ). In the final section, we showed that the model generates new, testable predictions, with respect to the effect of position in the phrase. The model predicts that the farther in the phrase an error is, the shorter or more negative the error-to-cutoff interval will be. Thus, errors that are farther away will more often be repaired covertly. Furthermore, in an experiment that would remove the contribution of the outer loop, errors farther in the phrase will have shorter error-to-cutoff times. Implementation and testing of the model raised a number of theoretically important issues. Which processing stages are affected to which extent when we speak faster? In particular, does the speech perception system ‘‘run’’ faster when we speak faster? And do we interrupt our speech faster when we speak faster? In the remainder of this section, we will first discuss these issues concerning speech rate. Then we will put forward the possibility that speech monitoring requires the postulation of an additional buffer: a parse buffer. Then we will discuss a number of issues with respect to the relation between self-monitoring and other-monitoring. We will conclude by listing some of the limitations of the model. Effects of Speech Rate An important issue raised in these simulations is how the effects of speech rate should be modeled. In fact, this is a more general issue: In what way is a system that produces behavior in a sequence of serial stages affected by the requirement to produce output at higher speed? With respect to speech production and monitoring, the more specific issue is whether fast speech is simply the result of fast articulation or whether prearticulatory planning processes are faster too. The assumption that fast speech implies fast phonological encoding is not without precedent. Dell (1986) successfully simulated the effect of speech rate on the distribution of speech errors with his phonological encoding model. In order to obtain ‘‘fast speech’’ in that model, it was necessary to decrease the time-to-selection for the phonemes that make up the to-be-uttered word. A further issue is whether the speed with which the speech perception system parses speech is determined by an inherent rate at which this system handles incoming input, or whether this system is sensitive to the rate at which input is presented. If this latter scenario is true, this means that faster (internal) speech, is also comprehended faster. How likely is that scenario? It is known from the literature on compressed speech that speech can be perceived at far higher rates than it is produced (De Haan, 1982; Dupoux & Green, 1997; Foulke & Sticht, 1969; Heiman, Leo, Leighbody, & Bowler, 1986). For instance, Foulke and Sticht (1969) reported that speech can be perceived at increased rates, up to 275 words per minute (218 ms/word), before a rapid decline in intelligibility occurs. Heiman et al. (1986) argue
150
HARTSUIKER AND KOLK
that speech can even be perceived at rates of 350 words per minute (171 ms/word), as long as the amount of compression does not exceed 50%. Dupoux and Green (1997) compressed sentences to 45 and 38% of the original duration. When sentences were compressed to 45% of their original duration, between 60 and 75% of words were intelligible, depending on talker and practice. Since these sentences were originally spoken at rates between 147 ms/syllable and 214 ms/syllable, the 45% compressed sentences sounded at a rate of between 66 and 96 ms/syllable. Words cannot be produced at these rates: Fast speech is produced at rates of about 200 ms per syllable, with occasional stretches of 125 ms per syllable (Levelt, 1989). In sum, given the speed with which the parser can handle speech produced by others, it is quite likely that it keeps up with faster speech when produced internally. A final issue is what the effects of faster speech are on the processes of repairing and interrupting. We have proposed that these processes are differentially sensitive to speed manipulations: Interrupting directly affects the articulator, but repairing is a process that is performed by the formulator. Planning an interruption is a process which may be necessary for a variety of reasons, many of which have nothing to do with detection of errors in speech planning. Indeed, it is usually assumed that the stop-signal RT, which is directly related to the time to plan stopping something, is constant across many experimental manipulations (De Jong et al., 1990), but there appear to be no studies that manipulated speech rate.6 Repairing requires formulation, however, as is evidenced by the existence of retracings in the repairs, which conform to specific syntactic constraints (Levelt, 1983). In sum, in order for our model to handle the effect of speed, both on errorto-cutoff intervals and on cutoff-to-repair intervals, three assumptions need to be made. First, fast speech results from fast speech planning. Second, fast speech results in fast speech comprehension. Third, time to interrupt speech is constant. The foregoing shows that these assumptions are plausible; nevertheless, they constitute important research questions themselves, which need to be addressed empirically. Parse Buffer In the present model, there is an articulatory buffer that deals with asynchronies between formulation and articulation. Not explicit in the blueprint of the model (Fig. 2), but implicit in the equations that specify the error-tocutoff times, is a parse buffer. This device would deal with asynchronies between formulation and parsing. Despite the assumption that fast speech leads to fast comprehension, it is theoretically possible that phonological encoding for one word is completed before the previous word is parsed through the inner loop. Then, the corresponding phonetic plan will have to 6 In the interruption of limb movements, faster movements will tend to take longer to stop, because of physical constraints.
MONITORING MODEL
151
be temporarily stored in a buffer. We have not explored the behavior of a parse buffer in the present article, because there was hardly any need for it. This is because we have consistently set the basic durations of phonological encoding to be much larger than the duration of parsing (respectively 220 and 100 ms for a disyllabic word). An open question is whether the parse buffer should be equated with the articulatory buffer, or whether it is a separate system. An advantage of a separate system would be that it could also be used to handle a temporal overlap between parsing of internal speech and parsing of overt speech. The easiest solution to dealing with such overlaps may be temporal storage in a parse buffer. Furthermore, in a separate system the set of control operations, determining the content of the buffer, may be easier.7 We will remain agnostic with respect to whether there is a specialized parse buffer or whether the articulatory buffer deals with situations in which the parser is occupied. We can, however, derive a prediction from the postulation of a buffering system (either the articulatory buffer or a special parse buffer) to deal with slow parsing. It can be shown, analogous to buffer time preceding articulation (Eq. 9), that a given unit will have to be stored in a buffer for a time depending on the position in the phrase (Eq. 10). C buf ⫽ Max(0, (n ⫺ 1) ⋅ (Tparse, i⫺1 ⫺ Tphon, i )).
(10)
This buffer time delays the moment of interruption with an additive amount for each word. The prediction then is that the position effect mentioned before is attenuated when parsing is slow. Thus, listeners that comprehend quickly have a stronger position effect on error-to-cutoff intervals than slower comprehenders. This prediction may be tested either by comparing patients with comprehension disorders with control participants with unimpaired comprehension or by comparing normal participants with high and low comprehension spans (e.g., Daneman & Carpenter, 1980), assuming that high verbal memory span correlates with fast parsing. Self-Monitoring and Other-Monitoring A major contribution of the present paper is that it shows that an internal monitor that utilizes the perceptual system is fast enough to generate distributions of error-to-cutoff intervals that are comparable to the empirical data. Thus, the simulation results are compatible with an important assumption of PLT: the speech perception system is involved in monitoring both inner and outer speech. However, a number of questions can be raised with respect to 7 The reason is that if a single buffering system deals with both delays in phonological encoding and with delays in parsing, there needs to be a double checkoff. First, each unit has to be checked off for being handled by the parser. Second, it has to be checked off for being handled by the articulator.
152
HARTSUIKER AND KOLK
this assumption.8 First, is it realistic to assume that the same system is involved in self-monitoring and monitoring of others’ speech? This is an important issue, because MacKay (1987) claimed that there are clear differences between detecting self-produced vs. other-produced errors. However, Levelt (1989) takes issue with MacKay’s claim. The most important reason is the fact that the attentional requirements for self-monitoring and othermonitoring are different. When listening to others’ speech, the job of the listener is to extract meaning out of the signal. When self-monitoring, the job of the speaker is to inspect the utterance for deviations at any level of production. To press this point further, Levelt cites several studies that show that the pattern of error detection in others’ speech varies with the instructions given to the listener (i.e., with their focus of attention). A second issue is whether the inner loop could be involved in comprehending speech of others, and whether listening to others would interfere with the inner loop. This would be particularly relevant when we are listening to others and simultaneously monitoring our own speech: How would the monitor be able to separate the two information streams? Most likely, the listener uses peripheral cues that could help distinguish the source. Overt speech of self and others will lead to lower level perceptual experiences, but inner speech will not (see also Wheeldon & Levelt, 1995). If such peripheral information enters into the representation on which the speech comprehension system works—and this is likely, given the fact that listeners easily succeed in an analogous task: distinguishing between two different speakers—this information would provide cues for separating the information streams. A third issue is the following: If the monitor is localized in the conceptualizer, which is involved in, among other things, conceptualizing self-produced speech, how could it be used for monitoring others’ speech? Following Levelt (1989), we consider conceptualizing a ‘‘central’’ process (cf. Fodor, 1983). The conceptualizer has many different tasks and is not committed to specific information types of any specific modality. Therefore, it has access to a number of different representations, including the discourse model, world knowledge, one’s own beliefs and intentions, and the parsed speech of self and others. Some Limitations of the Model The present, formal model is a much more explicit variant of the perceptual loop hypothesis and quantitative predictions can be derived from it. Nevertheless, we are the first to admit that there are limitations in the domain of incidents that the model seeks to explain and the model only approximates many of the intricate details of speech production, comprehension, and monitoring. In what follows, we will briefly report a number of limitations of the model. 8
These issue were brought up by an anonymous reviewer.
MONITORING MODEL
153
First, the domain of the model is restricted to a subset of all ‘‘monitoring’’ incidents. We have ignored appropriateness repairs, which would possibly have necessitated the postulation of an additional monitoring loop. We have, furthermore, not distinguished between different types of errors (phonological, syntactic, or lexical). It is conceivable that there are differences in the durations of detection or repair for different types of errors, e.g., it may be easier to detect or repair some types of errors than others. With respect to the repair process, we have limited the model to restarts. However, often speakers repeat a number of words occurring before the error, which complicates the issue of the repair process. This is particularly complicating because of systematicities in the amount of material retraced (Levelt, 1983). Second, the model is limited with respect to a number of aspects of speech production. As mentioned earlier, not all details of the Sternberg et al. (1988) model were followed. In particular, we have not implemented additive effects of the number of stress groups on the duration of the selection stage. These effects are small (in the magnitude of 12 ms per phonological word). Furthermore, in the prepared speech paradigm, all stress groups are buffered before the onset of the selection stage. In more natural speech situations, which we attempt to model, the buffer content varies online. Another aspect of speech production that we ignore are phonological determinants of utterance duration, such as stress and CV pattern (Crystal & House, 1988a,b,c,d; 1990). We also made the tacit assumption that errors in the internal speech plan are distributed uniformly across the phrase, which also need not be true. Third, we have used a fixed decomposition of inner loop and outer loop monitoring for a given set of overt repairs. However, it is conceivable that in fast speech a larger proportion of the overt repairs are made through the inner loop. In most of our simulations, the relative contributions were fixed to 67% outer loop and 33% inner loop, based on our partitioning algorithm. If there were a shift in the composition of the overt repair distribution, so that more overt repairs are generated by the inner loop, this would tend to decrease the mean error-to-cutoff time. Conclusion We have formalized and elaborated the perceptual loop theory of monitoring. Notwithstanding the limitations in scope and the simplifications about the relevant stages of processing, this model contributes to monitoring theory. We have shown, by simulation, that the perceptual loop theory is consistent with empirical distributions of the time interval between error and cutoff. We have further shown that a modified variant of the main interruption rule, as opposed to the original proposal of that rule, is consistent with empirical distributions of cutoff-to-repair intervals. Furthermore, we have shown that it is possible to simulate effects of speech rate on the mean durations of these intervals, but only given a set of constraints on the effects of speech rate on the processing times of speech production, speech comprehension,
154
HARTSUIKER AND KOLK
and speech interruption. This set of constraints is in itself an important harvest of this endeavor. APPENDIX: PROOF OF THE DECOMPOSITION RULE Assume that (1) each error that is detected will be repaired and each such repair has observable consequences (as either an overt or a covert repair); (2) each incident classified as a covert repair (part-word repetition, prolongation, and filled pause) is an effect of covert repairing; (3) the accuracy of the monitor does not depend on which loop detected the error. Let the proportion of covert repairs (out of all repairs) be β and let the proportion of repaired errors (out of all overt errors) be δ. Let p be the accuracy of the monitor, and let x be the fraction of errors detected by the inner loop that result in covert repairs (thus 1 ⫺ x is the fraction of errors detected by the inner loop that result in overt repairs). Then, the total number of (internal) errors can be decomposed into four fractions: (I) px (covert repairs); (II) p(1 ⫺ x) (overt repairs; error detected by the inner loop); (III) (1 ⫺ p)p (overt repairs; error detected by the outer loop); (IV) (1 ⫺ p) 2 (unrepaired errors). We can estimate the parameters p and x by relating the empirically observed quantities β and δ to these four fractions. In fact, β, the proportion of covert repairs, is the fraction of (I) over (I ⫹ II ⫹ III), yielding Eq. A1. px p ⫹ p(1 ⫺ p)
⇒
px ⫽ β( p ⫹ p(1 ⫺ p))
⇒
β⫽
x ⫽ β(2 ⫺ p).
(A1)
The quantity δ, the proportion of repaired errors, can be expressed as (II) ⫹ (III) over (II ⫹ III ⫹ IV). The latter term can be rewritten as (1–I) for computational ease. Substitution yields Eq. A2. δ⫽
p(1 ⫺ x) ⫹ p(1 ⫺ p) . 1 ⫺ px
(A2)
Finally, substituting (A1) into (A2) and rewriting finally yields (A3), as is shown below. ⇒δ⫽
p(1 ⫺ β(2 ⫺ p)) ⫹ p(1 ⫺ p) 1 ⫺ pβ(2 ⫺ p)
⇒δ⫽
p ⫺ βp(2 ⫺ p) ⫹ p ⫺ p 2 1 ⫺ 2βp ⫹ βp 2
⇒δ⫽
⫺p 2 ⫹ 2p ⫺ 2βp ⫹ βp 2 1 ⫺ 2βp ⫹ βp 2
⇒ δ ⫺ 2βδp ⫹ βδp 2 ⫽ ⫺p 2 ⫹ 2p ⫺ 2βp ⫹ βp 2 ⇒ p 2 (1 ⫺ β ⫹ βδ) ⫺ 2p(1 ⫺ β ⫹ βδ) ⫹ δ ⫽ 0 p⫽
2(β(δ ⫺ 1) ⫹ 1) ⫾ √(⫺2(β(δ ⫺ 1) ⫹ 1)) 2 ⫺ 4δ(β(δ ⫺ 1) ⫹ 1) . 2(β(δ ⫺ 1) ⫹ 1)
(A3)
MONITORING MODEL
155
REFERENCES Allopena, P. D., Magnuson, J. S., & Tanenhaus, M. K. (1998). Tracking the time course of spoken word recognition using eye movements: Evidence for continuous mapping models. Journal of Memory and Language, 38, 419–439. Anderson, R. E. (1982). Speech imagery is not always faster than visual imagery. Memory & Cognition, 10, 371–380. Berg, T. (1986). The aftermath of error occurrence: Psycholinguistic evidence from cutoffs. Language and Communication, 6, 195–213. Bernstein, P. S., Scheffers, M. K., & Coles, M. G. H. (1995). ‘‘Where did I go wrong?’’ A psychophysiological analysis of error detection. Journal of Experimental Psychology: Human Perception and Performance, 21, 1312–1322. Blackmer, E. R., & Mitton, E. R. (1991). Theories of monitoring and the timing of repairs in spontaneous speech. Cognition, 39, 173–194. Booij, G. (1995). The phonology of Dutch. Oxford: Clarendon Press. Bre´dart, S. (1991). Word interruption in self-repairing. Journal of Psycholinguistic Research, 20, 123–138. Clark, H. H., & Wasow, T. (1998). Repeating words in spontaneous speech. Cognitive Psychology, 37, 201–242. Crystal, T. H., & House, A. S. (1988a). Segmental durations in connected-speech signals: Syllabic stress. Journal of the Acoustical Society of America, 83, 1574–1585. Crystal, T. H., & House, A. S. (1988b). Segmental durations in connected-speech signals: Current results. Journal of the Acoustical Society of America, 83, 1553–1573. Crystal, T. H., & House, A. S. (1988c). The duration of American-English vowels: An overview. Journal of Phonetics, 16, 263–284. Crystal, T. H., & House, A. S. (1988d). The duration of American-English stop consonants: An overview. Journal of Phonetics, 16, 285–294. Crystal, T. H., & House, A. S. (1990). Articulation rate and the duration of syllables and stress groups in connected speech. Journal of the Acoustical Society of America, 88, 101–112. Daneman, M., & Carpenter, P. A. (1980). Individual differences in working memory and reading. Journal of Verbal Learning and Verbal Behavior, 19, 450–466. De Haan, H. J. (1982). The relationship of estimated comprehensibility to the rate of connected speech. Perception & Psychophysics, 32, 27–31. De Jong, R., Coles, M. G. H., Logan, G. D., & Gratton, G. (1990). In search of the point of no return: The control of response processes. Journal of Experimental Psychology: Human Perception and Performance, 16, 164–182. Dell, G. S. (1986). A spreading-activation theory of retrieval in sentence production. Psychological Review, 93, 283–321. Dell, G. S., & Repka, R. J. (1992). Errors in inner speech. In B. J. Baars (Ed.), Experimental slips and human error: Exploring the architecture of volition. New York: Plenum. Den Ouden, D.-B. (1997). De fonologische frase in een model voor spraakproductie [The phonological phrase in a model of speech production]. Tabu, 27, 28–47. Dupoux, E., & Green, K. (1997). Perceptual adjustment to highly compressed speech: Effects of talker and rate changes. Journal of Experimental Psychology: Human Perception and Performance, 23, 914–927. Fodor, J. A. (1983). The modularity of mind. Cambridge, MA: MIT Press. Forster, K. I., & Davis, C. (1984). Repetition priming and frequency attenuation in lexical
156
HARTSUIKER AND KOLK
access. Journal of Experimental Psychology: Learning, Memory, and Cognition, 10, 680– 698. Foulke, E., & Sticht, T. G. (1969). Review of research on the intelligibility and comprehension of accelerated speech. Psychological Bulletin, 72, 50–62. Garrett, M. F. (1982). Production of speech: Observations from normal and pathological language use. In A. Ellis (Ed.), Normality and pathology in cognitive function (pp. 19–76). London: Academic Press. Heiman, G. W., Leo, R. J., Leighbody, G., & Bowler, K. (1986). Word intelligibility decrements and the comprehension of time-compressed speech. Perception & Psychophysics, 40, 407–411. Klapp, S. T., & Erwin, C. I. (1976). Relation between programming time and duration of the response being programmed. Journal of Experimental Psychology: Human Perception and Performance, 2, 591–598. Kolk, H. H. J., & Postma, A. (1997). Stuttering as a covert-repair phenomenon. In R. Corlee & G. Siegel (Eds.), Nature and treatment of stuttering: New directions (pp. 182–203). Boston: Allyn & Bacon. Lackner, J. R., & Tuller, B. H. (1979). Role of efference monitoring in the detection of selfproduced speech errors. In W. E. Cooper & E. C. T. Walker (Eds.), Sentence processing (pp. 281–294). Hillsdale, N.J.: Erlbaum. Ladefoged, P., Silverstein, R., & Papcun, G. (1973). Interruptibility of speech. Journal of the Acoustical Society of America, 54, 1105–1108. Laver, J. (1980). Monitoring systems in the neurolinguistic control of speech production. In V. A. Fromkin (Ed.), Errors in linguistic performance: Slips of the tongue, ear, pen, and hand. New York: Academic Press. Levelt, W. J. M. (1983). Monitoring and self-repair in speech. Cognition, 14, 41–104. Levelt, W. J. M. (1989). Speaking: From intention to articulation. Cambridge, MA: MIT Press. Levelt, W. J. M., Roelofs, A., & Meyer, A. S. (1999). A theory of lexical access in speech production. Behavioral and Brain Sciences, 22, 1–75. Liss, J. M. (1998). Error-revision in the spontaneous speech of apraxic speakers. Brain and Language, 62, 342–360. Logan, G. D., & Cowan, W. B. (1984). On the ability to inhibit thought and action: A theory of an act of control. Psychological Review, 91, 295–327. MacKay, D. G. (1987). The organization of perception and action: A theory of language and other cognitive skills. New York: Springer–Verlag. MacKay, D. G. (1992a). Awareness and error detection: New theories and research paradigms. Consciousness and Cognition, 1, 199–225. MacKay, D. G. (1992b). Problems with Popper: The initial goals is to develop viable theories, not disconfirm them. Consciousness and Cognition, 1, 231–240. Marshall, J., Robson, J., Pring, T., & Chiat, S. (1998). Why does monitoring fail in jargon aphasia? Comprehension, judgment, and therapy evidence. Brain and Language, 63, 79– 107. Marshall, R. C., Rappaport, B. Z., & Garcia-Bunuel, L. (1985). Self-monitoring behavior in a case of severe auditory agnosia with aphasia. Brain and Language, 24, 297–313. Marslen-Wilson, W., & Tyler, L. (1980). The temporal structure of spoken language understanding. Cognition, 8, 1–71. McNamara, P., Obler, L. K., Au, R., Durso, R., & Albert, M. L. (1992). Speech monitoring
MONITORING MODEL
157
skills in Alzheimer’s disease, Parkinson’s disease, and normal aging. Brain and Language, 42, 38–51. Meyer, A. S. (1994). Timing in sentence production. Journal of Memory and Language, 33, 471–492. Motley, M. T., Camden, C. T., & Baars, B. J. (1982). Covert formulation and editing of anomalies in speech production: Evidence from experimentally elicited slips of the tongue. Journal of Verbal Learning and Verbal Behavior, 21, 578–594. Nespor, M., & Vogel, I. (1986). Prosodic phonology. Dordrecht: Foris. Nooteboom, S. G. (1980). Speaking and unspeaking: Detection and correction of phonological and lexical errors in spontaneous speech. In V. A. Fromkin (Ed.), Errors in linguistic performance: Slips of the tongue, ear, pen, and hand. New York: Academic Press. Oomen, C., & Postma, A. (in press). Effects of time pressure on mechanisms of speedy production and self-monitoring. Journal of Psycholinguistic Research. Postma, A., & Kolk, H. H. J. (1992). The effects of noise masking and required accuracy on speech errors, disfluencies, and self-repairs. Journal of Speech and Hearing Research, 35, 537–544. Postma, A., & Kolk, H. H. J. (1993). The covert repair hypothesis: Prearticulatory repair processes in normal and stuttered disfluencies. Journal of Speech and Hearing Research, 36, 472–487. Postma, A., & Noordanus, C. (1996). Production and detection of speech errors in silent, mouthed, noise-masked, and normal auditory feedback speech. Language and Speech, 39, 375–392. Schlenk, K.-J., Huber, W., & Willmes, K. (1987). ‘‘Prepairs’’ and repairs: Different monitoring functions in aphasic language production. Brain and Language, 30, 226–244. Siegel, S., & Castellan, N. J. (1988). Nonparametric statistics for the behavioral sciences (2nd ed.). New York: McGraw–Hill. Sokolov, A. N. (1972). Inner speech and thought. New York: Plenum. Sternberg, S., Monsell, S., Knoll, R. L., & Wright, C. E. (1978). The latency and duration of rapid movement sequences: Comparison of speech and typewriting. In G. E. Stelmach (Ed.), Information processing in motor control and motor learning. New York: Academic Press. Sternberg, S., Wright, C. E., Knoll, R. L., & Monsell, S. (1980). Motor programs in speech: Additional evidence. In R. A. Cole (Ed.), Perception and production of fluent speech. Hillsdale, NJ: Erlbaum. Sternberg, S., Knoll, R. L., Monsell, S., & Wright, C. E. (1988). Motor programs and hierarchical organization in the control of rapid speech. Phonetica, 45, 175–197. Van Hest, E. (1996). Self-repair in L1 and L2 production. Tilburg: Tilburg Univ. Press. Van Wijk, C., & Kempen, G. (1987). A dual system for producing self-repairs in spontaneous speech: Evidence from experimentally elicited corrections. Cognitive Psychology, 19, 403–440. Weber, R. J., & Castleman, J. (1970). The time it takes to imagine. Perception & Psychophysics, 8, 165–168. Wheeldon, L. R., & Lahiri, A. (1997). Prosodic units in speech production. Journal of Memory and Language, 37, 356–381. Wheeldon, L. R., & Levelt, W. J. M. (1995). Monitoring the time course of phonological encoding. Journal of Memory and Language, 34, 311–334. (Accepted August 1, 2000, published online January 3, 2001)