allow for online project control. A packaging module collects feedback .... to an effort accounting system or bug tracking data base. A data access object contains ...
Cost-Efficient Customisation of Software Cockpits by Reusing Configurable Control Components Jens Heidrich, Jürgen Münch
Abstract Detecting and reacting to critical project states in order to achieve planned goals is one key issue in performing a software development project successfully and staying competitive as a software development company. Software Cockpits, also known as Software Project Control Centres, support the management and controlling of software and system development projects and provide a single point of project control. One key element of such cockpits is the analysis, interpretation, and visualisation of measurement data in order to support various stakeholders for different purposes. Currently, many companies develop their own cockpits (typically simple dashboards) that are mainly based on Spreadsheet applications. Alternatively, they use dashboard solutions that provide a fixed set of predefined functions for project control that cannot be sufficiently customised to their own development environment. Most of the more generic approaches for control centres offer only partial solutions and lack purpose-oriented and role-oriented data interpretation and visualisation based on a flexible set of control techniques that can be customised according to planned goals in a cost-efficient way. A systematic approach for defining reusable, customisable control components and instantiate them according to different organisational goals and characteristics is basically missing. This article gives an overview of the Specula project control framework and illustrates how to employ it for implementing project control mechanisms. The focus is on how to describe and combine control components in a generic way and how to select the right components based on explicitly defined project goals. Furthermore, related approaches are discussed and the use of Specula as part of industrial case studies is described.
1. Introduction One means for obtaining intellectual control over development processes and determining the performance of processes and the quality of products is to institutionalise measurement on the basis of explicit models. Companies have started to introduce so-called software cockpits, also know as Software Project Control Centres (SPCC) [16] or Project Management Offices (PMO) [17], for systematic quality assurance and management support. A software cockpit is comparable to an aircraft cockpit, which centrally integrates all relevant information for monitoring and controlling purposes. For example, a project manager can use it to get an overview of the project state and a quality assurance manager can use it to check the quality of the software product. There exist a variety of such software cockpits in practice, gathering different measurement data and implementing different techniques for data interpretation and visualisation ranging from simple dashboards to approaches supporting advanced controlling techniques and allowing for organisation-wide data collection, interpretation, and visualisation. An important success factor in the software engineering domain is that these solutions are customised to the specific goals (such as controlling), the organisational characteristics and needs, as well as the concrete project environment (e.g., available data and process maturity). For instance, for multi-disciplinary, distributed software development, measurement data has to be collected from different sources (locations) and formats. In this case, integration of data is crucial for getting a consistent picture of the project state. Supporting such customisation by
pro-actively reusing configurable components promises cost-efficient set-up of software cockpits. Specula (lat. watch tower) is a generic framework for implementing software cockpits within an organisation using reusable control components [8], [9]. It was developed at the University of Kaiserslautern and the Fraunhofer Institute for Experimental Software Engineering (IESE) and basically consists of four parts: (1) a logical architecture for implementing software cockpits [16], (2) a conceptual model formally describing the interfaces between data collection, data interpretation, and data visualisation, (3) an implementation of the conceptual model, including a construction kit of control components, and (4) a method of how to select control components according to explicitly stated control goals and set up project control for a specific development organisation. The evaluation of the Specula framework is currently being conducted in several industrial case studies as part of the Soft-Pit research project funded by the German Federal Ministry of Education and Research [20]. The project focuses on getting experience and methodological support for operationally introducing control centres into companies and projects. Section 2 will present the Specula framework in more detail and illustrate its conceptual modules and the basic data flow between those modules. Section 3 will define reusable control components and show how to instantiate them in order to systematically collect, interpret, and visualise measurement data during project performance. Section 4 will illustrate the customisation process of the framework based on explicitly defined measurement goals and will present a sample scenario on how to apply this process in a real project environment. Section 5 will present related work in the field of software project control centres and project performance indicators. The article will conclude with a brief summary and discussion of future work and describe the continuous application of the Specula framework as part of industrial projects.
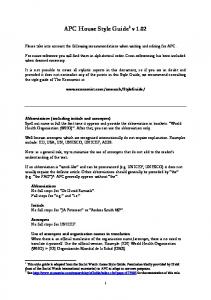
2. The Specula Framework Specula, also known as goal-oriented SPCC approach, is a state-of-the-art framework for project control. It implements a control centre as defined in [16]. One essential objective of Specula is to interpret and present collected measurement data in a goal-oriented way in order to optimise a measurement program and effectively detect plan deviations making use of freely configurable, reusable control components. Specula is largely based on the Quality Improvement Paradigm (QIP) and the GQM approach [2]. QIP is used to implement a project control feedback cycle and make use of experiences and knowledge gathered in order to reuse and customise control components. GQM is used to drive the selection process of finding the right control components according to explicitly defined measurement goals. Figure 1 illustrates the basic conceptual modules of the Specula framework. The customisation module is responsible for selecting and adapting the control components according to project goals and characteristics and defined measurement (control) goals. It is possible to include past experience (e.g., effort baselines, thresholds) in the selection and adaptation process. This experience is stored in a experience base. A Visualisation Catena (VC) is created, which formally describes how to collect, interpret, and visualise measurement data. The set of reusable control components from which the VC is instantiated basically consists of integrated project control techniques (for interpreting the data in the right way) and data visualisation mechanisms (for presenting the interpreted data in accordance with the role interested in the data). The central processing module collects measurement data during project performance and interprets and visualises them according to the VC specification. Measurement data can be retrieved (semi-)automatically from project repositories or manually from data collection forms and (semi-)formal documents. Finally, charts and tables are produced to
allow for online project control. A packaging module collects feedback from project stakeholders about the application of the control mechanisms and stores them in an Experience Base (e.g., whether a baseline worked, whether all plan deviations were detected, or whether retaliatory actions had a measurable effect). Using these modules, the Specula framework is able to specify a whole family of project control centres (which is comparable to a software product line for control centres). Project Members GQM GQM Plan Plan
M M
Project Planners
G G Q Q
Q Q
M M
M M
GQM GQM VI VI FI FI DE DE WFI WFI
Documents Q Q M M
Customisation Customisation
Goals Goals and and Characteristics Characteristics
M M
Project Project Repositories Repositories
Experience Experience Base Base
Data Data Collection, Collection, Interpretation, Interpretation, and and Visualisation Visualisation
VI VI
Visualisation Visualisation Catena Catena VI VI
Goal Goal Question Question Metric Metric View View Instance Instance Function Instance Function Instance Data Data Entry Entry Web Web Form Form Instance Instance Association Association Data Data Flow Flow
Packaging Packaging
Online Online Control Control
VI VI
VI VI
FI FI
Control Control Components Components
FI FI
FI FI
FI FI
DE DE
DE DE
DE DE
DE DE
WFI WFI
WFI WFI
DB DB
IDE IDE
Project Stakeholders
Figure 1: Overview of the Specula Framework. Large parts of the framework are supported by a corresponding tool implementation, which currently completely automates the central processing module as well as parts of the customisation module (defining control components and creating a VC). The process of deriving a VC from a GQM plan, project goals, and characteristics is currently not supported by the tool and must be performed manually. Section 4 will give an overview of the performed steps and provide some guidance on how to systematically perform this task. Packaging is currently only supported as far as maintenance of control components is concerned (e.g., creating new components, changing existing ones, and adapting parameter settings).
3. Specification of Control Components In order to control software development projects, especially projects using a distributed development process, goal-oriented interpretation and visualisation of collected measurement data is essential. In [8] the concept of a so-called Visualisation Catena (VC) for project control is described. A VC steers the process of measurement data collection, processing, and visualisation. The processing and interpretation of collected measurement data is usually related to a special measurement purpose, like analysing of effort deviations, or guiding a project manager. A set of techniques and methods (from the repository of control components) is used by the VC for covering the specified measurement purpose. We will refer to the applied techniques and methods as controlling functions moving forward. The visualisation and presentation of the processed and collected measurement data is related to roles of the project that profit from using the data. The VC creates a set of custom-made controlling views, which presents the data corresponding to the interests of the specified role, such as a high-level controlling view for a project manager, and a detailed view of found defects for a quality assurance manager. The whole visualisation catena (including controlling functions and views) has to be adapted in accordance with the context characteristics and organisational environment of the software development project currently controlled. The visualisation catena is the cen-
tral component of the Specula framework and is mainly responsible for the purpose-, role-, and context-oriented interpretation and visualisation of measurement data. Visualisation Catena
Web Form Instance
�manages data for
Data Entries
�processes contents of
Function Instance
�presents results of
View Instance
� is build upon � instance of Web Form
Association Association Inheritance Inheritance Aggregation Aggregation Class Class
� instance of Data Type
� instance of Function
� comprises � instance of View
� accessed through DAO Package
DATA COLLECTION
DATA INTERPRETATION
DATA VISUALISATION
Figure 2: Components of a Visualisation Catena and their Types. Figure 2 gives an overview of all VC components and their corresponding types. Basically, a VC consists of elements responsible for data collection, interpretation, and visualisation. The Specula controlling framework distinguishes between the following five components on the type level: (T1) Data types describe the structure of incoming data and data that is further processed by the VC. For instance, a time series (a sequence of time stamp and corresponding value pairs) or a project plan (a hierarchical set of activities having a start and end date and an effort baseline) could be logical data types that could either be directly read-in by the system or be the output of a data processing function. (T2) Data access object packages describe the different ways concrete data types may be accessed. For instance, an XML package contains data access objects for reading data (having a certain data type) from an XML file, writing data to an XML file, or changing the contents of an XML file. A special package may be used, for instance, to automatically connect to an effort accounting system or bug tracking data base. A data access object contains data type-specific parameters in order to access the data repositories. For instance, a URL, table name, user name, and password would have to be specified in order to retrieve data from an SQL database. (T3) Web forms describe a concrete way to manage measurement data manually involving user interaction. A web form manages a concrete data type. For instance, new data may be added, existing data may be changed or completely removed. A web form also refers to other data types that are needed as input. For instance, in order to enter effort data manually, one need the concrete activities of the project for which the effort is accounted. Moreover, a web form can be parameterised according to a project’s and organisation’s context. (T4) Functions represent a certain controlling technique or method, which is used to process incoming data (like Earned Value Analysis, Milestone Trend Analysis, or Tolerance Range Checking). Usually, a function covers at least one measurement purpose, like monitoring a project’s attribute, analysing data, or just comparing actual data with baselines, and has to be adapted in correspondence to the context. A function needs different data types as input, produces data of certain data types as output, and may be adapted to a concrete context through a set of parameters.
(T5) Views represent a certain way to present the (processed) data, like drawing a twodimensional diagram or just a table with a certain amount of rows and columns. Usually, a view is associated with one or more roles of the project, like the project manager or the quality assurance manager, and has to be adapted in correspondence to the project context through a set of parameters. A view visualises different data types and may refer to other views in order to create a hierarchy of views. The latter may, for instance, be used to create a view for a certain project role that consists of a set of sub-views. In addition, the following components are distinguished on the four instances level: (I1) Data entries instantiate data types and represent the concrete content of measurement data that are processed by the control centre. We basically distinguish between external and internal data. External data must be read-in or imported from an external location, or manually entered into the system. Each external data object has to be specified explicitly by a data entry containing, for instance, the start and end time and the interval at which the data should be collected. In addition, the data access object package that should be used to access the external data has to be specified. Internal data are the outcome of functions (executed by the control centre). They are implicitly specified by the function producing the corresponding data type as output and therefore need no explicit specification and representation as data entry. External as well as internal data may be used as input for instances of functions or views if their corresponding data types are compatible. (I2) Web form instances provide web-based forms to manually manage measurement data for data entries. All mandatory input data type slots of the instantiated web form have to be filled with concrete data entries and all mandatory parameters have to be set accordingly. If measurement data is managed by an external system (e.g., a company-wide bug tracking system) and consequently read-in via an external data access object (as specified in a data entry), no web form instance needs to be instantiated. (I3) Function instances apply the instantiated function to a certain set of data entries filling the mandatory input slots of the function. A function instance processes (external and internal) data and produces (internal) output data as specified by the function, which could be further processed by other function instances or visualised by view instances. All mandatory function parameters have to be set accordingly. (I4) Finally, view instances apply the instantiated view to a certain set of data entries filling the corresponding mandatory data type slots of the view. A view instance may refer to other (sub-) view instances in order to build up a hierarchy of views. For instance, if a certain view is suited for the project manager as well as for the quality assurance manager, it may be modelled as one sub-view that is contained in the project manager’s view as well as in the quality assurance manager’s view. Each component of a VC and its corresponding type contains explicitly specified checks that may be used to test whether the specification is complete and consistent, whether data are read-in correctly, whether function instances can be computed accurately, and whether view instances can be created successfully. A visualisation catena comprises the whole data processing and presentation chain needed to build up a purpose-, role-, and context-oriented view on the incoming data. It consists of a set of data entries, each having exactly one active data access object for accessing incoming data, a set of web form instances for managing the defined data entries, a set of function instances for processing externally collected and internally processed data, and finally, a set of view instances for visualising the processing results. Comprehensive practical examples of Visualisation Catenae for different project goals may be found in [9]. A more formal specification of all components may be found in [7].
4. Selection of Control Components The previous section defined reusable control components and their instantiation as a project-specific Visualisation Catena. For a goal-oriented selection of control components, a structured approach is needed that describes how to systematically derive control components from project goals and characteristics. The Specula framework makes use of GQM in order to define measurement goals in a structured way. GQM provides a template for defining measurement goals, systematically derives questions that help to make statements about the goals, and finally derives metrics in order to help answer the stated questions. In order to complete such a measurement plan for a concrete project, each metric can further be described by a data collection specification (DCS) basically making statements on who or which tool has to collect the measurement data at which point in time of the project from which data source. In [9], usage scenarios on how to derive a GQM plan from a control goal and how to define a VC that is consistent with the defined goals are described. In this article, we will present the approach used for selecting reusable control components in more detail. �visualises assessment of Goal
View Instance
assessed through �
visualises answers of �
�computes assessment for Function Instance
Question
� refined by
�computes answers for
answered through �
� refined by
Metric
operationalised through � Data Collection Specification
�collects data for
�implements
� comprises
� presents results of
� is build upon
� processes contents of
�computes values for
Data Entries �collects data according to
� implemented through
Web Form Instance
Association Association Inheritance Inheritance Aggregation Aggregation Class Class
Figure 3: Relationships between GQM and the Visualisation Catena Concept. Figure 3 presents an overview of all relationships between a GQM plan, its DCS, and a VC. (A) Data entries collect measurement data for GQM metrics according to the DCS. If the data has to be collected manually, a web form instance is used to implement the DCS in addition. For instance, if the DCS states that the start and end date of an activity shall be collected from an MS Project file, a corresponding data entry is defined and a web form instance implements importing the project plan from the file. If a central repository exists for such plan information, the date entry would directly connect to the repository (via a matching data access object) and retrieve the measurement data on a regular basis as specified. In the latter case, no web form instance would be needed. (B) Function instances compute metric values if a metric has to be computed from other metrics. For instance, if a cost performance index is computed for an Earned Value Analysis [6], the budgeted costs of work performed and the actual costs of work performed are needed. This complex metric would be computed from the two simpler ones by a function instance. A function instance could also compute answers for GQM questions by taking into account all metrics assigned to the question and applying an interpretation model to all metric values. For instance, if the question were to ask for cost performance of the project, a function instance would assess the values of the cost performance index accordingly. In analogy, a function instance could assess the attainment of a GQM goal by assessing the answers of all assigned questions using an interpretation model. For instance, if the goal was to evaluate the project plan with respect to schedule and cost, a function instance could assess the answers of
the corresponding questions asking for cost and schedule performance and cost and schedule variance. (C) View instances visualise the answers to GQM questions. A chart is produced or tables are displayed illustrating the metric results of the corresponding questions and the interpretation model used to answer the question. Basically, this means that the results of function instances and data entries are visualised by selected view instances. For instance, the cost performance and schedule performance index could be visualised as a line chart in which good and bad index values are marked accordingly. Moreover, a view instance could visualise the assessment of the GQM goal by visualising the combined answers of all assigned questions. Attributes •• Object Object •• Purpose Purpose •• Quality Quality Focus Focus •• Viewpoint Viewpoint •• Context Context
GQM Plan
Repositories Visualisation Catena VI VI
VV VI VI
G G
•• Question Question •• Object Object •• Quality Quality Attribute Attribute
Q Q
FF
M M
M M
M M
DCS DCS
DCS DCS
DCS DCS
•• Object Object •• Collection Collection Time Time •• Data Data Source Source •• Collection Collection Procedure Procedure •• Validation Validation
VI VI
FI FI
FI FI
FI FI
Q Q •• Definition Definition •• Object Object •• Quality Quality Attribute Attribute •• Scale/Domain/Unit Scale/Domain/Unit •• Type Type
VI VI
FI FI DT DT
WF WF
DE DE
DE DE
DE DE
DE DE
WFI WFI
WFI WFI
DB DB
IDE IDE
G Goal G Goal Q Question Q Question M Metric M Metric DCS DCS Data Data Collection Collection Specification Specification VV View View VI View VI View Instance Instance FF Function Function FI Function FI Function Instance Instance DT Data DT Data Type Type DE Data DE Data Entry Entry WF WF Web Web Form Form WFI WFI Web Web From From Instance Instance Association Association Data Data Flow Flow
Figure 4: Identification of Reusable Control Components based on GQM. Utilising the relationships discussed above, we may use the (semi-)formal description of a GQM plan to identify reusable control components and instantiate a corresponding VC accordingly. A formal definition of a GQM plan as well as a specification of several additional attributes that could be used to identify control components from a repository can be found in [5]. Figure 4 illustrates the main attributes of a GQM plan specification and their influence on selecting the right control components from which the VC is instantiated. The high-level steps of this selection process are as follows: (S1) Assign each metric to a data type. The instantiated data entry will contain the metric values later on. Identify matching data types based on the metric definition, the object to measure and the quality attribute. For each simple metric (which is not computed out of other metrics) instantiate the data type and create a corresponding data entry. Use the data collection specification to determine the start time, end time, and interval when the data should be collected. Use the object and data source information in order to assign a corresponding data access object. Activate checks if a certain validation strategy matches those implemented in the data type. If the metric has to be collected manually (that is, no repository exists where the measurement data is stored), identify a web form based on the data source and attach the instantiated web form to the data entry. If no matching data type or web form can be identified, create a new control component matching the requirements of the measurement plan. (S2) For each complex metric (which is computed from other metrics), identify a function that is able to compute the metric based on the metric definition, the object to measure, and the quality attribute. If the algorithm cannot be matched to a single function, try to identify helper functions to compute the metric values. For instance, if a function checks whether actual effort values stay within a certain tolerance range and your project only defines one effort baseline in the project plan, scale the baseline in order to compute an upper and lower
bound using a corresponding function. Instantiate the identified functions by first filling all input data slots with data entries or results of other function instances. Finally, parameterise the function instances according to the metric definition. For instance, if the tolerance range should be 10% above or below the effort baseline, set the corresponding parameter of a scaling function instance accordingly. Activate checks if a certain validation strategy matches those implemented in a function. If no matching function can be identified, create a new control component matching the metric definition. (S3) If an interpretation model is described in the GQM plan that defines how to formally answer a question, identify a function implementing this model based on the object and quality attribute addressed in order to compute the answers to the question. Instantiate the identified functions by filling all input data slots with data entries or results of other function instances assigned to the question. Parameterise the function instances according to the interpretation model. If no matching function can be identified, create a new control component matching the interpretation model. If a question is comprised of sub-questions, identify functions for each sub-question first and aggregate the answers of the parent question using a corresponding function. (S4) Visualise the answers of the question by identifying a set of views based on the kind of answers to the question and the data visualisation specifications of the measurement plan (if any). A view may be identified by brute force by searching for views that visualise the corresponding data type of (i) a function computing answers for the question or (ii) a function computing (complex) metric values for the question, or (iii) a data entry collecting (simple) metric values for the question. Instantiate the identified views by filling all input data slots with data entries or results of function instances assigned to the question. Parameterise the view instances according to the data presented (e.g., title and axis description, size, and colour). If no matching view can be identified, create a new control component matching the interpretation model. If a question is comprised of sub-questions, identify views for each subquestion first and reference them in the visualisation of the parent question using a view that is able to align views hierarchically. (S5) If an interpretation model is described in the GQM plan that defines how to formally assess goal attainment, identify a function implementing this model based on the object and quality focus addressed in order to attain the measurement goal. Instantiate the functions in analogy to the 3rd step. (S6) Visualise goal attainment by identifying a set of views based on the kind of assessment of the goal and the data visualisation specifications of the measurement plan (if any). Instantiate the views in analogy to the 4th step. The selection process described above is largely performed manually. It could be partly automated depending on the degree of formality of the corresponding measurement plan. However, currently, performing this process requires a deeper understanding of the measurement program that should allow for project control and the components of the repository that may be reused. The control components within the repository depend on the organisation (and the very project that should be controlled). Some components may be more general and applicable for several companies, whereas others may be very specific and implement organisation-specific control strategies. This is also related to the different kinds of components in the repository. For instance, one control component may implement a (fairly) complex control technique (like Earned Value Analysis) and another component may just provide some simple data processing to support other functions (like scaling a time series or converting between different data types). Figure 5 shows a very simple example of how to select reusable control components. The GQM goal was to evaluate the effort plan with respect to plan deviation. The one and only
question asked was about absolute effort deviation per activity. A complex metric defined the deviation as the amount that an actual effort value is above an effort baseline or below 10% of this baseline. Two simple metrics were defined consequently and operationalised by corresponding data collection specifications. The baseline should be extracted from a project plan stored in an MS project file, so a corresponding web form collecting project plan information and a data type representing the project plan including the effort baseline are instantiated. Furthermore, a function is applied to extract the effort baseline from the project plan. The actual effort data should be extracted from the company-wide effort accounting system including the effort per person and activity. A data type is instantiated that connects to the accounting system using a corresponding data access object. A function is applied to aggregate the effort data for each activity across all persons. Visualisation Catena GQM Plan Object: Object: Purpose: Purpose: Quality Quality Focus: Focus: Viewpoint: Viewpoint: Context: Context:
Effort Effort Plan Plan Evaluate Evaluate Plan PlanDeviation Deviation Project Project Manager Manager Project Project LAB LAB
Q1: Q1:Absolute Absoluteeffort effort deviation deviationper per activity? activity? M1: M1: Absolute Absoluteeffort effort deviation deviationabove abovebaseline baseline and and below below10% 10% of of baseline baseline M2: M2: Effort Effort baseline baseline per peractivity activity
DCS1: DCS1:Collect Collect weekly weeklyfrom from project projectplan plan(stored (stored in inMS MS Project Project format) format)
M3: M3: Actual Actualeffort effort per per activity activity DCS2: DCS2: Collect Collectdaily dailyfrom from effort effort accounting accounting data data base base (as (as effort effort per per person personand and activity) activity)
Reused Components
VI1: VI1: Effort Effort Controlling Controlling View View
V1: V1: Hierarchical Hierarchical Line Line Chart Chart
Effort Plan Deviation
FI1: FI1: Effort Effort Tolerance Tolerance Range Range Checking Checking
F1: F1: Tolerance Tolerance Range Range Checking Checking F2: F2: Scaling Scaling F3: F3: Extract Extract Process Process Information Information F4: F4: Aggregate Aggregate Data Data
Lower Effort Baseline
FI2: FI2: Compute Compute Lower Lower Effort Effort Bound Bound Effort Baseline per Activity
DT1: DT1: Project Project Plan Plan Structure Structure DT2: DT2: Table Table Structure Structure WF1: WF1: MS MS Project Project Import Import From From
FI3: FI3: Extract Extract Baseline Baseline Project Plan (and Effort Baseline)
WFI1: WFI1: MS MS Project Project Import Import From From
Effort per Activity
FI4: FI4: Aggregate Aggregate Effort Effort Data Data Reported Effort
Effort Effort Accounting Accounting
Figure 5: Sample Selection of Reusable Control Components.
Figure 6: Web-based Implementation of the Specula Framework. In order to detect effort plan deviations below 10% of the baseline, a lower effort bound must be computed. Therefore, a scaling function is instantiated and parameterised with 10%. In order to compute the complex metric, a tolerance range checking function is applied that computes the effort plan deviation accordingly. Finally, a view is instantiated in order to
graphically display the results of the assigned function instances and data entries. A visualisation of the example can be found in Figure 6. The screenshot is taken from the web-based Specula tool implementation and also contains other view instances of a project manager controlling view. Overall, four GQM goals were interpreted and visualised, including effort plan evaluation, defect slippage control, defect states and classes control, and schedule deviation. The VC consists of 8 view instances, 5 function instances, 9 data entries, and 9 web form instances. The Specula framework is currently used and developed as part of the Soft-Pit project and evaluated there in the context of industrial application scenarios. First evaluation results will be presented in [3].
5. Related Work An overview of the state of the art in Software Project Control Centres can be found in [16]. The scope was defined as generic approaches for online data interpretation and visualisation on the basis of past experience. However, project dashboards were not included in this overview. In practice, many companies develop their own dashboards (mainly based on Spreadsheet applications) or use dashboard solutions (e.g., test dashboards [21]) that provide a fixed set of predefined functions for project control (e.g., deal with product quality only or solely focus on project costs) and are very specific to the company for which they were developed. Most of the existing, rather generic, approaches for control centres offer only partial solutions. Especially purpose- and role-oriented usages based on a flexible set of techniques and methods are not comprehensively supported. For instance, SME (Software Management Environment) [10], [14] offers a number of role-oriented views on analysed data, but has a fixed, built-in set of control indicators and corresponding visualisations. The SME successor WebME (Web Measurement Environment) [21] has a scripting language for customising the interpretation and visualisation process, but does not provide a generic set of applicable controlling functions. Unlike Provence [13] and PAMPA [19], approaches like Amadeus [18] and Ginger2 [23] offer a set of purpose-oriented controlling functions with a certain flexibility, but lack a role-oriented approach to data interpretation and visualisation. There also exist lightweight SPCC implementations (e.g., [4]) that concentrate on core metrics that are adapted to the corresponding project environment. The indicators used to control a development project depend on the project’s goals and the organisational environment. There is no default set of indicators that is always used in all development projects in the same manner. According to [15], a “good” indicator has to (a) support analysis of the intended information need, (b) support the type of analysis needed, (c) provide the appropriate level of detail, (d) indicate a possible management action, and (e) provide timely information for making decisions and taking action. The concrete indicators that are chosen should be derived in a systematic way from the project goals [12], making use of, for instance, the Goal Question Metric (GQM) approach. Some examples from indicators used in practice can be found in [1] and [14]. With respect to controlling project cost, the Earned Value approach provides a set of commonly used indicators and interpretation rules [6]. With respect to product quality, there exists even an ISO standard [11]. However, the concrete usage of the proposed measures depends upon the individual organisation. Moreover, there is no unique classification for project control indicators. One quite popular classification of general project management areas is given by the Project Management Body of Knowledge (PMBoK) [17]. The PMBoK distinguishes between nine areas, including project time, cost, and quality management. The ideas behind GQM and the Quality Improvement Paradigm (QIP) [2] are well-proven concepts that are widely applied in practice today. An approach based on GQM and QIP to
create and maintain enhanced measurement plans, addressing data interpretatation and visualisation informally is presented in [5]. Moreover, related work in this field is presented.
6. Conclusion and Future Work The article presented the Specula controlling framework in order to set up a project control mechanism in a systematic and goal-oriented way, profiting from experiences gathered. Reusable control components were defined and instantiated in order to illustrate how to define measurement-based project control mechanisms and to instantiate them for the software development projects of a concrete organisation. A high-level process was shown that gave guidance on how to select the right control components for data collection, interpretation, and visualisation based on explicitly defined measurement goals. Moreover, a simple example was presented of how to apply generically defined control components. The Specula framework implements a dynamic approach for project control; that is, measures and indicators are not predetermined and fixed for all projects. They are dynamically derived from measurement goals at the beginning of a development project. Existing control components can be systematically reused across projects (and partly across organisations if similar goals are concerned) or defined newly from scratch. Data is provided in a purposeand role-oriented way; that is, a certain role sees only measurement data visualisations that are needed to fulfil the specific purpose. Moreover, all project control activities are defined explicitly, are built upon reusable components, and are systematically performed throughout the whole project. A context-specific construction kit is provided, so that elements with a matching interface may be combined. Further development and evaluation of the approach will take place in the context of the Soft-Pit project. The project includes performing several industrial case studies with four different German companies, in which control centres and their deployment are evaluated. The project is mainly organised intro three iterations focusing on different controlling aspects. An application of Specula in the first iteration showed the principle applicability of the VC concept in an industrial environment [3]. The current iteration focuses more on the selection process of the reusable control components and will evaluate parts of the approach presented in this article. Future work will also concentrate on setting up a holistic control centre that integrates more aspects of engineering-style software development (e.g., monitoring of process-product dependencies, integration of supplier interfaces, and linking results to higherlevel goals). The starting point for setting up such a control centre are usually high-level business goals from which measurement programs and controlling instruments can be derived systematically. Thus, it would be possible to transparently monitor, assess, and optimise the effects of business strategies performed (such as CMMI-based improvement programs).
7. Acknowledgements We would like to thank Sonnhild Namingha from Fraunhofer IESE for reviewing a first version of the article. This work was supported in part by the German Federal Ministry of Education and Research (Soft-Pit Project, No. 01ISE07A).
8. References [1] [2] [3]
Agresti, W.; Card, D.; Church, V.: Manager’s Handbook for Software Development; SEL 84101. NASA Goddard Space Flight Center. Greenbelt, Maryland, November 1990. Basili, V.R.; Caldiera, G.; Rombach, D: The Experience Factory. Encyclopaedia of Software Engineering 1, 1994, pp. 469-476. Ciolkowski, M.; Heidrich, J.; Münch, J.; Simon, F.; Radicke, M.: Evaluating Software Project Control Centers in Industrial Environments; International Symposium on Empirical Software Engineering and Measurement (ESEM) 2007, Madrid. (submitted)
[4]
[5] [6] [7] [8]
[9]
[10]
[11] [12] [13]
[14]
[15]
[16] [17]
[18]
[19]
[20] [21]
[22]
[23]
Daubner, B.; Henrich, A.; Westfechtel, B.: A Lightweight Tool Support for Integrated Software Measurement; Proceedings of the International Workshop on Software Metrics and DASMA Software Metrik Kongress IWSM/MetriKon 2006, Potsdam (Germany), 2006, pp. 67-80. Differding, C: Adaptive measurement plans for software development; Fraunhofer IRB Verlag, PhD Theses in Experimental Software Engineering, 6, ISBN: 3-8167-5908-4, 2001. Fleming, Q.W.; Koppelmann, J.M.: Earned Value Project Management; Second Edition. Project Management Institute, Newtown Square, 2000. Heidrich, J.: Custom-made Visualization for Software Project Control; Technical Report 06/2003, Sonderforschungsbereich 501, University of Kaiserslautern, 2003. Heidrich, J.; Münch, J.: Goal-oriented Data Visualization with Software Project Control Centers; In: G. Büren, M. Bundschuh, R. Dumke (ed.): MetriKon 2005, Praxis der SoftwareMessung, Tagungsbad des DASMA-Software-Metrik-Kongresses, Nov. 15-16, 2005, Kaiserslautern, Germany. Shaker, ISBN 3-8322-4615-0, 2005, pp. 65-75. Heidrich, J.; Münch, J.; Wickenkamp, A.: Usage Scenarios for Measurement-based Project Control; In: Ton Dekkers (ed.): Proceedings of the 3rd Software Measurement European Forum, May 10-12, 2006, Rome, Italy. Smef 2006, pp. 47-60. Hendrick, R.; Kistler, D.; Valett, J.: Software Management Environment (SME)— Concepts and Architecture (Revision 1); NASA Goddard Space Flight Center Code 551, Software Engineering Laboratory Series Report SEL-89-103, Greenbelt, MD, USA, 1992. ISO 9126: Software Engineering – Product Quality; Technical Report. ISO/IEC TR 9126. Geneva, 2003. Kitchenham, B.A.: Software Metrics; Blackwell. Oxford, 1995. Krishnamurthy, B.; Barghouti, N.S.: Provence: A Process Visualization and Enactment Environment. Proceedings of the 4th European Software Engineering Conference, Lecture Notes in Computer Science 717; Springer: Heidelberg, Germany, 1993, pp. 451-465. McGarry, F.; Pajerski, R.; Page, G.; Waligora, S.; Basili, V.R.; Zelkowitz, M.V.: An Overview of the Software Engineering Laboratory; Software Engineering Laboratory Series Report SEL94-005, Greenbelt, MD, USA, 1994. McGarry, J.; Card, D.; Jones, C.; Layman, B.; Clark, E.; Dean, J.; Hall, F.: Practical Software Measurement – Objective Information for Decision Makers, Addison-Wesley Professional; 1st edition, ISBN 4-320-09741-6, October 15, 2001. Münch, J.; Heidrich, J.: Software Project Control Centers: Concepts and Approaches. Journal of Systems and Software, 70 (1), 2003, pp. 3-19. Project Management Institute: A Guide to the Project Management Body of Knowledge (PMBOK® Guide) 2000 Edition. Project Management Institute, Four Campus Boulevard, Newtown Square, PA 19073-3299 USA, 2000. Selby, R.W.; Porter, A.A.; Schmidt, D.C.; Berney, J.: Metric-Driven Analysis and Feedback Systems for Enabling Empirically Guided Software Development. Proceedings of the 13th International Conference on Software Engineering, 1991, pp. 288-298. Simmons, D.B.; Ellis, N.C.; Fujihara, H.; Kuo, W.: Software Measurement – A Visualization Toolkit for Project Control and Process Improvement; Prentice Hall Inc: New Jersey, USA, 1998. Soft-Pit Project Homepage (http://www.soft-pit.de). Last visited Apr. 5th, 2007. SQS AG, SQS-Test-Professional, Component Process Performance Management to Monitor Test Quality and Error Rates, http://www.sqs.de/portfolio/tools/tools_ppm.htm, last checked Jan 11, 2006. Tesoriero, R.; Zelkowitz, M.V.: The Web Measurement Environment (WebME): A Tool for Combining and Modeling Distributed Data. Proceedings of the 22nd Annual Software Engineering Workshop (SEW), 1997. Torii, K.; Matsumoto, K.; Nakakoji, K.; Takada, Y.; Takada, S.; Shima, K.: Ginger2: An Environment for Computer-Aided Empirical Software Engineering. IEEE Transactions on Software Engineering 25(4), 1999, pp. 474-492.