International Journal of Computers and Applications, Vol. 31, No. 3, 2009
ESTIMATING MANUAL TEST EXECUTION EFFORT AND CAPACITY BASED ON EXECUTION POINTS E. Aranha∗ and P. Borba∗∗
COCOMO [4]). Regarding testing effort, test point analysis [5] is an approach similar to FPA used for estimating the effort of the whole testing phase of a given information system. However, these approaches do not estimate the effort required to execute a given set of tests, as their estimates are based on software size and development complexity instead of test size and execution complexity [6]. For this reason, estimates made by test teams are usually based on expert judgment [7], which generally is subjective and not repeatable. This work presents a new approach for estimating the effort required to manually execute functional tests, which is a problem specially important in the context of embedded systems (e.g., mobile applications) and other domains that demand high manual test execution effort. For instance, it is very hard to automatically test the quality of videos and sounds of mobile applications and to port and maintain automated tests considering all different existing phone models and operating systems. In practice, these types of tests are executed manually. In a previous work [6], we proposed a measure for test size and execution complexity (called execution points, EPs) and its measurement method. In another work [8], we presented a manual test execution effort estimation model and run an initial evaluation using a small data set. In this paper, we extend previous works by proposing a new manual test execution capacity estimation model that is based on EPs. We also evaluated the use of EPs for estimating manual test execution effort by running a case study that considered a larger data set. The paper is organized as follows. Section 2 presents the measure for test size and execution complexity (EPs) and its measurement method. Then, Sections 3 and 4, respectively, show how to estimate manual test execution effort and manual test execution capacity based on EPs. After that, Section 5 presents empirical results that suggest the viability of our approach. Finally, Sections 6 and 7 present related work and our final conclusions.
Abstract In some domains, such as the mobile application domain, functional tests may not be feasible to automate due to limited test automation technology (multimedia support, etc.)
or high cost to port
automated tests for different phone models and operating systems. In this context, test teams should be able to estimate the effort required to manually execute tests on schedule. Although several effort estimation approaches have been proposed over the years, none of them are appropriate for estimating manual test execution effort. The main reason for that is the lack of size measures for test projects. In this paper, we present execution points, a measure for the size and execution complexity of tests that is calculated based on test specifications. We also show how to estimate manual test execution effort and capacity based on this measure.
Finally, results from an empirical study suggested the
viability of our proposed measure.
Key Words Manual test execution, size measure, effort estimation, capacity estimation
1. Introduction A usual activity performed to ensure quality is software testing. In fact, software testing is being considered so important that an organization can allocate teams exclusively for testing activities to achieve unbiased test results [1]. Mainly, in such situations, test managers should be able to estimate the effort required to perform their test activities on schedule, justifying requests for more resources or new deadlines. Otherwise, there may occur schedule overrun or overtime. Several estimation approaches and models have been proposed over the years for estimating software development effort [2] (e.g., function point analysis (FPA) [3] and ∗
School of Sciences and Technology, Federal University of Rio Grande do Norte, Campus Universit´ ario, Lagoa Nova, 59078970, Natal, Brazil; e-mail:
[email protected] ∗∗ Informatics Center, Federal University of Pernambuco, Av. Professor Luis Freire s/n, Cidade Universitaria, 50740-540, Recife, Brazil; e-mail: {ehsa, phmb}@cin.ufpe.br (paper no. 202-2964)
2. Test Size and Execution Complexity Test teams may not have enough resources or time to execute all tests of an application when features are being developed or changed. For this reason, only a subset of 167
existing tests is selected for execution. To enable the effort estimation for executing any given set of tests, we propose a measure for test size and execution complexity that is calculated based on test specifications. Tests are usually specified in terms of pre-conditions, procedure (steps, inputs and expected outputs) and postconditions [9]. These specifications are commonly written in natural language, often leading to problems such as ambiguity, redundancy and lack of writing standard (level of detail, structure, etc.). All these problems make difficult to understand and estimate test size and execution complexity. In this work, we consider that tests are written in a standardized language. In a simplified way, each sentence (test step) of the test specifications conforms to the following structure: a main verb and zero or more arguments. The verb identifies the action of the test step to be performed during the test. The arguments provide additional information about the action represented by the verb. For instance, the sentence Start the message center has the verb start (action of starting an application) and the required argument the message center (application to be started). The details of our proposed measure and its measurement method are presented next.
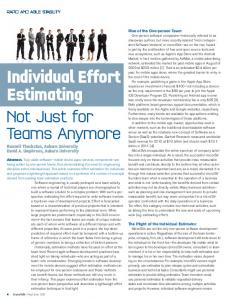
Figure 1. Assigning EPs to a test case. later, a Delphi approach can be used to choose the set of relevant characteristics and to define guidelines to help the selection of the more appropriate impact level for each characteristic. After that, (c) we assign EPs for each characteristic according to its impact level, transforming the qualitative rate (impact level) into a quantitative value. For instance, a characteristic C1 rated with the Low value can be assigned to 30 EPs. However, a more relevant characteristic rated with the Low value may be assigned to a higher number of EPs. Again, guidelines are provided for assigning the correct value for each possible characteristic value. To calculate the total number of EPs of a test step, (d) we sum the points assigned for each characteristic. Then, (e) we measure the size and execution complexity of a test by summing the EPs of each one of its test steps. In practice, we need to measure the size and execution complexity of test suites (set of related tests). For that, we measure the EPs of each test specification. Then, the sum of these points represents the size and execution complexity of the whole test suite. The presented measurement method should be configured according to the target application domain to maximize the estimation accuracy. During the test execution effort estimation, all test steps are analyzed according to a list of characteristics, which may depend on the target application domain. For instance, the use of phone keys and the use of mobile network are, respectively, examples of a functional and a non-functional requirement on the mobile application domain. Our method is configured as follows. The Delphi method [13] or a survey can be used for obtaining a consensus from a group of experts about the list of relevant characteristics. In addition, experts have to define the possible values of each characteristic. For example, if the type of camera is selected as a relevant characteristic for test size and execution complexity, its possible values would be automatic shooting, required manual zoom or use of flash. After that, experts should group these values into three impact levels (Low, Average and High). The choices are
2.1 Execution Points Regarding the presented specification language, we can automatically read tests and measure size and execution complexity. By test size, we mean the amount of steps required to execute the test. We consider test execution complexity as the difficulty of interaction between the tester and the tested product during test execution. These definitions are adaptations of the idea of size and development complexity for software products [10–12]. The proposed measure, called EPs, should reflect the amount of work need to manually execute tests. Basically, this measure is based on the amount of test actions (steps) and the functional (data input, screen navigation, etc.) and non-functional (use of network, etc.) characteristics of the tested application and system environment that are exercised by the action. 2.2 EPs Measurement Method Fig. 1 illustrates how we measure EPs. First, (a) we individually analyze each test step of the test specification. This step by step analysis was defined with the objective to support the measurement method automation. We analyze each test step according to a list of characteristics (C1 to Cn ). These characteristics represent some general functional and non-functional requirements exercised when the test step is executed. Examples of possible characteristics are number of navigations between screens, number of pressed keys and use of network. Each characteristic considered by the method has an impact on the size and execution complexity of the test and, consequently, on the effort required to execute the test. (b) This impact is rated using an ordinal scale (Low, Average and High). As described 168
independent variables one-at-a-time until some stopping rule is satisfied. Basically, the main goal is to find the best set of predictors (cost drivers) and to build an equation to explain the variation in the response (effort):
made based on the impact of each value in the test size and execution complexity. Guidelines should be created to help the testers to choose the more appropriate impact level of a test step according to each characteristic. Finally, the experts must define the number of EPs to be assigned for each impact level of each characteristic. The experts can proceed as follows. Each characteristic is weighted from 1 to 10. These weights indicate the significance of each characteristic for the test size and execution complexity. Then, the experts give a weight from 1 to 10 for the levels Low, Average and High of each characteristic. These weights indicate the significance of each level for the characteristic. After that, the number of EPs assigned for a level is calculated by multiplying its weight by the weight of its characteristic. The list of relevant characteristics, their values and weights can be updated periodically.
Ef f ort = α + β0 EP + β1 D1 + . . . + βn Dn
(1)
where EP is the number of EPs of the tests, Ef f ort is the effort to execute the tests, D1 to Dn are cost drivers for test execution selected as good predictors by the regression analysis (e.g., team experience, software stability, etc.), α and β0 to βn are model coefficients defined during the regression analysis. A general linear model [14] can also be used to consider interactions between cost drivers and test size. Historical data about test execution and cost drivers are required to run the regression analysis. 4. Test Execution Capacity Estimation
3. Test Execution Effort Estimation
It is important to know the current capacity of test teams for executing tests to plan their schedules and resources. In general, the capacity of a test execution team is measured by the number of tests or test suites (group of test cases selected according to some criteria) that can be executed per day [7]. Nevertheless, the effort required to execute a test or a test suite can vary a lot, increasing the error of the capacity estimation. This fact makes the test execution capacity estimation difficult. In this work, we consider test execution capacity as the volume of test (in EPs) that can be executed per day. In a simplified way, we calculate the capacity of a test execution team as shown in (2), multiplying the available manpower (man-hours per day) by the team productivity (average number of EPs executed per man-hour):
The EP counting of a test suite gives us a reference about its tests size and execution complexity. We believe that this is the most important information for estimating test execution effort. As presented next, we investigated the use of some estimation models based on the EPs measure. 3.1 Test Productivity-based Model The estimated effort can be calculated based on the EP counting and a conversion factor (CF). This CF represents the relation between test execution effort and EPs, which varies according to the productivity of the test team. The CF is given in seconds per EP, indicating the number of seconds required to execute each EP of a test. For calculating the CF, testers can measure the test size and execution complexity of several tests. Then, the execution time of the tests should be collected from a historical database (if available) or by executing them. The CF is calculated by dividing the total effort by the total number of EPs. This information is then used for estimating the execution effort of new test suites, by multiplying its number of EPs by the CF. For instance, a test manager can verify a CF of 3 s per EP. Using this value, a new test with 120 EPs is estimated to be executed in 6 min. Similar approach is used by other existing estimation models [3, 5, 10]. In this approach, we assume that the test productivity and environment conditions are stable over time. For example, improvements in the test team, tools or environment may change the test productivity and consequently the CF. In this case, the CF should be recalculated using data collected after the improvements.
Capacity = M anpowerP erDay×T eamP roductivity (2) The result of this expression is the average number of EPs that can be executed per day with a given manpower (number of available testers × working hours per day) and team productivity. When we have to consider very different test teams productivities or when test environments can change significantly over time (network availability, time pressure, etc.), the estimation error of the capacity model is higher due to all these uncertainties. To deal with these situations, we can simulate the capacity model. Model simulation is a useful technique to simulate real situations (model inputs) to verify the system behaviour (model output) in those situations [15]. For simulating a model, a random value is generated for each input variable (team productivity, number of tests, etc.). These random values are usually chosen according to probability distributions, which basically describe the possible values of a variable and their probabilities to occur. The probabilistic distributions used in a simulation can be defined by using expert judgement or historical data. Examples of common probabilistic distributions are the normal and the triangular probabilistic distributions. After generating random values for the model inputs, we calculate the expected test execution capacity for that
3.2 Regression Model In this approach, we use stepwise regression (SWR) [14] to build a regression model, that is a mathematical equation relating independent (predictors) and dependent (response) variables. SWR is a statistical technique that builds a regression model by adding and possibly removing 169
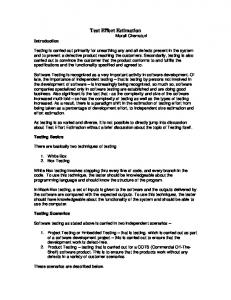
Table 1 Descriptive Statistics of the Historical Database Used in the Study Test Suite Characteristic
Mean
Number of tests
48.55
Execution points Effort (hh:mm)
Median Min 57
15
Max
Std Dev
104
21.37
14,935.12 15,553 6,086 28,174 4,641.48 07:05
06:56
02:28 14:40
02:35
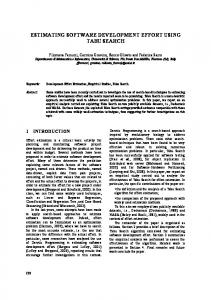
Table 2 Accuracy Improvement Achieved by using Execution Points (EPs) against of using Historical Execution Times (HET)
simulated scenario. This process is repeated several times. At the end, the simulation shows descriptive statistics of the observed capacity, such as the minimum, mean, median, mode and maximum capacity calculated during the model simulation. Finally, we can use the frequency of each observed capacity during the simulation to calculate its probability to occur. In this way, it is possible to calculate the probability of having our real capacity between a lower and an upper limit.
MMRE
PRED(0.25)
Fold HET EP Reduction HET EP Increase (%) (%) 1
0.30 0.12
60.37
0.50 0.97
93.75
5. Empirical Results
2
0.28 0.11
60.65
0.59 0.94
57.89
In this section, we overview the results of an empirical study, whose main goal was to analyze and compare the accuracy of test execution effort estimates calculated by using historical execution times (HET) (a simple and common estimation method used in practice) and EPs. Based on this goal, we defined the research question and research hypothesis of this study as follows: RQ: What is the impact on estimation accuracy when using EPs instead of HET? RH: We improve the accuracy of test execution effort estimates by considering the size and execution complexity of the tests given in EPs. To answer our research question, we compared estimates from the model presented in Section 3.1 with estimates calculated by multiplying the number of test to be executed by the average time spent in the past to execute a test. We used a historical database of manual execution on the mobile application domain. The analyzed database has information about the execution of 319 different test suites (sets of related tests) used to test the features of different types of mobile applications. Table 1 presents descriptive statistics of the analyzed data. For measuring the EPs, we used the characteristics and weights for the mobile application that were identified in [8] through a Delphi panel with test experts. We used the two estimation approaches to estimate test execution effort of previous test projects (historical database) in a 10-fold cross-validation analysis. During the cross-validation analysis, we observed a reduction (from 49.49% to 66.02%) of the mean magnitude of the relative estimation error (MMRE) and an increase (from 20.83% to 93.75%) of the average percentage of estimates that were within 25% of the actual values [PRED(0.25)], two measures commonly used to assess estimation accuracy. We used a paired t-test to reject our null hypothesis (P -value < 0.001, α = 0.05), which says that the mean accuracy of both estimation approaches are the same according to MMRE. Table 2 shows the accuracy improve-
3
0.27 0.12
53.83
0.53 0.94
76.47
4
0.28 0.10
66.02
0.72 1.00
39.13
5
0.30 0.14
52.70
0.63 0.81
30.00
6
0.36 0.17
53.00
0.63 0.84
35.00
7
0.30 0.11
64.11
0.56 1.00
77.78
8
0.30 0.12
58.91
0.75 0.91
20.83
9
0.33 0.12
62.93
0.56 0.88
55.56
10
0.31 0.15
49.49
0.68 0.90
33.33
Avg 0.30 0.13
58.20
0.61 0.92
51.97
ment achieved by the use of EPs during the cross-validation analysis. During our study, we verified that the cost to identify the relevant system characteristics and to define the guidelines for using our model was low. The Delphi assessment took 4 h of six experienced testers. We also analyzed the correlation between the EPs of the tests, number of tests and the effort to execute them. The linear correlation between effort and EPs was significative, achieving a Pearson’s correlation of 0.888 (P -value < 0.001). This number was larger than the correlation between effort and number of tests, which was 0.792 (P -value < 0.001). This study has some limitations and threats to validity. First, we did not consider the variation that can occur when changing the group of experts used to define test characteristics, guidelines, weights, etc. As a consequence, we do not know if this variation can significantly change the observed results. In addition, we used historical data that may be affected by some uncontrolled factors, such as test environment conditions, time pressure, etc. Although the cross-validation reduced the impact of these factors, more precise results can be achieved by controlling all relevant factors. 170
test step evaluation. It was possible to automate all steps of our estimation approach, except the evaluation of the first occurrence of each different test step (verb). Reducing the cost to use our approach, this automation is also important for supporting the development of new test generation and test selection tools that maximize requirement coverage and minimize execution effort. More details about the automation of our estimation approach are presented in [16]. We believe that the approach presented in this paper can be used to estimate the effort spent in other testing activities. For estimating test setup effort, we need to identify the relevant characteristics related to this activity and define guidelines, weights, etc. For estimating the effort to design the test specifications, the estimation models presented in Section 3 can be adapted to use a measure of the size and complexity of software specifications (function points, etc.). Nevertheless, the effort demanded by this activity is usually smaller than the execution effort, mainly when considering regression testing. Also, the effort of test design can be reduced by using model-based testing approaches [17]. Finally, other models can be created by extending the ideas presented in this paper: combine test coverage and EPs to perform test selection; use other characteristics and cost drivers to estimate test automation effort; add new characteristics and cost drivers relevant to estimate the effort to execute automated tests; combine test execution and test automation effort estimates with other variables (expected test execution frequency, deadlines, etc.) to support prioritization of tests for automation.
6. Related Work Test point analysis [5] is a method for estimating the effort required to perform all functional test activities. This model estimates the effort required for all test activities together, such as defining, implementing and executing all the tests, which is not appropriated for our context. For instance, when it is not possible to execute all tests due to time constraints, it is important to estimate the effort to execute only the selected subset of tests. The existing approaches, such as COCOMO [4] and FPA [3], are usually based on the size of the software under development and their estimates are for the whole development cycle (with some breakdown). For this reason, it is difficult to estimate the effort required to execute tests. In our approach, estimations are made based on test specifications instead of project requirements. Also, the definition of relevant characteristics, their values and their weights are defined by test experts, as it occurred with the FPA approach. With respect to the COCOMO II model (2000), it was calibrated by combined expert opinion (Delphi panel) and historical data (regression analysis). A similar calibration approach can be used to define the weights considered by our EPs measurement method. 7. Conclusions This work proposed and evaluated a measure, called EPs, for test size and execution complexity that is measured directly from test specifications written in standardized natural language. EPs is meant for estimating test execution effort and also for comparing tests. For instance, under the same environment conditions, a test assigned with 1,000 EPs should require approximately twice the effort needed to execute a test assigned with 500 EPs. In addition, EPs should allow us to better compare manual test execution productivity and capacity. It can be difficult to evaluate team capacity or tester productivity based only on the number of tests executed per day, as the tests may vary a lot in size and complexity. For example, a tester who executed 5 tests rated with 500 EPs each should be faster than other tester who executed 15 tests rated with 100 EPs during the same amount of time. In this paper, we also presented estimation models for manual test execution effort and capacity based on EPs. Our empirical results suggest the viability of estimating manual test execution effort based on EPs, supporting our research hypothesis. However, more empirical studies should be executed to support the hypothesis that EPs is a good predictor for test execution effort. Also, we did not evaluate the presented test execution capacity model. Nevertheless, we achieved interesting results using a similar capacity estimation model in previous work [7]. During our empirical study, evaluations of similar test steps were reused, as their execution complexity could be determined only by analyzing the main verb of each sentence (test step). However, if we had noticed that arguments (data input, etc.) of some verbs also have significant impact on test execution effort (application response time, etc.), they could be considered during the
Acknowledgements We would like to thank all anonymous reviewers who have helped us to improve this paper. The work of this paper was performed when E. Aranha was a DSc student at the Informatics Center of the Federal University of Pernambuco. He was partially supported by Motorola, grant BCT-0021-1.03/05, through the Motorola Brazil Test Center Research Project. The second author is partially supported by CNPq, grant 306196/2004-2. References [1] B.M. Broekman, Testing enbredded software (Boston, MA: Addison-Wesley Longman Publishing Co., Inc., 2002). [2] B. Boehm, C. Abts, & S. Chulani, Software development cost estimation approaches – A survey. Annals of Software Engineering, 10(1–4), 2000, 177–205. [3] D. Garmus & D. Herron, Function point analysis: Measurement practices for successful software projects (Boston, MA: AddisonWesley Longman Publishing Co., Inc., 2001). [4] B. Boehm, E. Horowitz, R. Madachy, D. Reifer, et al. Software cost estimation with COCOMO II (Upper Saddle River, NJ: Prentice Hall, 2000). [5] S. Nageswaren, Test effort estimation using use case points, 14th Int. Internet & Software Quality Week 2001, San Francisco, CA, June 2001. [6] E. Aranha & P. Borba, Measuring test execution complexity, 2nd Intl. Workshop on Predictor Models in SE (PROMISE 2006), Philadelphia, PA, 2006. [7] E. Aranha, P. Borba, & J. Lima, Model simulation for test execution capacity estimation, 17th IEEE Intl. Symp. on
171
[8]
[9] [10] [11]
[12]
[13] [14]
[15]
[16]
[17]
Paulo Borba obtained his doctoral degree in computing at Oxford University in 1995. He is an associate professor at the Informatics Center of the Federal University of Pernambuco, where he leads the Software Productivity Group. His main research interests are on the following topics and their integration: aspect-oriented languages and development, software product lines and program
Software Reliability Engineering (ISSRE 2006), Raleigh, NC, 2006, 231–236. E. Aranha & P. Borba, An estimation model for test execution effort, 1st Int. Symp. on Empirical Software Engineering and Measurement (ESEM 2007), Madrid, Spain, 2007, 107–116. P. Jorgensen, Software testing, A craftsman’s approach, second edition (Boca Raton, FL: CRC Press, 2002). C.R. Pandian, Software metrics: A guide to planning, analysis, and application (Boca Raton, FL: CRC Press, Inc., 2003). L. Briand, K.E. Emam, & S. Morasca, On the application of measurement theory in software engineering. Empirical Software Engineering: An International Journal, 1(1), 1996, 61–88. N. Fenton, Software measurement: A necessary scientific basis. IEEE Transactions on Software Engineering, 20(3), 1994, 199–206. H. Linstone & M. Turoff, The Delphi method: Techniques and applications (London, UK: Addison-Wesley, 1975). R. Hocking, Methods and applications of linear models: Regression and the analysis of variance (New York, NY: WileyIntercience, 2003). R. Jain, The art of computer systems performance analysis techniques for experimental design, measurement, simulation and modeling (New York, NY: John Wiley, 1991). E. Aranha, F. Almeida, T. Diniz, V. Fontes, et al. Automated test execution effort estimation based on functional test specifications, Tool Session of the 22nd Brazilian Symposium on Software Engineering (SBES 2008), Campinas, Brazil, 2008, 25–30. A. Pretschner, Model-based testing, 27th Int. Conf. on Software Engineering (ICSE 2005), St. Louis, MO, 2005, 722–723.
and model refactoring.
Biographies Eduardo Aranha obtained his doctoral degree in computing at the Federal University of Pernambuco in 2009. He is an assistant professor at the School of Sciences and Technology of the Federal University of Rio Grande do Norte. He has about 5 years industry experience as a software architect and project leader. In academia, he started teaching software engineering in 2002. His main research interests are empirical software engineering, software metrics, prediction models and software testing.
172