1418
IEEE Transactions on Ultrasonics, Ferroelectrics, and Frequency Control ,
vol. 57, no. 7,
July
2011
Estimating Material Elasticity by Spherical Indentation Load-Relaxation Tests on Viscoelastic Samples of Finite Thickness Bo Qiang, Member, IEEE, James Greenleaf, Fellow, IEEE, Michelle Oyen, and Xiaoming Zhang, Member, IEEE Abstract—A two-step viscoelastic spherical indentation method is proposed to compensate for 1) material relaxation and 2) sample thickness. In the first step, the indenter is moved at a constant speed and the reaction force is measured. In the second step, the indenter is held at a constant position and the relaxation response of the material is measured. Then the relaxation response is fit with a multi-exponential function which corresponds to a three-branch general Maxwell model. The relaxation modulus is derived by correcting the finite ramp time introduced in the first step. The proposed model takes into account the sample thickness, which is important for applications in which the sample thickness is less than ten times the indenter radius. The model is validated numerically by finite element simulations. Experiments are carried out on a 10% gelatin phantom and a chicken breast sample with the proposed method. The results for both the gelatin phantom and the chicken breast sample agree with the results obtained from a surface wave method. Both the finite element simulations and experimental results show improved elasticity estimations by incorporating the sample thickness into the model. The measured shear elasticities of the 10% gelatin sample are 6.79 and 6.93 kPa by the proposed finite indentation method at sample thickness of 40 and 20 mm, respectively. The elasticity of the same sample is estimated to be 6.53 kPa by the surface wave method. For the chicken breast sample, the shear elasticity is measured to be 4.51 and 5.17 kPa by the proposed indentation method at sample thickness of 40 and 20 mm, respectively. Its elasticity is measured by the surface wave method to be 4.14 kPa.
I. Introduction
T
issue viscoelasticity is an important biomarker for detecting the existence and severity of diseases such as cancer [1], [2] and systemic sclerosis (SSc) [3] and for monitoring physiological processes such as aging [4], [5]. Various techniques have been proposed for measuring tissue viscoelasticity. For example, magnetic resonance electrography (MRE) [6], [7] and vibro-acoustography [8], [9] monitor the shear wave propagation inside a tissue with magnetic resonance imaging (MRI) and ultrasound imaging, respectively. The viscoelasticity of the tissue can then
Manuscript received April 18, 2011; accepted April 29, 2011. This study was supported by a research career development award to X. Zhang by Mayo Clinic. B. Qiang, J. Greenleaf, and X. Zhang are with the Department of Physiology and Biomedical Engineering, Mayo Clinic College of Medicine, Rochester, MN (e-mail:
[email protected]). M. Oyen is with the Department of Engineering, University of Cambridge, Cambridge, UK. Digital Object Identifier 10.1109/TUFFC.2011.1961 0885–3010/$25.00
be estimated from the speed of the shear wave. Surface waves, which propagate on the superficial layer of a medium, have also been studied [10], [11]. The advantage of measuring surface waves over shear waves is that the surface waves can be monitored with noncontact methods, which is more clinically convenient. Ultrasound elastography uses ultrasound imaging to track the wave propagation [8], [9], [12], [13]. Compared with other imaging modalities such as MRI and computed tomography (CT), it features good portability and lowcost. In addition, modern ultrasound scanners can have much a higher frame rate (>2000 fps) [14] than MRI or CT; therefore, waves of higher frequency and multiple frequencies can be measured. In addition to measuring the speed of the shear wave and the surface wave, the tissue viscoelasticity can also be measured by indentation tests. An indentation test measures the mechanical properties of a material by analyzing the relationship between the indenter displacement and the reaction force. Commonly used axisymmetric indenters include flat punches [15], [16], spherical [15], [17]–[21], and conical profile [22] indenters. Spherical indenters introduce the least stress under the same indenter displacement among the three indenter types, so they bear the least risk of damaging the tissue sample [23]. However, unlike the flat punch indenters, the displacement-force relationship is nonlinear for spherical indenters because the contact area changes with the indenter displacement. Time independent indentation methods [15], [17]–[19] generally are valid only if the material is elastic. For most biological soft tissue types, the tissue viscosity can cause relaxation and the measured reaction force is smaller than predicted by theory. As a result, the elasticity measurement tends to be underestimated. In contrast, a time-dependent indentation test monitors the indentation response as a function of time to account for the relaxation of the sample material [16], [20], [22], [24]–[26]. For example, this can be done by pressing the sample with a cyclic force and the storage and loss modulus can be solved at the input frequency [26]. Then, the complex modulus can be derived. Another way to measure the time-dependent properties of a viscoelastic sample is to measure its relaxation [16], [21], [26] or creep response [16], [20], [26], by applying a sudden change of strain or stress, respectively. Then, the corresponding relaxation modulus or creep compliance can be derived by fitting the time response with an appropriate model. A creep
© 2011 IEEE
qiang et al.: estimating material elasticity by spherical indentation load-relaxation tests
test requires a constant force during the entire process, which is usually maintained by a feedback mechanism in the indentation instrument. In this study, a customized displacement-controlled indentation device is constructed to perform stress relaxation tests. A common model for fitting relaxation modulus or creep compliance is the generalized Maxwell model, which can be represented by the Prony series [20]–[22], [27]. Other constitutive models such as a standard solid model consisting of two springs and one dashpot [16], and fractional rheological models [28] are also studied in biomedical applications. In this study, generalized Maxwell model is used because it can be easily incorporated in a load-relaxation test. More details are discussed in Section II. For the aforementioned indentation methods, the sample geometry can affect their accuracy. A common assumption is that the sample has an infinite thickness [20], [21], [25], [29]–[31]. This assumption simplifies the relationship between the indenter displacement and the reaction force by ignoring the boundary conditions. However, this is only a good approximation if the radius of the indenter is small relative to the size of the sample. To keep this assumption valid, researchers have applied micrometer- or even nanometer-scale indenters [23]. However, such an approach increases the complexity and the cost of the indentation instrument because high precision is required to control small displacements and measure small forces. Another factor that must be considered is the indentation depth, because material linearity is only maintained when the indentation depth is small relative to the sample thickness. In [19], the authors suggest that indentation depth should be less than 10% of the sample thickness. The influence of the sample thickness has been thoroughly studied [15], [18], [19] in the time-independent indentation methods, especially in applications such as measuring the elasticity of cartilage [15], [32]. Several models have been proposed. For example, Waters proposed a modified form of the Hertzian contact equation for spherical indenters [18]. Dimitriadis et al., approximated the effects of sample thickness for spherical indentation by a Taylor expansion [19]. Hayes et al. analytically solved the differential equations for finite sample thickness contact problems for both flat punch and spherical indenters [15]. The objective of this paper is to study the influences of relaxation and sample thickness upon the elasticity estimation in spherical indentation. Examples of potential clinical applications include measuring the mechanical properties of cartilage or skin near bones, such as in fingers. Clinical adaptation of the proposed method is under development. In addition, using the proposed method, excised tissue samples can be tested. The proposed method can also serve as a validation tool for the wave propagation methods. This paper is structured as follows. A model that takes account of the sample thickness is proposed for the spherical indentation load-relaxation tests in Section II. In Section III, the proposed model is validated with finite element (FE) simulations and improvements are shown by
1419
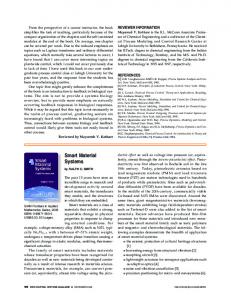
Fig. 1. Setup of spherical indentation. P is the reaction force on the indenter, R is the radius of the indenter, d is the thickness of the sample, h is the indenter displacement, and a is the contact radius.
incorporating the sample thickness. In Sections IV and V, a gelatin phantom and a chicken breast sample are tested experimentally with a customized indentation device. Shear elasticity measured by the proposed indentation method are compared with the results obtained from a surface wave method. Some of the technical aspects of the proposed model are discussed in Section VI, and Section VII draws conclusions for the study. II. Theory A. Elastic Spherical Indentation Models Fig. 1 shows the setup of the spherical indentation. Note that the lateral size of the sample is assumed to be infinite. If the thickness of the sample d, is large compared with the radius of the indenter R (d/R > 10) [19], [33], [34], the following equation can be used to describe the relationship between the reaction force P and the indenter displacement h [29]:
P =
8 Rh 3G . (1) 3(1 − ν)
Eq. (1) is the classical Hertzian contact equation, in which G and ν are the shear elasticity and Poisson’s ratio of the sample material, respectively. Note that the reaction force P increases nonlinearly with the indenter displacement h. This is because the contact radius R of the indenter changes with the indenter displacement h. For nearly incompressible materials such as soft tissue, the range of their Poisson’s ratio is 0.45 to 0.49, which can be approximated by 0.5. Therefore, for such materials, (1) can be further simplified to
P =
16 Rh 3G . (2) 3
In case an infinite model is no longer sufficient, the thickness of the sample must be considered. This especially seems necessary when d/R < 10 [19], [33], [34]. For such cases, the relationship between the reaction force P and
1420
IEEE Transactions on Ultrasonics, Ferroelectrics, and Frequency Control ,
vol. 57, no. 7,
July
2011
the indenter displacement h were investigated in several studies [15], [17]–[19]. In this paper, the Dimitriadis model for the bonded condition [19] is used, which is listed in (3), assuming an incompressible medium (ν ≈ 0.5):
P =
16G 3
Rh 3(1 + 1.133χ + 1.283χ 2 + 0.769χ 3 (3) Rh 4 + 0.0975χ ), χ = . d
Because the bottom of the sample is fixed to a rigid substrate for both the FE simulations in Section III and the experiments in Section IV, the bonded equation, which does not allow slipping between the sample and the substrate, is used in this study. Eq. (3) has been validated in applications such as measuring the mechanical properties of vinyl-alcohol gel samples [19], arteries [35], and muscle fibers [36]. The Dimitriadis model is compared with some other finite thickness models in Section VI. B. Load-Relaxation Test on Samples of Infinite Thickness The creep and relaxation response of a material can be used for measuring its viscoelastic properties. Oyen et al. proposed a creep procedure for force-controlled experiments [20] and Mattice et al. proposed a relaxation method for displacement-controlled experiments [21]. Both methods are designed for viscoelastic materials. In this paper, we adapt the load-relaxation method proposed in [21]. The advantage of using the relaxation response is that the indenter displacement can be easily controlled and modified in our experimental setup, which will be discussed in Section IV-A. Fig. 2 shows the procedure for performing a load-relaxation experiment. In the first step, a constant speed is prescribed to the indenter. One can see that the reaction force increases faster as the indenter displacement increases. This is because the contact area also increases as the indenter is pressed against the sample. Note that the indentation displacement h is a piecewise function of time t,
h(t) =
{ktkt
R
t ≤ tR (4) = h max t R < t ≤ t T,
where k is the indenter speed. In the second step, the indenter is held in position, and the stress relaxation response of the sample is monitored. In this step, the reaction force can be modeled as a summation of exponentially decaying functions, 3
P(t) = B 0 +
∑ B ie −t/τ , i
3
∑C ie i =1
−t /τ i
, (6)
Ci =
Bi , β ih max(8 R/3)
i = 0, 1, 2, 3. (7)
βi is the ramp correction factor, which arises from the finite ramp time of an actual experiment. For a relaxation test with a spherical indenter, there is no closed-form analytical solution for βi. However, from the analogy of the creep test [20], βi can be approximated by
i = 0, 1 β i = τ i −t R/τ i (8) (e − 1) i > 0, t R
where tR is the total ramping time. The instantaneous shear elasticity G of the material can be calculated by
Then, the relaxation modulus G(t) can be expressed as G(t) = C 0 +
where
B 0, B i, τ i ≥ 0. (5)
i =1
Fig. 2. The indenter displacement profile and the reaction force history of a load-relaxation test. In the load (ramp) step, the indenter is pressed onto the sample at a constant speed. In this step, the reaction force also increases until the indenter reaches the maximum displacement at tR. In the relaxation (hold) step, the indenter is held at a constant position while the reaction force is monitored. In this stage, the reaction force decreases exponentially. hmax is the maximum indenter displacement at ramp time tR and tT is the total test time.
1 1 G = G(0) = 2 2
3
∑C i. (9) i =0
The factor of 2 arises from the ratio between the deviatory components of the stress, strain tensor, and the shear modulus [24]. By applying the Boltzmann integral
qiang et al.: estimating material elasticity by spherical indentation load-relaxation tests
1421
in linear viscoelastic materials, the reaction force P(t) can be related to the relaxation modulus G(t), the indenter radius R, and the indenter speed k by [21], [24], t
P(t) =
∫ G(t − u) du (
)
d 8 R h(u) 3/2 du 3
0
t 3 Rk G(t − u)u 1/2 du, t ≤ t R, (10) 4 0 = tR 4 Rk 3 G(t − u)u 1/2 du, t > t R. 0
∫
∫
In this paper, this integral is evaluated numerically by an adaptive Lobatto quadrature algorithm [37]. C. Load-Relaxation Model With Finite Sample Thickness The aforementioned load-relaxation model does not take the thickness of the testing sample into account. To incorporate the sample thickness into the load-relaxation model, the strain function A = (8R1/2/3)h(u) in (7) and (10) should be replaced with its counterpart in the finite thickness models in (3). Let’s define
A(t) =
8 3
Rh 3(1 + 1.133χ + 1.283χ 2 + 0.769χ 3 4
+ 0.0975χ ),
χ=
Rh . d
(11)
Then (7) and (10) become Ci =
t
P(t) =
Bi (12) β iA(t R) d
∫ G(t − u) du A(u) du. (13) 0
Note that to calculate reaction force P(t) using (13), the time derivative of A, dA/dt, must be numerically evaluated. In this paper, the following center difference approximation is used for its second-order accuracy [38]:
dA A(t + ∆t) − A(t − ∆t) ≈ . (14) dt 2∆t
Fig. 3. Axisymmetric finite element model for validating the proposed finite indentation method. The sample width w is 20 times the size of the indenter radius R to reduce the boundary effects from the lateral dimension. Sample thickness d is a variable and its effects are studied in the current paper. The sample part is partitioned and meshed so that region 1, which is in contact with the indenter, is meshed more finely than the rest of the sample (region 2) to reduce the computational cost. The indenter is modeled as an analytical surface and the sample is meshed with 3-node linear axisymmetric triangles, CAX3 in Abaqus.
have been conducted in Abaqus CAE (version 6.8, Simulia Corp., Providence, RI). The indenter-sample assembly is configured as an axisymmetric model as shown in Fig. 3. The radius of the indenter R is set to be 1 mm and its moving speed is set at 0.1 mm/s. The size of the indenter was chosen to simplify the calculation of the dimensions and indenter moving speed matches the experimental value shown in Section IV. In all simulations, the indentation depth is kept at 0.5 mm. The radius of the cylindrical sample is 20 mm, to eliminate the boundary effects from the lateral dimension of the sample [33]. In addition, the sample is assumed to have a fixed bottom boundary condition. Its material mass density, ρ, and Poisson’s ratio, ν, are 1000 kg/m3 and 0.49, respectively. The shear elasticity G of the sample material is 6.75 kPa. Other material properties are listed in Table I.
The value of time step Δt is chosen to be 0.001 s. Numerical experiments show that the choice of Δt does not affect the results as long as it is smaller than 0.01 s.
TABLE I. Material Properties Used in Finite Element Simulations. I
τi (s)
Ci (kPa)
G (kPa)
ν
ρ (kg/m3)
— 1 10 20
6.00 6.00 1.00 0.50
6.75
0.49
1000
A. FE Modeling
0 1 2 3
To evaluate the performance of the proposed method, FE simulations of the proposed load-relaxation method
τi and Ci are defined in (6). The instantaneous shear modulus, G, is calculated using (9). ν and ρ are the Poisson’s ratio and mass density, respectively.
III. Finite Element Simulation
1422
IEEE Transactions on Ultrasonics, Ferroelectrics, and Frequency Control ,
vol. 57, no. 7,
July
2011
The indenter is modeled as an analytical surface and the sample is partitioned and meshed with the following strategy. To reduce the computation time and ensure the accuracy of the simulations, a 2 × 2 mm square region (region 1 in Fig. 3) is partitioned from the sample part and it is meshed uniformly by elements smaller than the rest of the sample (region 2 in Fig. 3). The rest of the sample is meshed so that the size of the elements gradually increases moving away from the indentation region. At the edges where the two regions touch, the sizes of the meshing elements match. Both regions of the sample part are meshed with 3-node linear axisymmetric triangles, CAX3 in Abaqus. For each simulation, a coarse mesh is used first and then a finer mesh is tested. This procedure is repeated until the simulation result converges. B. Simulations With Variable Sample Thickness A series of simulations with differing sample thicknesses d = 30, 20, 10, 7, 5, and 2 mm, are conducted. Fig. 4 compares the FE simulated results, the proposed finite model, and the infinite model, at the largest (30 mm) and smallest (2 mm) sample thickness. Figs. 4(a) and 4(b) show that when the sample thickness is 30 times the size of the indenter radius, the load-relaxation curves predicted by both models are close to the FE simulated result. However, when the d/R ratio decreases to 2, the infinite model underestimates the reaction force by roughly 30% during the relaxation step, whereas the proposed finite model is still close to the FE simulated result. Figs. 4(c) and 4(d) show the stress distribution at time tR(5 s) for d = 30 mm and d = 2 mm, respectively. One can see that samples with decreased thickness have elevated internal stress. Fig. 5 shows the shear modulus G estimated by the two methods at the six different sample thicknesses. Table II lists the values that are shown in Fig. 5. One can observe that when d/R is greater than 20, the relative errors for both methods are less than 10%. But when d/R is between 5 and 10, the relative error for the infinite model is 11 to 16%, whereas the finite model remains at around 5%. The largest relative error occurs when the sample thickness is only 2 times the size of the indenter radius. In this case, the error for infinite model is 68% compared with only 17% for the proposed finite thickness method. These results show that the proposed finite thickness method improves the accuracy of the shear elasticity estimation, especially when d/R < 10. There are still some residual errors, especially when d/R is small. These errors could come from (8) and (11), because they are not analytical solutions but approximations [19], [20]. Another possible source for the error is the numerical errors associated with the FE simulations. For comparison, Table II also lists the elasticity estimations predicted by (3), which is the finite elastic Dimitriadis model. The calculations are based on the ramp stage of the load-relaxation tests. Because this finite elastic model doesn’t consider the relaxation phenomenon in a viscous medium, there are large disagreements between the pre-
Fig. 4. (a) and (b): The finite element simulated load-relaxation curves (circles) compared with the proposed finite load-relaxation model (squares) and the infinite load-relaxation model (asterisks). (a) d = 30 mm; (b) d = 2 mm. The indenter radius R is 1 mm. When d/R = 30 (a), both models match the finite element simulation. But when d/R = 2 (b), the infinite model underestimates the reaction force by roughly 30% during the relaxation step, whereas the proposed finite model remains close to the finite element simulation. (c) and (d): Stress distribution of the FE simulations for both situations at tR. The same color map is applied to (c) and (d).
dictions and the real values. As shown in Table II, this method underestimates the sample elasticity for about 40% for the FE simulated results. IV. Experiment A. Experiment Setup A customized indentation system is constructed as shown in Fig. 6. A stepper motor (Model M061-FD08E, Superior Electric Inc., Farmington, CT) drives a load cell (Model ULC-1N, Interface Inc., Scottsdale, AZ) in the vertical direction. An R = 4 mm spherical indenter is mounted on the bottom end of the load cell. The stepper motor is driven by a motor driver (Model MD125, Oregon Micro System Inc., Irvine, CA) and the output signal from the load cell is digitized by an analog-to-digital (A/D) converter (Model ADS1232REF, Texas Instruments Inc., Dallas, TX), which samples the input at 80 points/second. The motor driver and the A/D converter are connected to a computer via USB connections. The system is controlled by a customized software package written in C and Matlab (Version 2009b, Mathworks Inc., Natick, MA). The indentation depth is controlled to be about 1 mm and the
qiang et al.: estimating material elasticity by spherical indentation load-relaxation tests
1423
TABLE II. Shear Elasticity G Predicted by the Proposed Finite Load-Relaxation Model, the Infinite Load-Relaxation Model, and the Finite Elastic Model as Shown in (3), Based on Finite Element Modeling Simulated Load-Relaxation Curves. Finite load-relaxation (proposed method) d (mm) 30 20 10 7 5 2
Infinite load-relaxation
Finite elastic
G (kPa)
Error (%)
G (kPa)
Error (%)
G (kPa)
Error (%)
6.95 7.07 7.09 7.16 6.93 7.93
2.96 4.74 5.04 6.07 2.67 17.48
7.10 7.30 7.57 7.86 7.53 11.32
5.19 8.15 12.15 16.44 11.56 67.70
4.23 4.17 4.09 4.04 4.94 4.00
−37.33 −38.22 −39.41 −40.15 −26.81 −40.74
The true value of the instantaneous shear elasticity G is 6.75 kPa.
Fig. 6. The experiment setup for spherical load-relaxation indentation. a: stepper motor, b: load cell, c: spherical indenter (R = 4 mm), d: sample, e: motor driver, f: analog-to-digital converter, g: computer.
speed of the indenter movement is set at 0.1 mm/s. The indentation depth is selected so that is relatively small compared with the thickness of the sample (40 mm and 20 mm). The speed of the indenter movement is discussed in detail in Section VI-F. B. Sample Preparation
Fig. 5. (a) The shear elasticity G estimated by the proposed finite methods (square) compared with the infinite model (asterisk) and the true value (dotted line). (b) The absolute values of the relative errors (zero represents no error).
Two different samples are tested in this study: a 10% gelatin phantom and a chicken breast muscle sample. Gelatin phantoms are, in general, considered to be elastic and the shear elasticity of a 10% gelatin phantom is in the 5 to 10 kPa range [10], in a similar range as normal human skin (7 to 15 kPa) [26]. The shear viscosity of gelatin phantoms is typically less than 2 Pa⋅s [10], [39]. The chicken breast sample represents a tissue type that is more viscous than the gelatin phantoms. The viscoelasticity of bovine and porcine skeletal muscles have been measured by shear-wave dispersion ultrasound vibrometry (SDUV) [13], [40], [41]. In these studies, the estimated shear elasticity and viscosity are 5 to 29 kPa and 1.1 to 9.9 Pa·s, respectively.
1424
IEEE Transactions on Ultrasonics, Ferroelectrics, and Frequency Control ,
The sample thickness is adjusted by carefully cutting part of the sample off from the bottom. To ensure the nonslipping condition that (3) requires, the bottoms of the samples are glued to an aluminum substrate. Other than the two previously mentioned phantoms, more material types and sample thicknesses can be tested to further validate the proposed method. However, the main purpose of this paper is to introduce an application using spherical indentation and the Dimitriadis model on viscoelastic materials. A more systemic validation study can be carried out with samples of variable shear elasticity G, shear viscosity η, and thickness d. 1) 10% Gelatin Phantom: A 10% gelatin phantom (measured by volume) is fabricated using porcine skin gelatin powder (Type G2500, Sigma-Aldrich Inc., St. Louis, MO); 1 g/L of scatters with mean diameter of 20 μm (Type S3504, Sigma-Aldrich Inc.) are embedded to improve the RF echoes of the ultrasound measurements. The size and material of the scatterers are selected so that the scatterers are uniformly suspended in the gelatin solution during the curing process. 5 g/L of potassium sorbate (Type 359769, Sigma-Aldrich Inc.) is added as an antibacterial preservative. The phantom measures 14 × 14 × 4 cm and its mass density and Poisson’s ratio are assumed to be 1000 kg/m3 and 0.49, respectively, because of its major proportion of water. For details regarding the procedure for making the gelatin phantom, please refer to [42]. After the gelatin phantom is measured by both the indentation and surface wave methods, its thickness is reduced to 20 mm by cutting half of the thickness off from the bottom. Then, indentation tests are carried out again. Material properties are assumed to remain the same after the thickness is adjusted. During the experiments, the bottom of the gelatin phantom is glued to an aluminum substrate to satisfy the non-slipping boundary condition of (3). 2) Chicken Breast Sample: A chicken breast muscle sample, measuring roughly 14 × 8 × 4 cm, was prepared. The same procedures as the gelatin phantom are followed to adjust its thickness and ensure the non-slipping boundary condition. Although the lateral shape of the sample is irregular, its thickness is estimated to vary within 10% in the region of interest before and after its thickness is reduced. The sample was purchased fresh from a local butcher store and the sample was refrigerated until experiments were conducted on the day after purchase. Mass density (1000 kg/ m3) and Poisson’s ratio (0.49) are assumed. C. Reference Method Independent measurements are made by a surface wave method that is discussed in detail in [42]. The speed of the surface wave is measured at 100 to 350 Hz with 25 Hz separations for both of the gelatin phantom and the chicken breast sample. The peak-to-peak amplitude of the motion at the source is around 1 mm. The frequency
vol. 57, no. 7,
July
2011
range and separation are selected so that the reflections are minimized at low frequency and the R2 value is greater than 0.90 for the linear regression between the phase delay and the distance. The surface wave was generated by an electromagnetic shaker (Model 203, LDS Test and Measurements Inc., Royston, UK), which excites the sample using a ball tip that is 8 mm in diameter. The duration of the excitation is 100 ms, so that most reflections from the boundaries are excluded from the data collection window. The surface wave is measured by an ultrasound system (SonixRP, Ultrasonix Corporation, Richmond, BC, Canada) using a 7.2-MHz probe (L14–5/38, Ultrasonix Corporation). The shear elasticity and viscosity are resolved by fitting the speeds of the surface wave at multiple frequencies with a Voigt model [10], [42]. There are other linear viscoelastic models used for describing the wave speed dispersion, such as a Maxwell model, which consists of a spring and a dashpot connected in parallel. In [39], these two models were compared and the Voigt model was found to perform better, especially when attenuation is considered. More sophisticated models, for example, a standard linear model [16], could be used. However, that involves fitting the wave dispersion curve with more than two parameters. To simplify the problem, the Voigt model is used in this study. Both the gelatin and chicken breast sample were only tested with the surface wave method at their original thickness (40 mm), so that the results are less affected by the boundary conditions than testing after the sample thickness is adjusted. V. Results A. 10% Gelatin Phantom A measurement from a load-relaxation test for the 10% gelatin phantom is shown in Figs. 7(a) and 7(b) and a surface wave speed dispersion fit is shown in Fig. 8(a). One can see from Fig. 7(a) that the total percentage of relaxation for the gelatin phantom is [P(tR) – P(tT)]/P(tT) = 10.60%. In Fig. 8(a), a limited amount of dispersion is observed and the estimated shear viscosity η is only 0.74 Pa·s, which is expected, because gelatin is highly elastic. As shown in Table III, the average shear elasticity of 5 independent measurements is 6.53 kPa by the surface wave method; using the proposed finite load-relaxation method, the value was 6.79 and 6.93 kPa for sample thicknesses of 40 and 20 mm, respectively. Table III also shows the elasticity estimation based on the finite elastic model of (3). One can see that it is within 15% relative difference of both the load-relaxation measurements and surface wave measurements. This is because the gelatin is very elastic. B. Chicken Breast Sample Figs. 7(c) and 7(d) shows the load-relaxation fit for the chicken breast sample. The total percentage of relaxation
qiang et al.: estimating material elasticity by spherical indentation load-relaxation tests
1425
Fig. 7. (a) and (b): Relaxation fit and overall load-relaxation fit of the 10% gelatin. (c) and (d): Relaxation fit and overall load-relaxation fit of the chicken breast sample. Both samples are at their original thickness (40 mm). The two solid vertical lines in (b) and (d) represent the start and stop points of the indenter, respectively. All calculations are based on the proposed finite model. The measured shear elasticity G is 6.44 ± 0.19 kPa for the 10% gelatin phantom and 3.88 ± 0.32 kPa for the chicken breast sample, both in mean ± standard error format.
is 65.38%, which is 6 times larger than that in the gelatin phantom (10.60%), showing it has more shear viscosity η and experiences more relaxation than the gelatin. The average shear elasticity G of 5 independent measurements using the proposed finite load-relaxation method is 4.51 and 5.17 kPa for sample thicknesses of 40 and 20 mm, respectively. Fig. 8(b) shows a surface speed dispersion curve measured by the ultrasound system. One can see that the surface wave is much more dispersive in the chicken breast sample than in the gelatin phantom. A Voigt model fit predicts that its shear viscosity η is 3.64 Pa·s,
about 5 times that of the gelatin phantom (0.74 Pa·s). Generally, muscle tissues are considered to be anisotropic because muscle fibers are directional. In this study, restricted by the geometry of the chicken breast sample, the surface wave experiment is only conducted along the fiber direction. The impact of the orientation of the muscle fibers on the measurements will be discussed in the next section. From Table III, one can also observe that the elasticity estimation based on the finite elastic model (3) underestimates the elasticity by more than 30% because of relaxation.
TABLE III. Shear Elasticity G Measured by the Surface Wave Method, the Proposed Finite Load-Relaxation Model, The Infinite Load-Relaxation Model, and the Finite Elastic Model as Shown in (3). Indentation Finite load-relaxation (proposed method)
Surface wave Sample
n
Gelatin
5 6.53 ± 0.04
G (kPa)
Chicken breast
5 4.14 ± 0.24
d (mm) 40 20 40 20
hmax (mm) 0.96 0.96 0.91 0.85
± ± ± ±
0.04 0.22 0.11 0.21
n 5 5 5 5
G (kPa) 6.79 6.93 4.51 5.17
± ± ± ±
0.22 0.42 0.55 0.82
Δ% 3.98 6.13 8.94 24.88
Infinite load-relaxation G (kPa) 7.19 7.34 4.66 5.66
± ± ± ±
0.22 0.41 0.56 1.06
Δ% 10.11 12.40 12.56 36.71
Finite elastic G (kPa) 6.11 5.83 2.58 2.75
± ± ± ±
0.15 0.41 0.44 0.27
Δ% −6.43 −10.72 −37.68 −33.57
G and hmax are in mean ± standard deviation format. Other parameters listed in the table are sample thickness d, number of measurements n, and indentation depth hmax.
1426
IEEE Transactions on Ultrasonics, Ferroelectrics, and Frequency Control ,
vol. 57, no. 7,
July
2011
proximates displacement-force relation by a Taylor expansion [19]. Like the Dimitriadis model, the Waters model is also an approximation. A comparison between the Waters model and the Dimitriadis model shows that the Waters model tends to perform worse than the Dimitriadis model in the load-relaxation tests, especially when d/R < 5. For example, for a FE simulated data set at d/R = 2, the Waters model produces 55.10% relative error compared with 17.48% for the Dimitriadis model, as shown in Fig. 5 and Table II. The Hayes model is widely used for applications like measuring the elasticity of cartilage [32] and studying the nonlinearity of indentation [43]. It takes the sample thickness d into account by multiplying (2) with a correction factor κ. The advantage of the Hayes model is that it is an analytical solution for spherical indentation [15]. However, to apply the Hayes model, the contact radius a and the correction factor κ should be calculated for each different indenter displacement h by solving a pair of second-order Fredholm integral equations. Such equations can be split into a group of linear equations by evaluating the kernel functions at equally-spaced data points inside the integration limits. The technical details have been discussed in studies such as [42], [44]. Although possible, this requires intensive floating-point computations and the result is subject to numerical errors during the evaluation of numerical integrations. A different approach to implementing the Hayes model has been discussed in [17], which substitutes the integral with a finite series and a closed-form converging solution may be obtained. B. Boundary Conditions
Fig. 8. The surface wave speed dispersion measured by ultrasound for (a) the 10% gelatin phantom and (b) the chicken breast sample. The error bars represent the standard errors for the speed estimations at each frequency. Both samples are at their original thickness (40 mm). A nonlinear fitting method is used to derive the shear elasticity G and shear viscosity η. For the 10% gelatin phantom, G = 6.14 ± 0.11 kPa, η = 0.74 ± 0.09 Pa⋅s. For the chicken breast sample, G = 4.36 ± 1.66 kPa, η = 3.64 ± 0.50 Pa⋅s. All results are in mean ± standard error format.
Table III also shows that, compared with the gelatin phantom, the chicken breast sample has much larger standard deviations for both the surface wave and the indentation methods. This is expected to be associated with the fact that the chicken breast sample is heterogeneous, anisotropic, and has an irregular shape. VI. Discussion A. Choice of Elastic Model There are other finite thickness elastic models, such as the Waters [18] and Hayes [15] models, and they can also be incorporated into (11)–(13). The Dimitriadis model ap-
This study focuses on investigating the influence of the sample thickness on the time-dependent indentation tests. However, the lateral dimension of the sample can also alter the results. To the authors’ knowledge, no rigorous models have been developed to account for the lateral dimension of the sample. In [33], the impact of the lateral dimension was studied by FE simulations and the results suggested that the lateral dimension of the sample must be at least 20 times the radius of the flat punch indenter to ignore its effects on the elasticity measurements. In this study, the sample of the FE simulations has a radius 20 times the radius of the indenter. However, neither the gelatin phantom nor the chicken breast sample is large enough to meet this criterion. Although the experimental results show an agreement between the indentation tests and the surface wave experiments, more studies must be done to quantify the impact of the lateral size of the sample. In this study, the surface wave method is used to validate the proposed indentation method. However, because the surface wave method assumes an infinite medium, the elasticity measurements might be biased. To the authors’ knowledge, currently there are no models developed to compensate for this bias. A series of FE simulations of surface wave propagation have been carried out and the
qiang et al.: estimating material elasticity by spherical indentation load-relaxation tests
1427
results show that for G = 10 and 4 kPa, the surface wave speed increases by only 0.2% and 0.05%, respectively, when the sample thickness changes from 5 to 10 cm. The frequency of the excitation is 100 Hz and the peak-topeak amplitude of the source is 1 mm.
their physical meanings. Methods such as that in [27] have been proposed to implement additional constraints on the regression to ensure that Bi are positive.
C. Orientation of Muscle Fibers
In this study, the loading speed of the indenter is assumed to be constant during the ramp stage, and its speed changes to zero instantaneously at time tR. In reality, this cannot happen because of inertia. In the experiments, the speed of the indenter movement is quite small (0.1 mm/s), so the deceleration of the indenter near tR is also small and its effect is assumed to be negligible. The indenter speed (0.1 mm/s) was selected as the optimized value through a series of tests on uniform phantoms so that the system produces the most consistent results. The acceleration at the beginning of the indentation test is minimized by a significant initial offset (>1 mm) between the indenter tip and the sample surface. Therefore by the time the indenter reaches the surface of the sample, its speed can be regarded as a constant.
The direction of the muscle fibers is important when measuring the muscle’s mechanical properties [13]. In this study, the surface waves are measured along the direction of the muscle fibers in the chicken breast sample. Surface wave measurements across the fiber direction have been tried but failed to produce consistent results because of the limited lateral size and irregular shape of the chicken breast sample. Indeed, indentation with a spherical tip has mixed effects from the acrossand along-fiber moduli. However, chicken breast muscles are softer [40], [41] and the fiber bundle size tends to be smaller than that of bovine and porcine skeletal muscles. In addition, the outer membrane around the chicken breast sample makes it more uniform. The results shown in Table III also suggest the consistency between the indentation method and surface wave method. Further studies of indentation models on anisotropic materials are of interest. D. Tissue Viscosity η Measurement From the LoadRelaxation Test The main purpose of this study is to take into account the material relaxation while performing an indentation test in viscous materials such as soft biological tissues. However, a direct derivation of shear viscosity η from the load-relaxation test seems challenging. To compare the results from the indentation test and the surface wave test, one possibility is to convert both results into a complex modulus [45]. However, this would require accurate measurement of the attenuation of the propagation surface wave, which is difficult in muscle because of the material’s heterogeneity. E. Solution Uniqueness in Fitting the Relaxation Curves The nonlinear fitting between the time and the reaction force during material relaxation with (5) seems to have multiple solutions and its result is dependent upon the initial guesses. However, although the individual time constants τi and the coefficients Bi are not consistent for fits with different initial guesses, the shear elasticity G usually remains relatively stable because G is calculated as the summation of the Ci parameters, as shown in (9). An alternative method for the nonlinear fitting is that one can fix the time constants τi with predefined values, turning (9) into a linear equation about the coefficient Bi. This way, a unique solution to (9) exists in the least-square sense. One potential problem with this method is that the fitted coefficients Bi maybe negative, which is contrary to
F. Assumption About the Constant Loading Speed
VII. Conclusions A load-relaxation spherical indentation method was proposed to improve estimation of elasticity of viscoelastic materials. Further improvement was obtained by considering the sample thickness. The two-step model was validated by finite element simulations. The simulation results showed that with the sample thickness considered, the accuracy of the shear elasticity estimation was improved, especially when the sample thickness was less than 10 times the radius of the indenter. A customized indentation device was constructed and the proposed finite load-relaxation tests were carried out on a 10% gelatin phantom and a chicken breast muscle sample. The results from the indentation tests were compared with the results from a surface wave method. The comparisons showed that the proposed method produces closer shear elasticity measurements than the infinite load-relaxation model. The results also showed that the finite elastic model can provide reasonable estimation of the elastic gelatin phantom, but cannot estimate elasticity for the viscoelastic chicken breast sample. On the other hand, the finite loadrelaxation model can provide reasonable estimation of elasticity of the chicken breast sample. Acknowledgments The authors would like to extend their thanks to R. Kinnick for his support on hardware development and to S. Mitchell for his input on FE modeling. References [1] J. F. Greenleaf, M. Fatemi, and M. Insana, “Selected methods for imaging elastic properties of biological tissues,” Annu. Rev. Biomed. Eng., vol. 5, pp. 57–78, 2003.
1428
IEEE Transactions on Ultrasonics, Ferroelectrics, and Frequency Control ,
[2] Y. Qiu, M. Sridhar, J. K. Tsou, K. K. Lindfors, and M. F. Insana, “Ultrasonic viscoelasticity imaging of nonpalpable breast tumors: Preliminary results,” Acad. Radiol., vol. 15, pp. 1526–1533, Dec. 2008. [3] H. P. Dobrev, “In vivo study of skin mechanical properties in patients with systemic sclerosis,” J. Am. Acad. Dermatol., vol. 40, pp. 436–442, Mar. 1999. [4] C. Flynn and B. A. McCormack, “Simulating the wrinkling and aging of skin with a multi-layer finite element model,” J. Biomech., vol. 43, pp. 442–448, Feb. 10, 2010. [5] I. Sack, B. Beierbach, J. Wuerfel, D. Klatt, U. Hamhaber, S. Papazoglou, P. Martus, and J. Braun, “The impact of aging and gender on brain viscoelasticity,” Neuroimage, vol. 46, pp. 652–657, Jul. 1, 2009. [6] L. Huwart and B. E. van Beers, “MR elastography,” Gastroenterol. Clin. Biol., vol. 32, pp. 68–72, Sep. 2008. [7] R. Muthupillai and R. L. Ehman, “Magnetic resonance elastography,” Nat. Med., vol. 2, pp. 601–603, May 1996. [8] M. Fatemi and J. F. Greenleaf, “Vibro-acoustography: An imaging modality based on ultrasound-stimulated acoustic emission,” Proc. Natl. Acad. Sci. USA, vol. 96, pp. 6603–6608, Jun. 8, 1999. [9] M. Fatemi and J. F. Greenleaf, “Ultrasound-stimulated vibro-acoustic spectrography,” Science, vol. 280, pp. 82–85, Apr. 3, 1998. [10] B. Qiang, J. Greenleaf, and X. Zhang, “Quantifying viscoelasticity of gelatin phantoms by measuring impulse response using compact optical sensors,” IEEE Trans. Ultrason. Ferroelectr. Freq. Control, vol. 57, pp. 1696–1700, Jul. 2010. [11] X. Zhang and J. F. Greenleaf, “Estimation of tissue’s elasticity with surface wave speed,” J. Acoust. Soc. Am., vol. 122, pp. 2522–2525, Nov. 2007. [12] V. V. Kazakov and B. N. Klochkov, “Low frequency mechanical properties of the soft tissue of the human arm,” Biophysics, vol. 34, pp. 742–747, 1989. [13] S. Chen, M. W. Urban, C. Pislaru, R. Kinnick, Y. Zheng, A. Yao, and J. F. Greenleaf, “Shearwave dispersion ultrasound vibrometry (SDUV) for measuring tissue elasticity and viscosity,” IEEE Trans. Ultrason. Ferroelectr. Freq. Control, vol. 56, pp. 55–62, Jan. 2009. [14] J. Bercoff, M. Tanter, and M. Fink, “Supersonic shear imaging: A new technique for soft tissue elasticity mapping,” IEEE Trans. Ultrason. Ferroelectr. Freq. Control, vol. 51, pp. 396–409, Apr. 2004. [15] W. C. Hayes, L. M. Keer, G. Herrmann, and L. F. Mockros, “A mathematical analysis for indentation tests of articular cartilage,” J. Biomech., vol. 5, pp. 541–551, Sep. 1972. [16] L. Cheng, X. Xia, W. Yu, L. E. Scriven, and W. W. Gerberich, “Flat-punch indentation of viscoelastic material,” J. Polym. Sci., B, vol. 38, pp. 10–22, Jan. 2000. [17] M. Sakamoto, G. Li, T. Hara, and E. Y. S. Chao, “A new method for theoretical analysis of static indentation test,” J. Biomech., vol. 29, pp. 679–685, May 1996. [18] N. E. Waters, “The indentation of thin rubber sheets by cylindrical indentors,” Br. J. Appl. Phys., vol. 16, no. 9, p. 1387 1965. [19] E. K. Dimitriadis, F. Horkay, J. Maresca, B. Kachar, and R. S. Chadwick, “Determination of elastic moduli of thin layers of soft material using the atomic force microscope,” Biophys. J., vol. 82, pp. 2798–2810, May 2002. [20] M. L. Oyen, “Spherical indentation creep following ramp loading,” J. Mater. Res., vol. 20, no. 8, pp. 2094–2100, 2005. [21] J. M. Mattice, A. G. Lau, M. L. Oyen, and R. W. Kent, “Spherical indentation load-relaxation of soft biological tissues,” J. Mater. Res., vol. 21, no. 8, pp. 2003–2010, 2006. [22] M. Sakai, “Time-dependent viscoelastic relation between load and penetration for an axisymmetric indenter,” Philos. Mag. A, vol. 82, no. 10, pp. 1841–1849, 2002. [23] D. M. Ebenstein and L. A. Pruitt, “Nanoindentation of biological materials,” Nano Today, vol. 1, pp. 26–33, Aug. 2006. [24] M. L. Oyen, “Analytical techniques for indentation of viscoelastic materials,” Philos. Mag., vol. 86, pp. 5625–5641, 2006. [25] L. Cheng, X. Xia, L. E. Scriven, and W. W. Gerberich, “Sphericaltip indentation of viscoelastic material,” Mech. Mater., vol. 37, pp. 213–226, Jan. 2005. [26] G. Boyer, L. Laquieze, A. Le Bot, S. Laquieze, and H. Zahouani, “Dynamic indentation on human skin in vivo: Ageing effects,” Skin Res. Technol., vol. 15, pp. 55–67, Feb. 2009. [27] R. D. Bradshaw and L. C. Brinson, “A sign control method for fitting and interconverting material functions for linearly viscoelastic solids,” Mech. Time-Depend. Mater., vol. 1, no. 1, pp. 85–108, 1997. [28] C. Coussot, S. Kalyanam, R. Yapp, and M. F. Insana, “Fractional derivative models for ultrasonic characterization of polymer and
vol. 57, no. 7,
July
2011
breast tissue viscoelasticity,” IEEE Trans. Ultrason. Ferroelectr. Freq. Control, vol. 56, pp. 715–726, Apr. 2009. [29] A. C. Fischer-Cripps, “Elastic contact,” in Introduction to Contact Mechanics, 2nd ed., New York, NY: Springer, 2007, ch. 6, pp. 101– 114. [30] C. Pailler-Mattéi and H. Zahouani, “Analysis of adhesive behaviour of human skin in vivo by an indentation test,” Tribol. Int., vol. 39, no. 1, pp. 12–21, 2006. [31] C. Pailler-Mattei, S. Bec, and H. Zahouani, “In vivo measurements of the elastic mechanical properties of human skin by indentation tests,” Med. Eng. Phys., vol. 30, pp. 599–606, Jun. 2008. [32] M. M. Hyttinen, J. Toyras, T. Lapvetelainen, J. Lindblom, D. J. Prockop, S. W. Li, M. Arita, J. S. Jurvelin, and H. J. Helminen, “Inactivation of one allele of the type II collagen gene alters the collagen network in murine articular cartilage and makes cartilage softer,” Ann. Rheum. Dis., vol. 60, pp. 262–268, Mar. 2001. [33] L. Zhai, M. L. Palmeri, R. R. Bouchard, R. W. Nightingale, and K. R. Nightingale, “An integrated indenter-ARFI imaging system for tissue stiffness quantification,” Ultrason. Imaging, vol. 30, pp. 95–111, Apr. 2008. [34] Y. Yang, P. O. Bagnaninchi, M. Ahearne, R. K. Wang, and K. K. Liu, “A novel optical coherence tomography-based micro-indentation technique for mechanical characterization of hydrogels,” J. R. Soc. Interface, vol. 4, pp. 1169–1173, Dec. 22, 2007. [35] A. J. Engler, L. Richert, J. Y. Wong, C. Picart, and D. E. Discher, “Surface probe measurements of the elasticity of sectioned tissue, thin gels and polyelectrolyte multilayer films: Correlations between substrate stiffness and cell adhesion,” Surf. Sci., vol. 570, no. 1–2, pp. 142–154, 2004. [36] J. M. Goffin, P. Pittet, G. Csucs, J. W. Lussi, J. J. Meister, and B. Hinz, “Focal adhesion size controls tension-dependent recruitment of alpha-smooth muscle actin to stress fibers,” J. Cell Biol., vol. 172, pp. 259–268, Jan. 16, 2006. [37] W. Gander and W. Gautschi, “Adaptive quadrature—Revisited,” BIT Numerical Mathematics, vol. 40, pp. 84–101, 2000. [38] G. Strang, Computational Science and Engineering. Wellesley, MA: Wellesley-Cambridge Press, 2007. [39] S. Catheline, J. L. Gennisson, G. Delon, M. Fink, R. Sinkus, S. Abouelkaram, and J. Culioli, “Measuring of viscoelastic properties of homogeneous soft solid using transient elastography: An inverse problem approach,” J. Acoust. Soc. Am., vol. 116, pp. 3734–3741, Dec. 2004. [40] M. W. Urban and J. F. Greenleaf, “A Kramers-Kronig-based quality factor for shear wave propagation in soft tissue,” Phys. Med. Biol., vol. 54, pp. 5919–5933, Oct. 7, 2009. [41] M. W. Urban, S. Chen, and J. F. Greenleaf, “Error in estimates of tissue material properties from shear wave dispersion ultrasound vibrometry,” IEEE Trans. Ultrason. Ferroelectr. Freq. Control, vol. 56, pp. 748–758, Apr. 2009. [42] X. Zhang, B. Qiang, and J. Greenleaf, “Comparison of the surface wave method and the indentation method for measuring the elasticity of gelatin phantoms of different concentrations,” Ultrasonics, vol. 51, pp. 157–164, Feb. 2011. [43] M. Zhang, Y. P. Zheng, and A. F. Mak, “Estimating the effective Young’s modulus of soft tissues from indentation tests—Nonlinear finite element analysis of effects of friction and large deformation,” Med. Eng. Phys., vol. 19, pp. 512–517, Sep. 1997. [44] K. E. Atkinson and L. F. Shampine, “Algorithm 876: Solving Fredholm integral equations of the second kind in MATLAB,” ACM Trans. Math. Software, vol. 34, no. 4, pp. 1–20, 2008. [45] G. Boyer, H. Zahouani, A. Le Bot, and L. Laquieze, “In vivo characterization of viscoelastic properties of human skin using dynamic micro-indentation,” Conf. Proc. IEEE Eng. Med. Biol. Soc., vol. 2007, pp. 4584–4587, 2007.
Bo Qiang (M’02) is a Senior Research Technologist at Mayo Clinic, Rochester, MN. He received his B.S. degree majoring in electrical engineering from the University of Electronic Science and Technology of China, Chengdu, China, in 2002. He also received an M.S. degree from the University of Dayton, Dayton, OH, in 2004. He is currently working on surface wave elastography. Before joining Mayo Clinic, he was a Biomedical Engineer at ASL Analytical Inc., Oakdale, IA.
qiang et al.: estimating material elasticity by spherical indentation load-relaxation tests James F. Greenleaf (M’73) received the B.S. degree in electrical engineering from the University of Utah, Salt Lake City, in 1964; the M.S. degree in engineering science from Purdue University, Lafayette, IN, in 1968; and the Ph.D. degree in engineering science from the Mayo Graduate School of Medicine, Rochester, MN, and Purdue University in 1970. He is currently Professor of Biomedical Engineering and Associate Professor of Medicine, Mayo Graduate School, and Consultant, Department of Physiology and Biomedical Engineering, and Internal Medicine, Division of Cardiovascular Diseases, Mayo Clinic Rochester. He has served on the IEEE Technical Committee for the IEEE International Ultrasonics Symposium for ten years. He served on the IEEE Ultrasonics, Ferroelectrics, and Frequency Control Society (UFFC-S) Subcommittee on Ultrasonics in Medicine/IEEE Measurement Guide Editors, and on the IEEE Medical Ultrasound Committee. Doctor Greenleaf was President of the UFFC-S in 1992 and 1993. Dr. Greenleaf has 15 patents and is recipient of the 1986 J. Holmes Pioneer Award and the 1998 William J. Fry Memorial Lecture Award from the American Institute of Ultrasound in Medicine. He is a Fellow of IEEE, the American Institute of Ultrasound in Medicine, the American Institute for Medical and Biological Engineering, and the Acoustical Society of America. Dr. Greenleaf was the Distinguished Lecturer for the IEEE Ultrasonics, Ferroelectrics, and Frequency Control Society (1990/1991) and recipient of the Rayleigh Award (2004). His special field of interest is ultrasonic biomedical science, and he has published more than 327 articles and edited or authored five books in the field.
Michelle L. Oyen is a Lecturer in Mechanics of Biological Materials in the Mechanics and Materials Division and the Engineering for the Life Sciences group in the Cambridge University Engineering Department. She holds a B.S. degree in materials science and engineering and an M.S. degree in engineering mechanics, both from Michigan State University, and a Ph.D. degree in biophysical sciences and medical physics from the University of Minnesota. She joined Cambridge
1429
Engineering in 2006 following an appointment as Research Scientist at the University of Virginia Center for Applied Biomechanics. She is a member of the Materials Research Society and the ASME Bioengineering Division, a principal editor for the Journal of Materials Research, a moderator of iMechanica and a founding committee member and webmaster for the new UK-based Bioengineering Society.
Xiaoming Zhang received his B.Eng. degree in ship engineering in 1983 from Huazhong University of Science and Technology (HUST), Wuhan, People’s Republic of China, his M.Eng. degree in 1986, and his Ph.D. degree in 1990 from the same university. He was an Assistant Professor at the Department of Naval Architecture and Ocean Engineering, HUST, from 1986 to 1991. He was a postdoctoral fellow and an associate professor at the Department of Acoustics, Harbin Engineering University, Harbin, China, between 1991 and 1994. He worked at the Institute of Sound and Vibration Research, University of Southampton, Southampton, England, as a research fellow in 1992 and 1993. He became a professor at HUST in 1995. He was a senior research engineer at the Institute of High-Performance Computing, Singapore, from 1998 to 2001. He currently is an associate professor and associate consultant at the Department of Physiology and Biomedical engineering, Mayo Clinic College of Medicine, Rochester, MN. His main research interests are in medical ultrasound, vibro-acoustics, elastography, wave propagation, instrumentation, and medical devices. He is a member of IEEE, the American Society of Mechanical Engineers, the Acoustic Society of America, and other societies