The International Archives of the Photogrammetry, Remote Sensing and Spatial Information Sciences, Volume XL-1/W4, 2015 International Conference on Unmanned Aerial Vehicles in Geomatics, 30 Aug–02 Sep 2015, Toronto, Canada
Estimation of the spectral sensitivity functions of un-modified and modified commercial off-theshelf digital cameras to enable their use as a multispectral imaging system for UAVs E. Berra1, S. Gibson-Poole2, A. MacArthur3, R. Gaulton1, A. Hamilton2 of Civil Engineering and Geosciences, Cassie Building, Newcastle University, Newcastle upon Tyne, NE1 7RU, UK. *
[email protected] 2Scotland’s Rural College, Peter Wilson Building, Kings Buildings, West Mains Road, Edinburgh, EH9 3JG, UK. *
[email protected]; *
[email protected] 3NERC Field Spectroscopy Facility, Grant Institute, The King's Buildings, James Hutton Road, Edinburgh EH9 3FE, UK
1School
KEYWORDs: UAV, Remote Sensing, Multispectral, COTS, Spectral Sensitivity, Open Source, CHDK
ABSTRACT: Commercial off-the-shelf (COTS) digital cameras on-board unmanned aerial vehicles (UAVs) have the potential to be used as multispectral imaging systems; however, their spectral sensitivity is usually unknown and needs to be either measured or estimated. This paper details a step by step methodology for identifying the spectral sensitivity of modified (to be response to near infra-red wavelengths) and un-modified COTS digital cameras, showing the results of its application for three different models of camera. Six digital still cameras, which are being used as imaging systems on-board different UAVs, were selected to have their spectral sensitivities measured by a monochromator. Each camera was exposed to monochromatic light ranging from 370 nm to 1100 nm in 10 nm steps, with images of each step recorded in RAW format. The RAW images were converted linearly into TIFF images using DCRaw, an open-source program, before being batch processed through ImageJ (also open-source), which calculated the mean and standard deviation values from each of the red-green-blue (RGB) channels over a fixed central region within each image. These mean values were then related to the relative spectral radiance from the monochromator and its integrating sphere, in order to obtain the relative spectral response (RSR) for each of the cameras colour channels. It was found that different un-modified camera models present very different RSR in some channels, and one of the modified cameras showed a response that was unexpected. This highlights the need to determine the RSR of a camera before using it for any quantitative studies.
1 INTRODUCTION A new era of fine-scale remote sensing has emerged with the arrival of unmanned aerial vehicles (UAVs), which have the advantage of being lightweight, low-cost and operationally easy to deploy as safe remote sensing acquisition platforms (Berni et al., 2009; Zhang & Kovacs, 2012). Commercial off-the-shelf (COTS) digital cameras are typically used as imaging systems on-board UAVs due to their low-cost and researchers often want to make further use of them as multispectral imaging systems due to their ability to detect near infra-red light (Darrodi et al., 2015; Suzuki et al., 2009; Lebourgeois et al., 2008), once modified by removing the hot mirror filter (Rabatel et al., 2014; Verhoeven et al., 2009).
Even though previous studies have measured the spectral function of different digital still cameras using monochromators (Darrodi et al., 2015; Jiang et al., 2013; Suzuki et al., 2009; Verhoeven et al., 2009), there is a lack of a detailed methodology in how to do so, which has motivated us to present an open-source workflow to process the images after image acquisition. In this paper, we aim to identify and to present a step-by-step methodology for identifying the spectral sensitivity of modified and un-modified low-cost digital cameras using open source software, in order for them to be used as multispectral cameras for UAV systems and compare the results for a range of COTS and modified cameras.
2 METHODOLOGY However, this is hampered by a lack of knowledge of the spectral sensitivity of the camera, as COTS camera manufacturers typically do not publish this information. Also when cameras have been modified (with the addition of a long pass or notch filter) by an external party, the wavelengths that could be transmitted through that filter are also not always known (as is the case with two of the modified cameras in this study). Therefore, users need to either measure or estimate their cameras sensitivity (Darrodi et al., 2015; Jiang et al., 2013). A standard and accurate methodology for measuring the sensor sensitivities is to take photographs of monochromatic light produced by a monochromator (Darrodi et al,. 2015), where the digital numbers (DN) recorded on the images are expected to have a linear response to the radiation output of the monochromator (Verhoeven et al., 2009).
2.1 Camera types and settings Six physical cameras (two of each model), which have been used as imaging systems on-board different UAVs, were selected for spectral sensitivity estimation. The cameras were either un-modified and therefore only sensitive to visible light (VIS), or modified (MOD) to also be sensitive to near infra-red (NIR) wavelengths. The modified cameras have had their internal NIR filter removed, thereby turning them into a full spectrum (FS) camera, which was then replaced with either an internal or external long pass or notch filter to alter the cameras spectral sensitivities. A preliminary image acquisition of monochromatic light was carried out in order to determine the optimal settings for each
This contribution has been peer-reviewed. doi:10.5194/isprsarchives-XL-1-W4-207-2015
207
The International Archives of the Photogrammetry, Remote Sensing and Spatial Information Sciences, Volume XL-1/W4, 2015 International Conference on Unmanned Aerial Vehicles in Geomatics, 30 Aug–02 Sep 2015, Toronto, Canada
camera, as presented in Table 1. For each of the cameras, the ISO was set to 100 in order to gain a high signal to noise ratio, and the aperture and shutter speed were altered to ensure that the image was not overexposed. The optimal exposure settings were chosen when the monochromatic light with the highest signal intensity (~540 nm for VIS and between 600~700 nm for NIR) came close too (but not actually) saturating the images digital numbers (DN).
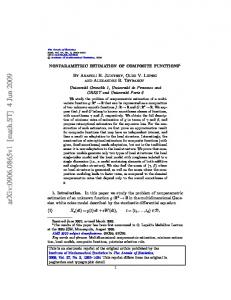
double monochromator (OL 750-M-D Double Grating Monochromator (Additive), Optronic Laboratories, Inc., Orlando, Florida, USA) and reflected by an integrating sphere attached at the monochromators exit slit. The light beam is reflected by the spheres interior surface from where images were acquired through a detection port in the integrating sphere (Figure 1).
The defined settings (Table 1) were then kept unchanged throughout the acquisition period and the images were recorded in both JPG and RAW formats. RAW format is necessary as it assumes that the cameras sensor detects and stores radiance without applying any processing or compression to it, i.e. the original signal reaching the sensor is not modified (Verhoeven, 2010).
Camera Model Panasonic DMCLX5
Aperture; Shutter Speed f-2; 1/5
Short Name; Notes PAN_VIS -Un-modified PAN_MOD -No internal NIR filter Panasonic f-2; -External long pass filter DMCLX5 1/3.2 (manufacturer and cut on wavelength not known) Canon f-2.8; CAN_VIS A2200 1/2 -Un-modified Canon f-2.8; CAN_MOD A2200 1/2 -No internal NIR filter CAN_MOD_585 -No internal NIR filter Canon f-2.8; -External acrylic long pass A2200 1/2 filter, 585 nm cut on (Knight Optical, 2015) SON_VIS Sony f-2.8; -Un-modified Nex7 1/5 -HGX 49 mm UV filter SON_MOD -No internal NIR filter -Internal notch filter Sony f-2.8; (MaxMax LDP LCC G-RNex7 1/3 NIR, exact transmission properties not known) - HGX 49 mm UV filter Table 1: Camera types, exposure settings and modifications. Each camera used an ISO of 100 throughout the experiment.
Both the Panasonic and Sony cameras were able to record JPG and RAW files natively; however, the Canon camera could not. Therefore modified firmware (CHDK v1.2; CHDK, 2015) was used to allow JPG and RAW (Adobe DNG v1.3 format) images to be produced, as well as to allow the shutter speed to be set at a constant value. 2.2 Monochromatic light image acquisition
Figure 1: The monochromator and camera setup and three example images of the inside of the integrating sphere at different wavelengths. The monochromator was located in a temperature-controlled dark room and the lens of each camera was positioned touching the integrating spheres detection port. The sphere and camera were also covered by a low reflectance black cloth in order to avoid any external light contaminating the result. Each camera was exposed to monochromatic light ranging from 370 nm to 1100 nm in 10 nm steps, with two images being captured at each step (most of the cameras were tested across only a portion of this complete range). Therefore, the selected nominal half bandwidth (HBW) was 10 nm (using 1200 g/mm gratings), which is achieved by combining 5 mm slits at the entrance, middle and exit ports (Optronic, 2002). Due to the range of wavelengths being sampled, it was also necessary to vary the lamp voltage and the type of internal filter used. The settings selected on the monochromator and the wavelength interval from which images were acquired to measure the cameras spectral response, are presented in Table 2. 19 17 17 Lamp Voltage (v) 345 345 599 Filter (nm) Wavelengths 370-500 510-620 630-1100 sampled (nm) Table 2: Monochromator lamp voltage and internal filter settings used for specific wavelengths being sampled. Dark images were also acquired for the Panasonic cameras in order to correct for effects of noise create by the dark current signal (Verhoeven et al., 2009). Photographs were taken inside the dark room with the camera lens covered by the black cloth and the room light switched off.
The spectral sensitivities of each camera were measured by recording their response to monochromatic light produced by a
This contribution has been peer-reviewed. doi:10.5194/isprsarchives-XL-1-W4-207-2015
208
The International Archives of the Photogrammetry, Remote Sensing and Spatial Information Sciences, Volume XL-1/W4, 2015 International Conference on Unmanned Aerial Vehicles in Geomatics, 30 Aug–02 Sep 2015, Toronto, Canada
COTS cameras are likely to sense wavelengths lower than 400 nm (Nijland et al., 2014).
2.3 Imaging processing Each camera recorded its RAW image file using a different format dependant on the camera manufacturer, so the open source software DCRaw (v9.25; DCraw, 2015a) was used to convert the RAW files into TIFF images that maintained a linear relationship with the original RAW data (Gehrke & Greiwe, 2014; Verhoeven et al., 2009). During this step, the Panasonic images were also corrected for the effects of the dark current signal as DCRaw can utilise the dark image taken at the same time as the images of monochromatic light, generating dark-corrected linear TIFF images. The script command used with explanation is present in Appendix 1.
The RSR of the RGB channels for a given wavelength λ were calculated as per Eq. 1 (Suzuki et al,. 2009) and a linear relationship between the input radiance and the output signal is assumed (Darrodi et al. 2015). 𝑟(𝜆)
𝑔(𝜆)
𝑏(𝜆)
𝑅(𝜆) = 𝜂 𝐼(𝜆) , 𝐺(𝜆) = 𝜂 𝐼(𝜆) , 𝐵(𝜆) = 𝜂 𝐼(𝜆) Where
(1)
The TIFF image DNs were averaged within a 9 x 9 pixel area in the centre of each image, in order to avoid issues related with the variance of the radiance within the integrating sphere and any differences in the individual pixel response across each camera’s image sensor (Darrodi et al., 2015).
r, g, and b = the mean spectral response from each camera channel (red, green and blue channels, respectively) given in DN values and calculated from the 9x9 window (output signal); I = the light intensity (monochromator and sphere) given in relative spectral radiance units (input radiance); η = the normalized coefficient.
To obtain the mean and standard deviation values from the 9x9 pixel window of each image, a macro was created using the open source software ImageJ (v1.49k, Fiji distribution; ImageJ, 2015). Figure 2 details the workflow used to capture these values and a detailed step-by-step guide is presented in Appendix 2 and the ImageJ macro script used is presented in Appendix 3.
Instead of using absolute physical units, the η coefficient is applied to generate a relative spectral response, as it results in lower calibration uncertainties (Darrodi et al., 2015). For each camera, the mean spectral response over all of the wavelengths were normalized (η) by the maximum signal detected among the RGB channels, yielding dimensionless units with a peak equal to 1.
RAW and JPG images converted to TIFF using DCRAW
A
TIFF images split into three channels using an ImageJ macro
TIFF images cropped to a 9x9 pixel window (at the centre of each image) using an ImageJ macro B
TIFF images analysed using ImageJ measure function to obtain mean pixel value and standard deviation Figure 2: Post processing steps to convert RAW and JPG images and to obtain mean and standard deviation digital number values for further analysis. 2.4 Retrieving RSR from the cameras The light intensity from the monochromator and its integrating sphere were independently measured using a reference silicon photodiode (OL DH-300C S/N: 12101253, Optronic Laboratories, Inc., Orlando, Florida, USA) in order to identify the relative spectral radiance at each measured wavelength (Figure 3). The settings used mirrored those used at the image acquisition phase (Table 2). Two lamps voltages were used (Figure 3B), with the 17 V lamp was used in combination with the 345 nm and 599 nm filter, however for the lower wavelengths (Macros->Edit. Copy the custom script (Appendix 2) into the edit window. On the macro window select Language -> IJ1 Macro and alter the input and output variables to match the input and output directories that you have created. Click on the Run button and the script will process the images showing a log that will say “—PROCESSING COMPLETE—“ when finished.
4)
Batch analysis: Return to the Fiji main menu and select Analyze->Set Measurements and ensure that mean grey value and standard deviation value are selected. Go back to the Fiji main menu and selecting Process->Batch->Measure and select your output directory for the relevant colour channel. It should show a results window detailing all of the cropped images and each ones accompanying data.
Appendix 3: ImageJ macro script // NOTE this should work for any image file size, both tiff (16 bit) and jpg (24 bit) // input and output directories // NOTE ensure only image files are present in input and output directory contains RED, GREEN and BLUE folders that are empty! Input = “C:\\??\\??\\”; output = “C:\\??\\??\\”; // run in batch mode to speed things up (does not open files etc to the GUI setBatchMode(true); // get the file list from the input directory file = getFileList(input);
// select the newely created RGB image (8 bit) and split it into three channels // set the scale to pixels run("Set Scale...", "distance=0 known=0 pixel=1 unit=pixel"); print ("Set Scale Done"); // Identify the height and width and set the centre point to use Cwidth = (getWidth()/2)-5; print ("Width = " + getWidth() + "; Cwidth = " + Cwidth); Cheight = (getHeight()/2)-5; print ("Height = " + getHeight() + "; Cheight = " + Cheight); // identify bit depth (effects the active window names) Bdepth = bitDepth(); print ("Bit depth = " + Bdepth); // split the channels if (Bdepth == 8) { run("RGB Color"); print ("8 Bit Image Converted"); } run("Split Channels"); print ("Split Channels Done"); //
select the blue channel image, crop it and save it as tiff if (Bdepth == 16) { selectWindow("C3-" + filename); } else { selectWindow(filename + " (blue)"); } makeRectangle(Cwidth, Cheight, 9, 9); run("Crop"); print ("Cropped " + filename + " BLUE"); saveAs("Tiff", output + "BLUE\\" + filename "_BLUE.tif"); print ("Saved " + filename + " BLUE"); close(); print ("Closed BLUE Channel"); select the green channel image, crop it and save it as tiff if (Bdepth == 16) { selectWindow("C2-" + filename); } else { selectWindow(filename + " (green)"); } makeRectangle(Cwidth, Cheight, 9, 9); run("Crop"); print ("Cropped " + filename + " GREEN"); saveAs("Tiff", output + "GREEN\\" + filename "_GREEN.tif"); print ("Saved " + filename + " GREEN"); close(); print ("Closed GREEN Channel");
//
//
// loop the file list and process the function for (i = 0; i < file.length; i++) SplitAndCrop(input, output, file[i]); setBatchMode(false); print ("--PROCESSING COMPLETE--"); // this function will open a file, split it into RGB channels, // crop each channel to a central 9x9 pixel window and the save the crop as a tiff function SplitAndCrop(input, output, filename) { // open the first file open(input + filename); print ("Opened " + filename); selectWindow(filename);
+
select the red channel image, crop it and save it as tiff if (Bdepth == 16) { selectWindow("C1-" + filename); } else { selectWindow(filename + " (red)"); } makeRectangle(Cwidth, Cheight, 9, 9); run("Crop"); print ("Cropped " + filename + " RED"); saveAs("Tiff", output + "RED\\" + filename + "_RED.tif"); print ("Saved " + filename + " RED"); close(); print ("Closed RED Channel");
}
This contribution has been peer-reviewed. doi:10.5194/isprsarchives-XL-1-W4-207-2015
214
+