Hindawi Publishing Corporation Journal of Petroleum Engineering Volume 2016, Article ID 5743471, 10 pages http://dx.doi.org/10.1155/2016/5743471
Research Article Eulerian-Eulerian Simulation of Particle-Liquid Slurry Flow in Horizontal Pipe Titus Ntow Ofei and Aidil Yunus Ismail Petroleum Engineering Department, Universiti Teknologi PETRONAS, 32610 Bandar Seri Iskandar, Malaysia Correspondence should be addressed to Titus Ntow Ofei;
[email protected] Received 25 July 2016; Accepted 14 August 2016 Academic Editor: Alireza Bahadori Copyright © 2016 T. N. Ofei and A. Y. Ismail. This is an open access article distributed under the Creative Commons Attribution License, which permits unrestricted use, distribution, and reproduction in any medium, provided the original work is properly cited. In this study, a computational fluid dynamics (CFD) simulation which adopts the inhomogeneous Eulerian-Eulerian two-fluid model in ANSYS CFX-15 was used to examine the influence of particle size (90 𝜇m to 270 𝜇m) and in situ particle volume fraction (10% to 40%) on the radial distribution of particle concentration and velocity and frictional pressure loss. The robustness of various turbulence models such as the 𝑘-epsilon (𝑘-𝜀), 𝑘-omega (𝑘-𝜔), SSG Reynolds stress, shear stress transport, and eddy viscosity transport was tested in predicting experimental data of particle concentration profiles. The 𝑘-epsilon model closely matched the experimental data better than the other turbulence models. Results showed a decrease in frictional pressure loss as particle size increased at constant particle volume fraction. Furthermore, for a constant particle volume fraction, the radial distribution of particle concentration increased with increasing particle size, where high concentration of particles occurred at the bottom of the pipe. Particles of size 90 𝜇m were nearly buoyant especially for high particle volume fraction of 40%. The CFD study shows that knowledge of the variation of these parameters with pipe position is very crucial if the understanding of pipeline wear, particle attrition, or agglomeration is to be advanced.
1. Introduction Conveyance of slurries through pipelines is common throughout the worlds. Over the decades, the flow of slurries through pipelines had been a common practice for various industries such as the oil and gas, food, pharmaceutical, solid handling, tailing, and even power generation. Many factors affect slurry flow behaviour in pipelines. These include particle size, velocity profile, frictional pressure loss, and concentration profile [1–4]. Past studies have suggested many empirical correlations to predict slurry flow behaviour; nonetheless, the capability of these correlations is limited to some data range and experimental setup. In the oil and gas industry, applications of horizontal well have increased especially in cementing operations and hydraulic fracturing treatment. Furthermore, in unconsolidated formations, oil is usually produced along with sand particles and transported through horizontal pipes. To have an efficient design, accurate prediction of the transport of slurry properties in horizontal pipe is required. Recently,
CFD has become an effective tool for modelling complex multiphase flow behaviours as it has the capability to tackle unlimited number of physical and operation conditions. Ekambara et al. [3] used CFD simulation to investigate the effect of in situ solids volume concentration, particle size, mixture velocity, and particle diameter on local timeaveraged solids concentration profiles, particle and liquid velocity profiles, and frictional pressure loss. The simulated results were compared to experimental data from published literature with good agreement. The study revealed that particles were asymmetrically distributed in the vertical plane with the degree of asymmetry increasing with increasing particle size. Nabil et al. [4] examined the effect of particle size on frictional pressure loss in a horizontal pipeline using both experimental setup and CFD technique. They observed that fine particle size recorded the least pressure loss, whereas coarse particle size recorded the highest pressure loss for each constant particle volume fraction (5% to 30%). CFD prediction of pressure loss was in agreement with measured
2 experimental data especially at low particle volume fraction and fine particle size. Furthermore, the study revealed that the particle velocity profiles were asymmetric in nature and dependent on particle size. The degree of asymmetry was observed to be directly proportional to the particle size due to the gravitational effect and inversely proportional to the mixture velocity at constant volume fraction. An approach related to slurry flow modelling started where one-dimensional (1D) Schmidt-Rouse equation [5] or equivalent to Hunt [6] was developed to relate the particle sedimentation rate to the turbulence exchange rate, as represented by solid eddy diffusivity. Based on this formulation, Karabelas [7] built an empirical model to predict the profile of particle concentration. Work done by him was then continued by Kaushal and coworkers [8–12] in developing a diffusion model. The model proposed a modification for solid diffusivity for coarse slurry flows and their functions show that the increase in solid concentration is due to the increase in the solid diffusivity. However, the model was formulated without taking into consideration solid diffusivity on both particle size and pipe Reynold number [13]. By comparing their pressure loss data with modified Wasp model, they found a match at higher fluid velocity; however, significant deviation shows at flow velocities near the deposition velocity [14]. A 1D two-layer model considering coarse particle slurry was developed by Wilson [15]. The author considered each layer with a uniform velocity and particle concentration because he assumes the particles to be very coarse. Doron et al. [16] developed a 2D model to predict flow patterns and pressure loss which is similar to Wilson’s model, where the authors assumed the lower layer as stationary. Wilson and Pugh [17] expanded the dispersive force model by accounting for particles suspended by fluid turbulence and contactload (Columbic) friction. Their model prediction of particle concentration and velocity profile was in a good agreement with measured experimental data. Doron and Barnea [18] extended their study to a threelayer model of slurry fluid flow in horizontal pipeline which consists of a suspended layer, a bed layer, and a dispersive layer which lies in between the suspended and bed layers. They assumed the dispersive layer to be high in concentration gradient where a no-slip condition was imposed between fluid and solid particles. The model prediction successfully showed assent with experimental data. Ramadan et al. [19] also proposed a three-layer model. The model predictions were then compared with experimental data where satisfactory agreement was achieved. Messa and Malavasi [20] proposed a new two-fluid model for the simulation of fully suspended liquid-solid slurry flows in horizontal pipes. The model is claimed to address wall boundary conditions for solid phase, viscosity of the slurry mixture which incorporates particle shape, and a solution algorithm which reduces computational burden. The authors emphasised that the new model increased the accuracy of the pressure gradient predictions without affecting the model’s capability in reproducing other engineering features such as solid volume fraction and velocity distributions. Ma et al. [21] conducted a CFD study for calculating erodent
Journal of Petroleum Engineering particle trajectories in slurry flow. It involves the capturing of the movement of erodent particles using the discrete phase method (DPM) and calculating the interfaces between fluid phase and gas phase using the volume of fluid (VOF) method. The authors revealed that their model results were in reasonable agreement with experimental observations in terms of normal impact velocity on the specimen surface. Recently, Miedema [22] proposed a framework for predicting head loss and limit deposit velocity in slurry flow. The framework is based on constant spatial volumetric concentration curves and uniform sand or gravels for five flow regimes in Newtonian fluid, namely, the stationary or fixed bed regime, the sliding bed regime, the heterogeneous regime, the homogeneous regime, and the sliding flow regime. The author concluded that the new framework explained the behaviour of very small particles in terms of the mobilisation of the lubrication effect of the particle poor viscous sublayer. In this study, the effects of particle size (90 𝜇m to 270 𝜇m) and volume fraction (10% to 40%) which are typical of slurry conditions in the oil and gas industry are analysed on the radial distribution of particle concentration and velocity and frictional pressure loss in horizontal pipe using CFD method. The findings are helpful to understand slurry transport behaviour on pipeline wear, particle attrition, or agglomeration.
2. Materials and Method A commercial CFD software ANSYS-CFX 15.0 is implemented in this study. The inhomogeneous Eulerian-Eulerian model, sometimes called the two-fluid model, which regards both continuous (liquid) and dispersed (solid) phases as interpenetrating continuum is used to model the slurry flow. The Eulerian-Eulerian model is best suited for high volume fractions of the dispersed phase which is averaged over each control volume. Each phase is governed by similar conservation equations and modelling is needed for interaction between the phases, turbulent dispersion of particles, and collision of particle with walls. A drawback of this model is, however, that complex closure relations are required. The following continuity and momentum equations representing the two-phase flow model are described for the sake of brevity. 2.1. Continuity Equations. The volume-averaged, incompressible, isothermal, and transient Navier-Stokes continuity equations for both liquid and solid phases are, respectively, given by [23, 24] 𝜕 (h ) + ∇ (h𝑙 𝑈𝑙 ) = 0, 𝜕𝑡 𝑙 𝜕 (h ) + ∇ (h𝑠 𝑈𝑠 ) = 0, 𝜕𝑡 𝑠
(1)
where h𝑙 and h𝑠 are the volume fraction of liquid and solid, respectively, and 𝑈𝑙 and 𝑈𝑠 are the velocity vector of liquid and solid, respectively. The mass exchange between the liquid and solid phases due to reaction or combustion is not considered.
Journal of Petroleum Engineering
3
2.2. Momentum Equations. The momentum balance for the liquid and solid phases which includes the interphase momentum transfer term that models the interaction between each phase is given by the Navier-Stokes equations as [23, 24] 𝜌𝑙 k𝑙 [
= −k𝑙 ∇𝑝 + k𝑙 ∇ ⋅ 𝜏𝑙 + k𝑙 𝜌𝑙 𝑔 − 𝑀,
(2)
𝜕𝑈 𝜌𝑠 h𝑠 [ 𝑠 + 𝑈𝑠 ⋅ ∇𝑈𝑠 ] 𝜕𝑡 = −h𝑠 ∇𝑝 + h𝑠 ∇ ⋅ 𝜏𝑙 + ∇ ⋅ 𝜏𝑠 − ∇𝑃𝑠 + h𝑠 𝜌𝑠 𝑔 + 𝑀,
2 𝑇 𝜏𝑙 = 𝜇𝑙 [∇𝑈𝑙 + (∇𝑈𝑙 ) ] − 𝜇𝑙 (∇ ⋅ 𝑈𝑙 ) 𝐼, 3 𝜏𝑠 = (−𝑃𝑠 + 𝜁𝑠 𝑈𝑠 ) 𝐼
(3) 𝑇
+ 𝜇𝑠 {[∇𝑈𝑠 + (∇𝑈𝑠 ) ] −
2 (∇ ⋅ 𝑈𝑠 ) 𝐼} , 3
(4)
Similarly, 𝑃𝑠 is the solid pressure that represents the solids phase normal forces caused by particle-particle interactions and takes the form [26] 𝑃𝑠 = 𝜌𝑠 h𝑠 Θs + 2𝜌𝑠 h2𝑠 Θs (1 + 𝑒) 𝑔0 .
(5)
The first term represents the particle velocity fluctuations and the second term represents the particle collisions. The shear solid viscosity can be represented as the sum of the kinetic and collisional contributions as 𝜇𝑠 = 𝜇𝑠,kin + 𝜇𝑠,col .
(6)
The kinetic and collisional component of the solids viscosity are modelled, respectively, as [26] 𝜌𝑠 𝑑𝑝
Θ 4 = h2𝑠 𝜌𝑠 𝑑𝑝 𝑔0 (1 + 𝑒) √ . 5 𝜋
For densely distributed solid particles, where the solid volume fraction k𝑠 < 0.2, the Wen and Yu [27] drag coefficient, 𝐶𝐷, model may be utilised. This model is modified and implemented in ANSYS-CFX to ensure the correct limiting behaviour in the inertial regime as 24 0.687 (1 + 0.15𝑁Re ) , 0.44] , 𝑝 𝑁Re 𝑝
(9)
where 𝑁Re = k𝑙 𝑁Re𝑝 and 𝑁Re𝑝 = 𝜌𝑙 |𝑈𝑙 − 𝑈𝑠 |𝑑𝑠 /𝜇𝑙 . 𝑝 For large solid volume fraction, k𝑠 > 0.2, the Gidaspow drag model may be used with the interphase drag force per unit volume defined as [26] 2 150 (1 − k𝑙 ) 𝜇𝑙 7 (1 − k𝑙 ) 𝜌𝑙 𝑈𝑙 − 𝑈𝑠 (10) + . 𝑀𝐷 = k𝑙 𝑑𝑠2 4 𝑑𝑠
In this study, both Wen and Yu and Gidaspow drag models were employed depending on the computed solid volume fraction.
𝑀𝐿 =
(11) 3 √]𝑙 𝐶 h 𝜌 (𝑈 − 𝑈𝑙 ) (∇ × 𝑈𝑙 + 2Ω) . 2𝜋 𝑑 √∇ × 𝑈 𝐿 𝑠 𝑙 𝑠 𝑠 𝑙
Saffman [28, 29] correlated the lift force for low Reynolds number past a spherical solid particle where 𝐶𝐿 = 6.46 and 0 ≤ 𝑁Re𝑝 ≤ 𝑁Re𝜔 ≤ 1. For higher range of solid particle Reynolds number, Saffman’s correlation was generalised by Lun et al. [25] as follows: 𝐶𝐿 { {6.46 ⋅ 𝑓 (𝑁Re𝑝 , 𝑁Re𝜔 ) ={ {6.46 ⋅ 0.0524 ⋅ (𝛽𝑁 )1/2 Re𝑝 { where
𝛽 = 0.5 (
(7)
for : 𝑁Re𝑝 < 40
(12)
for : 40 < 𝑁Re𝑝 < 100,
𝑁Re𝜔 𝑁Re𝑝
), −0.1𝑁Re𝑝
𝑓 (𝑁Re𝑝 , 𝑁Re𝜔 ) = (1 − 0.3314𝛽0.5 ) ⋅ 𝑒 + 0.3314𝛽0.5 ,
2
5√𝜋 4 (1 + 𝜂 (1 + 𝑒) 𝑔0 h𝑠 ) √Θ, 48 (1 + 𝑒) 𝑔0 5
(8)
2.3.2. Lift Force Model. For spherical solid particles, ANSYSCFX employs the Saffman and Mei lift force model as
where 𝜇𝑙 and 𝜇𝑠 are the shear liquid and solid viscosity, respectively, and 𝜁𝑠 is the bulk solid viscosity which accounts for the resistance of the granular particles to compress and expand and has the form [25] Θ 4 𝜁𝑠 = h2𝑠 𝜌𝑠 𝑑𝑝 𝑔0 (1 + 𝑒) √ . 3 𝜋
3𝐶𝐷 k 𝜌 𝑈 − 𝑈𝑙 (𝑈𝑠 − 𝑈𝑙 ) . 4𝑑𝑠 𝑠 𝑙 𝑠
max [ 𝐶𝐷 = k−1.65 𝑙
where 𝑔 is the gravity term, 𝑝 is the thermodynamic pressure, 𝜌𝑙 and 𝜌𝑠 are density of liquid and solid, respectively, 𝑀 is the sum of interfacial forces including drag force and lift force, and 𝜏𝑙 and 𝜏𝑠 are the shear stress tensor for both liquid and solid, respectively. The liquid phase and solid phase stress tensors can be represented, respectively, as
𝜇𝑠,col
2.3.1. Drag Force. For spherical particles, the drag force per unit volume is given as 𝑀𝑑 =
𝜕𝑈𝑙 + 𝑈𝑙 ⋅ ∇𝑈𝑙 ] 𝜕𝑡
𝜇𝑠,kin =
2.3. Interphase Models
𝜌𝑙 𝜔𝑙 𝑑𝑠2 , 𝜇𝑙 𝜔𝑙 = ∇ × 𝑈𝑙 .
𝑁Re𝜔 =
(13)
4
Journal of Petroleum Engineering
Figure 1: 2D and 3D meshed geometry.
2.3.3. Turbulence 𝑘-𝜀 Model. The 𝑘-𝜀 turbulence model offers a good compromise in terms of accuracy and robustness for general purpose simulations. It is a semiempirical model based on transport equation for the estimation of turbulent length scale and velocity scale from the turbulent kinetic energy (𝑘) and dissipation rate (𝜀) [30]. In multiphase flow, the transport equations for 𝑘 and 𝜀 are phase dependent and assume a similar form to the single-phase transport equations, respectively, as 𝜕 (𝐶 𝜌 𝑘 ) + ∇ 𝜕𝑡 𝛼 𝛼 𝛼 ⋅ (𝐶𝛼 (𝜌𝛼 𝑈𝛼 𝑘𝛼 − (𝜇 +
𝜇𝑡𝛼 ) ∇𝑘𝛼 )) 𝜎𝑘
(𝑘) , = 𝐶𝛼 (𝑃𝛼 − 𝜌𝛼 𝜀𝛼 ) + 𝑇𝛼𝛽
(14)
𝜇 𝜕 (𝐶 𝜌 𝜀 ) + ∇ ⋅ (𝐶𝛼 𝜌𝛼 𝑈𝛼 𝜀𝛼 − (𝜇 + 𝑡𝛼 ) ∇𝜀𝛼 ) 𝜕𝑡 𝛼 𝛼 𝛼 𝜎𝜀 = 𝐶𝛼
𝜀𝛼 (𝜀) (𝐶 𝑃 − 𝐶𝜀2 𝜌𝛼 𝜀𝛼 ) + 𝑇𝛼𝛽 , 𝑘𝛼 𝜀1 𝛼
where 𝐶𝜀1 = 1.44, 𝐶𝜀2 = 1.92, 𝐶𝜇 = 0.09, 𝜎𝑘 = 1.0, and 𝜎𝜀 = (𝜀) (𝑘) 1.3 are standard constants. 𝑇𝛼𝛽 and 𝑇𝛼𝛽 are the interphase transfer for 𝜀 and 𝑘, respectively. Diffusion of momentum in phase 𝛼 is governed by an effective viscosity as 𝜇eff = 𝜇 + 𝜇𝑡𝛼 .
(15)
The 𝑘-𝜀 model assumes that the turbulence viscosity is linked to the turbulence kinetic energy and dissipation by the relation 𝜇𝑡𝛼 = 𝐶𝜇 𝜌𝛼
𝑘𝛼2 . 𝜀𝛼
(16)
The governing sets of partial differential equations were discretised using finite volume technique. The discretised equations together with initial and boundary conditions are solved iteratively for each control volume of pressure drop and cuttings concentration using ANSYS-CFX 15.0 solver. 2.4. Geometry Modelling and Meshing. The three-dimensional (3D) horizontal pipe geometry was modelled using ANSYS 15.0 Workbench Design Modeller. The dimensions of the geometry were taken from literature [31]. In order to ensure a fully developed flow, a hydrodynamic entrance length was computed using the following expression: 1/6 × 𝐷ℎ , 𝐿 ℎ = 4.4 × 𝑁Re
(17)
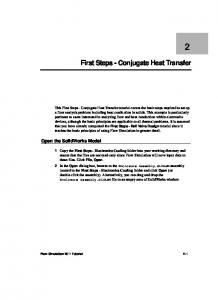
where 𝑁Re is the Reynolds number of the liquids and 𝐷ℎ is the hydraulic diameter. The geometry was meshed into small grid cell using unstructured tetrahedral mesh type with inflation layers created at the boundary of the pipe to accurately capture the flow effect in that region [32]. Figure 1 presents the meshed 3D geometry. The number of elements were optimised until the results were no longer affected. In this study, the optimised number of elements used was 801,848. 2.5. Boundary and Initial Conditions. At the inlet of the pipe, mixture velocity and volume fraction of both liquid and particles phases were specified. At the outlet, static pressure was specified. At the wall, no-slip condition was imposed on the liquid, while free-slip condition was imposed on the particles. To initiate the numerical solution, average volume fractions and mixture velocity were specified as initial conditions. 2.6. Numerical Solution. In this transient simulation particlewater slurry study, the Navier-Stokes governing equations together with their closure terms were solved using ANSYSCFX-15.0 solver. The mass and momentum equations were discretised using the control volume technique. The firstorder implicit method was adopted for time discretisation, whereas the second-order implicit method was also adopted for space in solving the conservation law equations. The SIMPLE algorithm was utilised to solve the pressure-velocity coupling in the momentum equations, while the high resolution discretisation scheme was employed for the convective terms. A constant time-step of 0.001 s and a total time of 20 s were used to perform the entire simulation. The solution was assumed to be converged when the root mean square (RMS) of the normalised residual error reached 10−4 for all simulations. 2.7. Model Validation. The simulation model setup was validated against experimental data available in literature [31]. The particles properties employed were as follows: size, 𝑑𝑝 = 270 𝜇m; specific gravity, SG = 2.65; and in situ particle volume fraction, k𝑠 = 0.10. The mixture velocity used is 5.4 m/s. Several simulation runs were carried out to investigate the accuracy of various turbulence models in predicting the experimental particle concentration profile data. The 𝑘-epsilon (𝑘-𝜀), 𝑘-omega (𝑘-𝜔), SSG Reynolds stress, shear stress transport, and eddy viscosity transport were among the tested models. The 𝑘-𝜀 model was very robust in predicting the particle concentration profile as compared to the other models as shown in Figure 2, thus confirming the
Journal of Petroleum Engineering
5 1.0
r/R
0.8 0.6 0.4 0.2 0.0
0
0.1
0.2
0.3
0.4
0.5
Particle concentration (—) Experimental k-omega Shear stress transport
k-epsilon SSG Reynold stress Eddy viscosity transport
Figure 2: Comparison of predicted and experimental particle concentration profile.
Table 1: Simulation matrix. Simulation parameter Pipe diameter, 𝐷 Pipe length Size of particle Particle volume fraction Specific gravity of particle Specific gravity of water Velocity of mixture Turbulence equation
Values 103 mm 44 × 𝐷 90 𝜇m–270 𝜇m 0.10–0.45 2.65 1.00 5.4 m/s 𝑘-𝜀 model
validity of the simulation model. The simulation matrix used in performing sensitivity study is shown in Table 1 where the 𝑘-𝜀 model was employed in all simulation run.
3. Results and Discussion This section shows the effects of particle size and in situ particle volume fraction on the radial distribution of particle concentration and velocity and frictional pressure loss. 3.1. Effect of Particle Size on Particle Concentration. Contour plots of particle concentration as a function varying particle size at the outlet of the pipe are shown in Figures 3(a)– 3(d). With a constant in situ particle volume fraction of k𝑠 = 0.10, there are significant differences in the particle concentration as the particle size increases. It is observed that the smallest particles (𝑑𝑝 = 90 𝜇m) were more buoyant and homogeneously dispersed in the liquid phase. As the particle size increases from 𝑑𝑝 = 90 𝜇m to 270 𝜇m, the particle concentration becomes high at the bottom of the pipe due to gravitational effect which prevents the large particles from travelling farther and exiting out of the pipe. The maximum recorded particle concentrations deposited at the bottom of the horizontal pipe are 15.1%, 21.5%, 25.8%, and 30.7% for particle size of 𝑑𝑝 = 90 𝜇m, 150 𝜇m, 210 𝜇m, and 270 𝜇m, respectively. These results show that, in the transportation
of oil in addition to sand particles, larger particles may accumulate at the bottom of the pipe thereby blocking the effective flow area and reducing productivity. Figures 4(a)–4(c) also show the predicted concentration profiles in the radial direction of the horizontal pipe for three different in situ particle volume fractions: k𝑠 = 10%, 25%, and 40% with varying particle sizes. The results represent a broad spectrum of fluid turbulence effect on particle suspension from neutrally buoyant to sluggish especially at the bottom of the pipe as particle size increases for each constant in situ particle volume fraction. This phenomenon was also observed by Ekambara et al. [3]. It is noteworthy that particle concentration increased as in situ particle volume fraction also increased. For particle size of 𝑑𝑝 = 90 𝜇m, there was no noticeable change in the particle concentration profile for all in situ particle volume fractions (see Figures 4(a)–4(c)). This is because the particles are relatively fine and the mixture velocity is significantly greater than the deposition velocity. Nonetheless, for particle size of 𝑑𝑝 = 270 𝜇m and k𝑠 = 10%, the particle concentration profile collapses rapidly due to the weak particle-particle interactions which is further overcome by the particle depositional velocity (see Figure 4(a)). When the in situ particle volume fraction increases to k𝑠 = 40%, a strong particle-particle bond is formed thereby suspending the particle concentration in almost the entire pipe as shown in Figure 4(c). A further description can be viewed in the contour plots in Figures 5(a)–5(c). 3.2. Effect of In Situ Particle Volume Fraction on Particle Velocity. Figures 6(a) and 6(b) show the effect of in situ particle volume fraction on particle velocity for constant particle size of 90 𝜇m and 270 𝜇m, which represent the fine and coarse particles, respectively. Generally, it is observed from both results that particle velocity profiles were asymmetrical about the central axis; however, the degree of asymmetry is influenced by particle size. For particle size of 270 𝜇m, the particle velocity profile plots are more skewed to the bottom of the pipe as shown in Figure 6(b). This is due to particle settling of the coarse particles as a result of gravity effect. This
Journal of Petroleum Engineering 0.215
0.142
0.196
0.133
0.177
0.124 0.114 0.105 0.096 0.087
20.000
40.00
60.00
0.157 0.138 0.119 0.099 0.080
0.077
0.061
0.068
0.041
0.059
0.022 0
80.00
20.000
40.00
60.00
80.00
(GG)
(GG) (a)
(b)
0.307
0.258
0.277
0.232
0.246
0.207
0.157 0.132 0.107 0.082
0.216
Cuttings volume fraction
0.182
0.185 0.155 0.124 0.093 0.063
0.057
0.032
0.032
0.002
0.006 0
20.000
40.00 (GG)
60.00
80.00
(c)
Cuttings volume fraction
0
Cuttings volume fraction
0.151
Cuttings volume fraction
6
0
20.000
40.00 (GG)
60.00
80.00
(d)
Figure 3: Contour plots of particle concentration at k𝑠 = 10%: (a) 𝑑𝑝 = 90 𝜇m, (b) 𝑑𝑝 = 150 𝜇m, (c) 𝑑𝑝 = 210 𝜇m, and (d) 𝑑𝑝 = 270 𝜇m.
phenomenon has also been demonstrated experimentally by Gillies and Shook [33]. Furthermore, for each constant particle size, particle velocity increased with decreasing in situ particle volume fraction. This is due to fluid turbulence effect on the weak particle-particle interaction of the low in situ particle volume fraction of k𝑠 = 10%. The increase in particle velocity for varying in situ particle volume fractions is however more pronounced for fine particle size of 90 𝜇m as shown in Figure 6(a). 3.3. Effect of Particle Size on Frictional Pressure Loss. In Figure 7, the effect of particle size on frictional pressure loss for constant in situ particle volume fraction is presented. It
is observed that frictional pressure loss in the pipe decreased with increasing particle size for each constant in situ particle volume fraction. It is noteworthy that turbulent flow will keep fine particles (𝑑𝑝 = 90 𝜇m) in suspension. This will increase the effective viscosity of the suspension and hence decrease its Reynolds number. Since friction factor is inversely proportional to the Reynolds number, a decrease in Reynolds number will increase friction factor. The frictional pressure loss will ultimately increase since it is directly proportional to the friction factor. On the contrary, coarse particle sizes (𝑑𝑝 > 90 𝜇m) will settle easily at the bottom of the horizontal pipe, thus blocking part of the effective flow area. This will increase the fluid velocity in the effective flow area and as a result
Journal of Petroleum Engineering
7 1
0.5 0
0
0.05
0.1
0.15
0.2
0.25
0.3
0.35
− 0.5 −1
Normalised radial position, r/R
Normalised radial position, r/R
1
0.5 0
0.05
0.1
0.15
0.2
0.25
0.3
0.35
0.4
0.45
− 0.5 −1
Particle concentration (—) 90 G 150 G
0
Particle concentration (—) 90 G 150 G
210 G 270 G
210 G 270 G
(a)
(b)
Normalised radial position, r/R
1 0.5 0
0
0.1
0.2
0.3
0.4
0.5
0.6
− 0.5 −1
Particle concentration (—) 90 G 150 G
210 G 270 G (c)
Figure 4: Effect of particle size on particle concentration profile: (a) k𝑠 = 10%, (b) k𝑠 = 25%, and (c) k𝑠 = 40%.
increase the Reynolds number. The friction factor decreases, thereby resulting in an increase in the pressure loss. It was observed that as particle size increased from 𝑑𝑝 = 90 𝜇m to 270 𝜇m, the frictional pressure loss decreased by 27.9%, 47.6%, and 38.1% for constant particle volume fraction, k𝑠 , of 10%, 25%, and 40%, respectively. 3.4. Effect of In Situ Particle Volume Fraction on Frictional Pressure Loss. The presence of solid particles in the liquid phase increases the frictional pressure loss due to momentum interaction between the solids and the liquid. It is shown in Figure 8 that high particle volume fraction resulted in high frictional pressure loss as compared to low particle volume fraction. This is mainly due to high friction between particleparticle, particle-liquid, and particle-wall interactions. For instance, a percentage increase in frictional pressure losses of 106.4%, 55.8%, 59.3%, and 77.3% occurred as the in situ particle volume fraction increased from k𝑠 = 10% to 40% at a constant particle size of 90 𝜇m, 150 𝜇m, 210 𝜇m, and 270 𝜇m, respectively.
4. Conclusion The Eulerian-Eulerian two-fluid model was adopted in a three-dimensional transient simulation of slurry flow in a horizontal pipe. The particle concentration, particle velocity, and frictional pressure loss were some of the output results observed as functions of particle size and in situ particle volume fraction. The 𝑘-𝜀 turbulence model was found to satisfactorily predict the concentration profile of experimental data as compared to other turbulence models. The particle concentration profiles for fine particles were neutrally buoyant as the fluid turbulence kept the particles in suspension. The particle concentration profiles for coarse particle were primarily dependent on the in situ particle volume fraction. Particle velocity profiles for high particle volume fraction were asymmetric; nonetheless, fine particle size travelled faster than coarse particle size. Frictional pressure loss was increased for fine particle-sized slurry and decreased for coarse particle-sized slurry. Moreover, high particle volume fraction resulted in high frictional pressure loss. The study has shown that the available CFD models are capable of
Journal of Petroleum Engineering 0.410
0.277
0.370
0.246
0.330
0.216 0.185 0.155 0.124 0.093
0
20.000
40.00 (GG)
60.00
Cuttings volume fraction
0.307
0.290 0.250 0.210 0.170 0.130
0.063
0.090
0.032
0.050
0.002
0.010 20.000
0
80.00
40.00
60.00
Cuttings volume fraction
8
80.00
(GG) (a)
(b)
0.489 0.445
0.358 0.314 0.270 0.227 0.183
Cuttings volume fraction
0.402
0.139 0.096 0.052 0
20.000
40.00 (GG)
60.00
80.00
(c)
Figure 5: Contour plots of particle concentration at 𝑑𝑝 = 270 𝜇m: (a) k𝑠 = 10%, (b) k𝑠 = 25%, and (c) k𝑠 = 40%. 1.0
0.5 0.0 2.50
3.50
4.50
5.50
− 0.5 −1.0
Particle velocity (m/s) 10% 25%
40% (a)
6.50
Normal radial position, r/R
Normal radial position, r/R
1.0
0.5 0.0 2.20
3.20
4.20
5.20
− 0.5 −1.0
Particle velocity (m/s) 10% 25%
40% (b)
Figure 6: Effect of in situ particle volume fraction on particle velocity profile: (a) 𝑑𝑝 = 90 𝜇m and (b) 𝑑𝑝 = 270 𝜇m.
6.20
Journal of Petroleum Engineering
9
Frictional pressure loss (Pa/m)
5500
[4]
4500 3500
[5]
2500
[6] 1500
90
150
210
270
Particle size (G) 10% 25%
[7]
40%
Figure 7: Effect of particle size on frictional pressure loss for constant in situ particle volume fraction.
[9]
6000 Frictional pressure loss (Pa/m)
[8]
5000 4000
[10]
3000 2000
[11]
1000 0
15
10
20 25 30 35 In situ particle volume fraction ( %)
90 G 150 G
40
210 G 270 G
Figure 8: Effect of in situ particle volume fraction on frictional pressure loss for constant particle size.
satisfactorily predicting slurry flows and other hydrodynamic flows.
[12]
[13]
[14]
[15]
Competing Interests The authors declare that there are no competing interests regarding the publication of this paper.
[16]
References [1] C. Y. Wong, C. B. Solnordal, and J. Wu, “CFD modelling and experimental observations of changing surface profiles caused by solid particle erosion,” Society of Petroleum Engineers Journal, vol. 29, no. 1, pp. 61–74, 2013. [2] S. K. Lahiri and K. C. Ghanta, “Slurry flow modelling by CFD,” Chemical Industry & Chemical Engineering Quarterly, vol. 16, no. 4, pp. 295–308, 2010. [3] A. Ekambara, R. S. Sanders, K. Nandakumar, and J. H. Masliyah, “Hydrodynamic simulation of horizontal slurry
[17]
[18]
[19]
pipeline flow using ANSYS-CFX,” Industrial & Engineering Chemistry Research, vol. 48, no. 17, pp. 8159–8171, 2009. T. Nabil, I. El-Sawaf, and K. El-Nahhas, “Computational fluid dynamics simulation of the solid-liquid slurry flow in a pipeline,” in Proceedings of the 17th International Water Technology Conference, Istanbul, Turkey, November 2013. R. G. Gillies, C. A. Shook, and K. C. Wilson, “An improved two layer model for horizontal slurry pipeline flow,” Canadian Journal of Chemical Engineering, vol. 69, no. 1, pp. 173–178, 1991. J. N. Hunt, “The turbulent transport of suspended sediment in open channels,” Proceedings of the Royal Society of London A: Mathematical, Physical and Engineering Sciences, vol. 224, no. 1158, pp. 322–335, 1954. A. J. Karabelas, “Vertical distribution of dilute suspensions in turbulent pipe flow,” AIChE Journal, vol. 23, no. 4, pp. 426–434, 1977. D. R. Kaushal, Y. Tomita, and R. R. Dighade, “Concentration at the pipe bottom at deposition velocity for transportation of commercial slurries through pipeline,” Powder Technology, vol. 125, no. 1, pp. 89–101, 2002. D. R. Kaushal and Y. Tomita, “Comparative study of pressure drop in multisized particulate slurry flow through pipe and rectangular duct,” International Journal of Multiphase Flow, vol. 29, no. 9, pp. 1473–1487, 2003. D. R. Kaushal, K. Sato, T. Toyota, K. Funatsu, and Y. Tomita, “Effect of particle size distribution on pressure drop and concentration profile in pipeline flow of highly concentrated slurry,” International Journal of Multiphase Flow, vol. 31, no. 7, pp. 809–823, 2005. V. Seshadri, S. N. Singh, and D. R. Kaushal, “A model for the prediction of concentration and particle size distribution for the flow of multisized particulate suspensions through closed ducts and open channels,” Particulate Science & Technology, vol. 24, no. 2, pp. 239–258, 2006. D. R. Kaushal and Y. Tomita, “Experimental investigation for near-wall lift of coarser particles in slurry pipeline using 𝛾-ray densitometer,” Powder Technology, vol. 172, no. 3, pp. 177–187, 2007. I. C. Walton, “Eddy diffusivity of solid particles in a turbulent liquid flow in a horizontal pipe,” AIChE Journal, vol. 41, no. 7, pp. 1815–1820, 1995. E. J. Wasp, J. P. Kenny, and R. L. Gandhi, Solid Liquid Flow Slurry Pipeline Transportation, Trans Tech Publications, ClausthalZellerfeld, Germany, 1st edition, 1977. K. C. Wilson, “A unified physical-based analysis of solid-liquid pipeline flow,” in Proceedings of the 4th International Conference of Hydraulic Transport of Solids in Pipes (Hydrotransport 4 ’76), Paper A1, pp. 1–16, BHRA Fluid Engineering, Cranfield, UK, 1976. P. Doron, D. Granica, and D. Barnea, “Slurry flow in horizontal pipes-experimental and modeling,” International Journal of Multiphase Flow, vol. 13, no. 4, pp. 535–547, 1987. K. C. Wilson and F. J. Pugh, “Dispersive-force modelling of turbulent suspension in heterogeneous slurry flow,” Canadian Journal of Chemical Engineering, vol. 66, no. 5, pp. 721–727, 1988. P. Doron and D. Barnea, “A three-layer model for solid-liquid flow in horizontal pipes,” International Journal of Multiphase Flow, vol. 19, no. 6, pp. 1029–1043, 1993. A. Ramadan, P. Skalle, and A. Saasen, “Application of a threelayer modeling approach for solids transport in horizontal and inclined channels,” Chemical Engineering Science, vol. 60, no. 10, pp. 2557–2570, 2005.
10 [20] G. V. Messa and S. Malavasi, “Improvements in the numerical prediction of fully-suspended slurry flow in horizontal pipes,” Powder Technology, pp. 358–367, 2015. [21] L. Ma, C. Huang, Y. Xie et al., “Modeling of erodent particle trajectories in slurry flow,” Wear, vol. 334-335, pp. 49–55, 2015. [22] S. A. Miedema, “The heterogeneous to homogeneous transition for slurry flow in pipes,” Ocean Engineering, vol. 123, pp. 422– 431, 2016. [23] B. G. M. Van Wachem and A. E. Almstedt, “Methods for multiphase computational fluid dynamics,” Chemical Engineering Journal, vol. 96, no. 1–3, pp. 81–98, 2003. [24] M. Eesa and M. Barigou, “Horizontal laminar flow of coarse nearly-neutrally buoyant particles in non-Newtonian conveying fluids: CFD and PEPT experiments compared,” International Journal of Multiphase Flow, vol. 34, no. 11, pp. 997–1007, 2008. [25] C. K. K. Lun, S. B. Savage, D. J. Jeffrey, and N. Chepurniy, “Kinetic theories for granular flow: inelastic particles in Couette flow and slightly inelastic particles in a general flowfield,” Journal of Fluid Mechanics, vol. 140, pp. 223–256, 1984. [26] D. Gidaspow, Multiphase Flow and Fluidization: Continuum and Kinetic Theory Descriptions, Academic Press, New York, NY, USA, 1994. [27] C. Y. Wen and Y. H. Yu, “Mechanics of fluidization,” Chemical Engineering Progress Symposium Series, vol. 62, no. 62, pp. 100– 111, 1966. [28] P. G. Saffman, “The lift on a small sphere in a slow shear flow,” Journal of Fluid Mechanics, vol. 22, no. 2, pp. 385–400, 1965. [29] P. G. Saffman, “The lift on a small sphere in a slow shear flow— corrigendum,” Journal of Fluid Mechanics, vol. 31, no. 3, p. 624, 1968. [30] B. E. Launder and D. B. Spalding, “The numerical computation of turbulent flows,” Computer Methods in Applied Mechanics and Engineering, vol. 3, no. 2, pp. 269–289, 1974. [31] R. G. Gillies, C. A. Shook, and J. Xu, “Modelling heterogeneous slurry flows at high velocities,” Canadian Journal of Chemical Engineering, vol. 82, no. 5, pp. 1060–1065, 2004. [32] T. N. Ofei, S. Irawan, and W. Pao, “CFD method for predicting annular pressure losses and cuttings concentration in eccentric horizontal wells,” Journal of Petroleum Engineering, vol. 2014, Article ID 486423, 16 pages, 2014. [33] R. G. Gillies and C. A. Shook, “Concentration distributions of sand slurries in horizontal pipe flow,” Particulate Science & Technology, vol. 12, no. 1, pp. 45–69, 1994.
Journal of Petroleum Engineering
International Journal of
Rotating Machinery
Engineering Journal of
Hindawi Publishing Corporation http://www.hindawi.com
Volume 2014
The Scientific World Journal Hindawi Publishing Corporation http://www.hindawi.com
Volume 2014
International Journal of
Distributed Sensor Networks
Journal of
Sensors Hindawi Publishing Corporation http://www.hindawi.com
Volume 2014
Hindawi Publishing Corporation http://www.hindawi.com
Volume 2014
Hindawi Publishing Corporation http://www.hindawi.com
Volume 2014
Journal of
Control Science and Engineering
Advances in
Civil Engineering Hindawi Publishing Corporation http://www.hindawi.com
Hindawi Publishing Corporation http://www.hindawi.com
Volume 2014
Volume 2014
Submit your manuscripts at http://www.hindawi.com Journal of
Journal of
Electrical and Computer Engineering
Robotics Hindawi Publishing Corporation http://www.hindawi.com
Hindawi Publishing Corporation http://www.hindawi.com
Volume 2014
Volume 2014
VLSI Design Advances in OptoElectronics
International Journal of
Navigation and Observation Hindawi Publishing Corporation http://www.hindawi.com
Volume 2014
Hindawi Publishing Corporation http://www.hindawi.com
Hindawi Publishing Corporation http://www.hindawi.com
Chemical Engineering Hindawi Publishing Corporation http://www.hindawi.com
Volume 2014
Volume 2014
Active and Passive Electronic Components
Antennas and Propagation Hindawi Publishing Corporation http://www.hindawi.com
Aerospace Engineering
Hindawi Publishing Corporation http://www.hindawi.com
Volume 2014
Hindawi Publishing Corporation http://www.hindawi.com
Volume 2014
Volume 2014
International Journal of
International Journal of
International Journal of
Modelling & Simulation in Engineering
Volume 2014
Hindawi Publishing Corporation http://www.hindawi.com
Volume 2014
Shock and Vibration Hindawi Publishing Corporation http://www.hindawi.com
Volume 2014
Advances in
Acoustics and Vibration Hindawi Publishing Corporation http://www.hindawi.com
Volume 2014