EulerView: a non-hierarchical visualization component Rosario De Chiara ISISLab - Dipartimento di Informatica ed Applicazioni, Universit`a degli Studi di Salerno, Italy
[email protected]
Abstract The Treeview control is the traditional way of visualizing hierarchical information in user interfaces, but in situations such as managing bookmarks in browsers, more general classifications may be more appropriate than hierarchies. We have developed a component called EulerView which is an extension of Treeview, with a similar look and feel, addressing migration, navigation and overspecificity issues amongst 2D or 3D visualisations of classifications. It has familiar characteristics, and an underlying model, based on Euler diagrams, enabling more general classifications. We found, via user testing, that users of EulerView appear to grasp a fairly accurate internal representation of Euler diagrams and that they could organise bookmarks well within in a given classification using EulerView.
1
Introduction
The Treeview control is the traditional way of visualizing hierarchical information in user interfaces. It has a standard look and feel and it is integrated in modern programming language environments. However, in many situations such as managing bookmarks in browsers, more general classifications are more appropriate than a hierarchical one; alternative solutions proposed include polyarchies [19], for instance. Some difficulties with 2D (or 3D) visualizations occur since they require both migration from the familiar Treeview and they can introduce standard user navigation difficulties, especially if 3D navigation facilities like zooming are required. We have developed a component called EulerView which is an extension of Treeview and has a similar look and feel, addressing the migration and the navigation issues, but with familiar characteristics, and an underlying model, based on Euler diagrams to enable a more general representation than hierarchies. EulerView could replace ∗ Funded by UK ESPRC grant EP/E011160: Visualisation with Euler Diagrams.
Andrew Fish∗ School of Computing, Mathematical and Information Sciences, University of Brighton, UK
[email protected]
Treeview in any application where a hierarchical visualization can be felt as a limitation, such as managing bookmarks in browsers (or e-mail messages). We investigate, via user testing, if users of EulerView store an accurate internal representation of Euler diagrams despite only being presented with the EulerView representation. Also, we ascertain if users can organise bookmarks within a given classification (by comparison of their use of EulerView with the Open Directory project classification).
2
Hierarchies
Hierarchical visualization seems a perfectly natural way of organize and present information, both in real life and in computer applications. The main reason for this is, of course, that in real life objects can be just in one place. A real office room is the inspiration for the user interface metaphor that has been implemented, in various flavours, in computer operating systems for decades. This is a wellknown mechanism [2] in user-interface design: the human mind organizes external world information spatially in a natural way, so that a cognitive map can be seen as the internalized analogy, in the human mind, of the physical layout of the environment. By mimicking a real office where a document, a mail message, or a sheet of paper, can be placed in only one folder, a computer interface allows a file to be placed exclusively in one directory by using a mechanism called single inheritance. The desktop interface metaphor has been a success story for over 30 years and has significantly contributed in helping people to feel at ease with computers. Nevertheless, the single inheritance classification is, nowadays, often felt to be an unnecessary limitation. This restriction was, of course, perfectly understandable as a requirement in the antiquated technological infrastructures used for the design of the first file systems [18]: CPU power was a precious resource and the size of hard disk space did not allow the storage of many documents. It is interesting that single inheritance is actually felt to also be a limitation in a real world setting, as shown by the
results of a study undertaken in a real office [24]. In this study, office workers were interviewed in order to analyze the organization of the sheets, book and documents on their desks which needed to be categorized. The interviews indicate that users had difficulties in categorizing, with quotes such as “. . . the hardest problem for me organizationally is deciding what the categories are and what category something is in” and “. . . [referring to a pile of documents kept on his desktop] It’s interesting how hard it is to characterize these things - it’s almost like leaving them out means that I don’t have to characterize them. . . ”. If multiple inheritance were allowed (i.e. if overlapping categories were permitted) then at least people would have a method to categorize documents which seem to fit naturally into more than one current category. Hierarchies have been so widespread since the advent of personal computing that they are often automatically considered the natural way to organize data. We can view the transposition of single inheritance to computers as the result of inertia which still effects current user interface development. An example of the effects of this inertia is given by bookmarks in Internet browsers, which are still organized as sheets of paper inside folders. In the physical world the single inheritance is unavoidable since a sheet of paper can be just in one place; in order for it to appear in multiple places, multiple copies must be used. However, inside a computer, objects can easily appear in more than a place, but this possibility is seldom used to improve organization. For instance, in a computer there are no physical justifications to constrain a user to organize their .mp3 music files, .pdf articles files, etc, within a rigid hierarchical tree-shaped structure. Furthermore, modern computers have enough CPU power and visualization capabilities to allow users to categorize, and organize resources in less rigid structures. In our opinion, this inertia is fueled by current trends such as the standard use of the Treeview component, an example of which is shown in Figure 1. The Treeview component is the traditional way to visualize hierarchies within a vast amount of applications (especially file-related applications), and it is described in detail in the next section. To further tempt people to continue to use hierachies, there are now many different techniques to visualize hierarchies, including: the 2D node-link diagram [14], the horizontal family tree diagram [15] and the radial tree diagram [16]. Within the last decade, novel visualization methods have been developed for displaying large hierarchies, including the Treemap [14], cone tree [6], disc tree [11], hyperbolic tree [16], and 3D hyperbolic tree [23] visualizations.
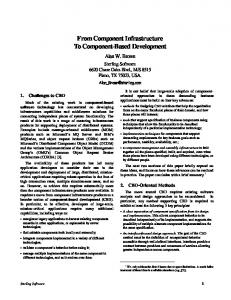
Figure 1: The Treeview visualization component under Microsoft Windows XP. (a) The standard file system view. (b) The My Computer view: specialized icons provide extra information about the items.
3
The Treeview component
The Treeview control is implemented in modern operating systems as a basic component used in user interfaces for applications. It is dubbed differently depending on the system; under Microsoft Windows it is called Treeview, whilst under Apple Mac OS it is called List view with disclosure triangle emphasizing its similarity to a Listbox. Although the Treeview control has its limitations, it has been available since the character based terminal era and is still an effective visualization technique which is suitable for a wide range of different applications. The Treeview control is supported by various languages and libraries like Java (Swing and AWT), Microsoft .NET, and Qt library. From the developer’s point of view, the Treeview control represents a standard visualization for hierarchies, and general users have had plenty of opportunity to become accustomed to it and use it in practice. Figure 1(a) shows the Treeview control under Microsoft Windows. It consists of a simple box surrounding a list of items, each of which may be annotated with a + or − sign. A + sign indicates that the item hides some information (it is shown as a leaf of the tree structure but is actually the root of a subtree); a − sign indicates that the item contains some information which is displayed (it is node of the tree and the next level of the tree is displayed). Clicking on a + sign changes it to a − sign and vice-versa, expanding or collapsing the corresponding node or tree. When the symbol is a − sign, the subtree is displayed with a slight rightward indentation emphasizing the fact that the node has been expanded. For instance, localtexmf is open showing inner elements which are indented, whilst the directory NVIDIA is closed, showing a + sign.
Usually a small folder icon is shown beside each directory name, which shows an open folder if it is the root of the current subtree, or a closed folder otherwise. This icon is often used to give further information about the node: for instance, in Windows XP Explorer specialized icons for particular directories like My Music or the Control Panel are available. In Figure 1(b), the hierarchical organization of heterogeneous items is emphasized through the use of icons. Iconicity can also be used to provide extra information about the type of an item (such as the disc drive symbols in Figure 1(b)). Treeview is typically used to browse the file system, enabling a user to choose a directory or to manage directories by allowing them to move one directory inside another. Therefore, an important feature of the Treeview component is that it allows more than one subtree to be open; this enables a simultaneous view of parallel strands of the hierarchy. For example, in Figure 1(a) the subtrees Fraps and localtexmf are simultaneously open which enables operations, like moving a subdirectory between them, to be performed. A Listbox is a “linear” visualization [21] of a list of items; that is, it is 1 - dimensional, with all of its items displayable by navigation along a single dimension. In terms of navigation, the Treeview is not linear, but neither is it 2 dimensional (in the sense of having two independent dimensions for navigation). We call the Treeview control (1+1)-dimensional since it has two directions of navigation which are not independent. The vertical direction is the primary navigation direction which can be accessed by a scroll wheel on a mouse; the horizontal direction depends upon the vertical positioning – the expansion of nodes via mouse clicks allows horizontal navigation where possible. In contrast, Euler diagrams (as shown on the right of Figure 2) are a 2 - dimensional visualization since navigation in the vertical and horizontal directions are independent (accessed via scrollbars when the diagrams become larger).
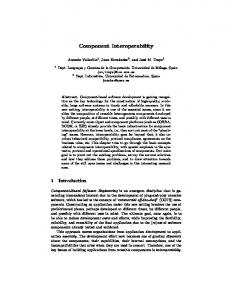
Figure 2: A mockup of (a) the EulerView component and (b) an associated Euler diagram.
4
Categorization problem
The expression categorization problem traditionally refers to the problem of determining predefined categories for an unlabeled document. Traditional automatic solutions for this problem are often developed using neural networks or support vector machines. However, we wish to aid human users in solving the categorization problem rather than providing them with automatically generated solutions. This human-based instance of the problem needs to be addressed every day by PC users with new email, documents, .mp3 music, etc. The limitations of the usefulness of hierarchies in categorizing information are demonstrated by the categorization of web sites within a huge ontology. The Open Directory Project (ODP) is the most comprehensive human-edited directory of the Web. It is constructed and maintained by a vast community of authors. Open Directory is a web directory, which is a directory of categorized web links. This differs from a search engine because it is built by users; editors look for the most appropriate subtree in the ODP directory in which to place a particular link to a website, and they provided a short resume of the contents of the corresponding website. The ODP goal is to provide a structure capable of containing and categorizing all of the websites that are available on the Internet. The ODP solution to the categorization problem is to use symbolic links between categories in order to allow the content of a subtree, corresponding to a category, to appear under an unlimited number of other subtrees. Symbolic links are an ad-hoc solution which can loose some of their appeal if the structure is much more complex than a simple hierarchy. For example, in the ODP hierarchy, the category “Art” contains a multitude of symbolic links to other subtrees spread along the hierarchy. In fact, the ODP hierarchy contains more than 630, 000 different topics and more than 700, 000 symbolic links. This suggests that the use of symbolic links is not a method which is used to manage a few complex categories, but their deployment is actually systematic and is necessary in order to describe the general categorization structure. We conclude that categorizing information requires something more expressive than a hierarchy. The categorization process can be viewed as the process of assigning tags to items. We describe a few possible methods of assignation. Hierarchy: one category. A hierarchy is used to represent the directories of a file system (or categories in ODP) and can be represented by a single rooted tree. Consider the directory names as the tags which are used to categorize information kept in files. In a hierarchical file system, only one such tag can be assigned to a file, because a file can be just in one node of the tree. Polyarchy: more than one hierarchy. More complex un-
derlying structures can be modelled by Polyarchies which are multiple intersecting hierarchies. In [19], Polyarchies are defined and visualization methods to try to raise the user’s awareness of the structure of the polyarchy are provided. Considering a Polyarchy as a categorization structure we can easily see how an element can have more than one tag attached to it – such elements will be part of various overlapping hierarchies, each of which assigns a tag to the element. In [17], polyarchies are viewed as edge coloured multigraphs; effectively they can be thought of as the union of trees, each corresponding to a single hierarchy. Traditionally, the representational abilities of hierarchical visualizations are extended using symbolic links, and although you could view a polyarchy as an instance of a hierarchy extended with symbolic links, it seems more appropriate to accept and incorporate the complexity of the categorization problem into one’s underlying model, and work with the more general structures. Using Metadata: tags where needed. Metadata is data about data. In the file system context, metadata are particular fields of information kept in a structure that permits querying, in order to assemble “virtual directories” of files on-the-fly, for example. The metadata approach is implemented in various solutions [1]. Euler diagrams: more than one category. Euler diagrams are a well known, intuitive method of representing certain relationships between sets. Traditionally, simple closed curves in the plane (usually labelled) are used to represent sets and the spatial relationships between curves (intersection, containment and disjointness) are used to represent the corresponding set-theoretic relationships. One of the reasons that they are said to be an effective representation is that these spatial relationships are well-matched to the corresponding domain relationships they represent [8]. In the file-system context, the sets are the categories and one can represent sub categories, intersections between categories, and disjointness of categories. Thus they allow a user to categorize into categories that are not necessarily disjoint (i.e. they allow multiple inheritance). As well as enabling easier initial categorization, if a user has two separate classifications and the desire to merge them (e.g. merging favourite lists from different browsers or different computers) then it becomes feasible to do this easily, since categories from one classification do not need to be disjoint from categories in the other. The V ENN FS project [3] developed a tool which enabled users to create and manipulate Euler diagrams in order to improve the organization of their files; users could draw conceptual maps of their interests, placing files in sets with the usual drag and drop mouse mechanism. Placing an element inside a region bounded by the curves naturally associates the element with one or more tags (the number determined by the number of curves “containing” that region).
These are actually Spider diagrams [10], one of many extensions (and variations) of Euler diagrams, where dots depict elements of sets and shading can be used as an alternative method of specifying emptiness (instead of disjointness). One difficulty with Euler diagram based languages is the common visual langauge problem of overspecificity [20]: if you wish to represent information about a set then you have to specify its relationship with all of the other sets which are already represented. If a large number of curves (or a large number of items densely packed together within a region) are present in a diagram then this can also lead to the diagram being cluttered (see [13] for a formal definition of clutter of Spider diagrams and empirical evaluation justifying the measure). One approach to try to address this visualisation problem is to introduce projections, as in [7, 12], which enable the specification of relationships within a specific context.
Figure 3: An Euler diagram (a) corresponding to a polyarchy (b).
Any polyarchy can easily be represented as an Euler diagram, by taking one diagram for each hierarchical tree and conjoining them. An example is shown in Figure 3. Combining two hierarchies into one Euler diagram (rather than two, as shown) is possible, and could be achieved by various means, such as by using coloured curves, where the disjointness constraints caused by disjoint curves are only enforced amongst curves of the same colour; this is one method to overcome the overspecificity problem.
5
The EulerView component
The EulerView control was designed with the intention of enabling the common user to easily capture the naturally non hierarchical organization of data in their daily computer use. In order to avoid any user difficulties due to migration from the standard Treeview control, the EulerView control is just an extension of the Treeview control (see Figure 4 for example). We extend the hierarchy of a Treeview control into a non hierarchical structure by using the power of the Euler diagram model. Viewing large models with a 2 (or 3) dimensional representation may require user-navigation in two dimensions (via scrollbars for instance) and possibly a third dimension if the user needs to zoom in/out of categories of interest which contain a large number of files; this can lead to disorientation. To overcome potential navigation difficulties we developed the EulerView component as a (1 + 1)-dimensional visualization of Euler diagrams.
Figure 2(a) shows the EulerView control and Figure 2(b)
Figure 4: The EulerView control prototype running within the Internet Explorer browser.
shows a corresponding Euler Diagram: Set A and Set B in the diagram form an intersection Set A & Set B, as coherently shown in the EulerView, and the Set D is displayed within Set A & Set B. A user can build an Euler diagram using the EulerView control (although only the EulerView is normally displayed in the current prototype). Figure 5 shows the creation, and population, of an intersection starting from two sets: dragging Set A over Set B in (a) gives the option of creating the intersection Set A & Set B (shown in (b) where the icon, as well as the label, shows clearly that it is an intersection); adding an item, marked with a shaded square, to the intersection causes the creation of two links, marked by hollowed squares, in the corresponding sets, Set A and Set B (shown in (c)). The creation of subsets is similarly
Figure 5: Creating and populating overlapping categories with EulerView.
achieved and since the drag and drop mechanism is used
in both cases, when one set label is dragged over another set label a menu is presented to the user to choose which operation to perform. Iconicity is used to give consistent information about the relationship of the set with other sets in the data structure. In Figure 5(b) the single circle icon beside Set A indicates that “inside Set A” is a zone (i.e. there are no sets in the data structure contained just within this set), whilst the icon beside Set A & Set B indicates an intersection between two (or more) sets. Figure 2(a) shows two other types of icons associated to sets: the two concentric circles icon beside Set A indicates that there is at least one subset “inside Set A” within the data structure, whilst the icon beside Set A & Set B means that there is at least one subset in the data structure which is completely within this intersection. The EulerView control is implemented using the C# language, which is an object oriented language developed by Microsoft which runs over the .NET Framework (a software infrastructure similar to Java Virtual Machine). Microsoft provides various tools to allow a smooth integration of developed features, such as the EulerView control. In particular using the .NET Framework through the C# language enabled us to extend the Internet Explorer’s user interface easily. The EulerView control is implemented inside a BandObject control, so a BandObject is a child window within the Internet Explorer window. The user can interact with it right beside the browsing window. Showing or hiding BandObject can be directly managed within the Internet Explorer menu bar. A byproduct of extending BandObject is that this extension is also available within the Explorer window (which is oriented towards file system operations). This feature implies that the whole set of functionalities provided by EulerView is available not only to manage Internet bookmarks, but also to manage the files present on the filesystem. EulerView extends Treeview in the following key ways: • Set manipulation: the drag and drop of set labels enables the user to choose whether to create a subset or an intersection. A strict runtime control is performed to check the consistency of the diagram by disallowing certain node move operations that would violate the underlying Euler diagram model. For instance, Set A cannot be placed inside the intersection Set A & Set B. • Item manipulation: dragging an item into an intersection coherently creates symbolic links to the item in the relevant places. • Renaming: renaming a set invokes an automatic rename of all of the relevant set intersections, but in order to keep consistency, one cannot rename an intersection itself (whose label is determined by the labels of the sets involved in the intersection). • Coloured items: one may colour categories in order to
provide a visual classification. On the creation of an intersection among two categories, the two colours are coherently blended in the intersection label.
6
Usability test
We wished to determine if the use of the (1 + 1)dimensional visualization enabled the users to appreciate the underlying Euler diagram model (see [9] for a discussion of internal and external representations), and also whether EulerView was fit for its intended purpose of use in applications such as bookmark organization. Therefore we investigated the hypotheses that: 1. When using EulerView, users are able to keep an accurate internal visualization of the underlying 2D Euler diagram model, without the need for an external representation of the diagram. 2. EulerView is effective for the purpose of organizing bookmarks. The participants for the user tests were 16 students from the second and third years of the Computer Science classes at the ISISlab, with ages ranging from 21 to 26. They possessed prior knowledge of web navigation and browser functions. During the tests the users were not directly monitored, so that they could feel free to test and explore the system, but they could call for assistance if they did not understand any of the instructions posed. The experiment was performed in an isolated environment within the lab in order to avoid distractions due to the presence of other people. Each participant was provided with a laptop with external mouse and the desks were clear except for the test sheets and a pen. Subjects were guided through a series of tasks, separated into two phases according to the two hypotheses. Users were also encouraged to provide informal feedback (such as suggestions or observations for developers). Phase A [familiarization and internal representation] Subjects were asked to perform a series of guided tasks which served as a familiarization of the EulerView user interface and its functionalities. First of all, users were asked to organize a corpus of pre-selected bookmarks. The pre-made selection contained websites whose contents were overlapping. For example, there were websites talking about both hardware and software in order to emphasize the need for an overlapping category of bookmarks named “Hardware & Software”. The tasks to be performed were quite straightforward, exploiting the subjects’ previous knowledge of the traditional way to manage bookmarks, and then extending this knowledge by introducing the ability to manage intersections between categories. Then the user was asked to perform 19 different operations covering the entire range of functionalities provided by EulerView, such as: create a new category, drag & drop a bookmark into a category, and create an intersection of two categories.
Figure 6: Usability test - Phase A: A user-constructed traditional 2-dimensional Euler diagram (on the right) corresponding to the EulerView control content (on the left).
After the user has performed all of these tasks (so they had inserted all of the bookmarks and created all of the desired categories), we asked them to draw a traditional 2dimensional representation corresponding to the EulerView representation. This test allowed us to quantitatively measure how accurately the users link the EulerView control with its underlying model (a traditional Euler diagram). The right hand side of Figure 6 shows an example of a userconstructed drawing corresponding to the EulerView control on the left. The correspondence between categories in the EulerView and in the Euler diagram has been emphasized for the sake of clarity. Phase B [effectiveness for managing bookmarks] We prepared a test set of bookmarks, extracted from an ODP subtree, which included bookmarks belonging to categories present in a symbolic link (i.e. bookmarks belonging to the intersection of two or more subtrees of the ODP hierarchy). Together with the bookmark test set (of 21 items) we provided a predetermined EulerView control keeping a specific Euler diagram model, and asked the user to insert the bookmarks. The test set was presented to the users with the web site title hidden behind a single letter, as shown in Figure 7. This forced the user to surf the links in order to understand in which category to insert the bookmark, as opposed to simply categorizing according to the title of the website. Results. The operation of passing from the EulerView control to the 2-dimensional Euler diagram representation has been correctly carried out for more than 71% of the categories (on average). This indicates a reasonable level of accuracy of the storage of an internal model together with the ability to transfer this to an external representation. In phase B we investigated user placement of bookmarks in a EulerView categorization, where the categories corresponded to ODP categories, so that we could check
consistency of user placement with EulerView and the ODP placement. The result of this phase showed that about 88% of the bookmarks have been correctly placed, indicating a high level of consistency between a quick single user classification with EulerView and a slow multiple user classification within ODP. User feedback indicated that the users perceived EulerView as a graceful expansion of the features of a traditional Treeview control, considering the EulerView control intuitive, even in the less usual tasks such as creating an intersection between two categories. One area requiring further investigation is to ascertain the user’s perception of the consistency of each categories icon, which changes according to content (see Figure 2(a)); some users only noticed the change after several operations, but actually the label also indicated the sets which comprise the intersection.
7
Conclusions & Discussion
The problem of how to facilitate user categorization for bookmark or file management is a difficult one. The traditional categorization using hierarchies can be prone to limitations due to single inheritance problems (that is the constraint of having just one tag associated to every item). When a more complex categorization is essential, such as in the ODP, hierarchies can be extended using symbolic links, or polyarchies are used to help visualize multiple intersecting hierarchies. Alternative visualization methods are available [22] to help with the exploration of multidimensional (that is, multiple tags) information. A limitation of these techniques is that they need a complex interface that
Figure 7: Usability test - Phase B: Comparing the ODP classification (left), with the user’s EulerView organization (right).
is not likely to be easily embedded in traditional applications (such as a web browser), and they will be unfamiliar and may require a relatively long training period of time for new users. EulerView has been developed with the purpose of facilitating the visualization and management of information by general users. It extends the hierarchical visualization of Treeview, keeping a (1 + 1)-dimensional non-invasive interface that can be easily embedded in an Internet browser. Using an underlying Euler diagram based model enables the use of overlapping categories, whilst keeping a similar look and navigational structure of the standard Treeview aids in migration. The main intention of the experimental studies performed was to give an indication of the usefulness of the EulerView component for the purpose of quick single-person bookmarking (by comparison with the slow multiple-person bookmarking in the ODP), as well as to investigate the necessity of offering 2D representations together with the EulerView control. Results and user feedback suggest that EulerView is perceived as an easy to use extension of the Treeview control, and that users seem to be able to perform accurate quick bookmarking, whilst storing a fairly accurate internal representation of the underlying Euler diagram model. One future avenue for assessing the practical usefulness of EulerView will be by user-comparison of the EulerView performance with other categorization methods (such as Treeview with symbolic links, polyarchies, etc). Further testing is also required to investigate how the EulerView interface performs upon scaling (i.e when handling large amounts of information). Some features in EulerView that are rather effective for the small scale, such as the iconicity, are not likely to scale well as the number of set intersections increases. Some possibilities for future versions of EulerView include: extensions of the icons, such as numbering or colouring to indicate depth of subtrees; an option to display the entire subtree as an Euler diagram (although this is likely to be useful only when the data structures are broad but not deep, since the deeper they become the more complex the Euler diagram icon will become). As well as the direct application to file management systems, another merit of our work is the introduction of (1 + 1)-dimensional representation of Euler diagrams. As with may visual languages, Euler diagrams can be considered both at an abstract level (which is effectively a settheoretic notation for Euler diagrams) and at a concrete level consisting of the drawn diagrams. Automated reasoning systems [5] based on such diagrams perform computations at this abstract level, but if one wishes to display a proof to a user then either drawn diagrams must be generated (which is not always easy, or even possible sometimes [4]), or this abstract description can be displayed. However, needing to change representation and display tex-
tual information is not satisfactory. In EulerView we essentially display a structured visualization of the zones of a diagram, which is effectively a visualization of an abstract diagram; this is partway between the formal textual list of zones and a full diagrammatic view of the Euler diagram. This gives a deeper insight into the structure of the model without the complexity of a full diagrammatic representation in a plane (here we are referring to the computational complexity of drawing diagrams, whereas the complexity in terms of user perception is an issue requiring empirical studies). Furthermore, using this representation completely overcomes the issue of overspecificity in the 2 dimensional system. We suggest that the use of such (1 + 1)-dimensional representations which can be viewed as a graphical representation of abstract level diagrams could also act as a “migration stepping stone” to 2D and 3D representations. Currently we suppress any 2D visualizations, but in future versions of the EulerView control we will allow the creation and display of the 2D Euler diagrams as well, and enable the automatic conversions between both views. This allows the use of whichever representation the user finds most appealing for their task at hand, and can help in addressing any problems in relating the different representations. The use of features such as projections (which reduce the number of set intersections that need to be displayed) are likely to aid in improving the 2D visualization techniques, especially when considering larger scale systems. Furthermore, automatic translation between other relevant data structures, such as polyarchies, could be incorporated, whenever possible and desirable.
References [1] Apple spotlight technologies. http://www.apple.com/macosx/features/spotlight. [2] C. Chen and M. Czerwinski. From latent semantics to spatial hypertext - an integrated approach. In Proceedings of the Ninth ACM Conference on Hypertext and Hypermedia (Hypertext ’98), pages 77–86. ACM Press, 1998. [3] Rosario De Chiara, Ugo Erra, and Vittorio Scarano. VennFS: a Venn Diagram File Manager. In Proc. of the Seventh International Conference on Information Visualisation, IV 2003, 16-18 July 2003, London, UK, pages 120–126. IEEE Computer Society Press, 2003. [4] J. Flower and J. Howse. Generating Euler diagrams. In Proceedings of Diagrams 2002, pages 61–75. Springer, 2002. [5] Stapleton G., Masthoff J., Flower J., Fish A., and Southern J. Automated theorem proving in euler diagram systems. Journal of Automated Reasoning, to appear, 2007. [6] G. G. Robertson and J. D. Mackinlay and S. K. Card. Cone Trees: Animated 3D Visualizations of Hierarchical Information. In Proc. of CHI-91, pages 189–194, New Orleans, LA, 1991. [7] J. Gil, J. Howse, and E. Tulchinsky. Positive semantics of projections. Journal of Visual Languages and Computing, 13(2):197–227, April 2001. [8] C. Gurr. Effective diagrammatic communication: Syntactic, semantic and pragmatic issues. Journal of Visual Languages and Computing, 10(4):317–342, 1999.
[9] Mary Hegarty. Diagrams in the mind and in the world: Relations between internal and external visualizations. In Diagrammatic Representation and Inference: proceedings of Diagrams 2004, volume 2980 of Lecture Notes in Computer Science, pages 1–13. Springer, 2004. [10] J. Howse, G. Stapleton, and J. Taylor. Spider diagrams. LMS Journal of Computation and Mathematics, 8:145–194, 2005. [11] Chang-Sung Jeong and Alex Pang. Reconfigurable disc trees for visualizing large hierarchical information space. In Proceedings of the 1998 IEEE Symposium on Information Visualization, pages 19–25. IEEE Computer Society, 1998. [12] C. John. Reasoning with projected contours. In Diagrammatic Representation and Inference: proceedings of Diagrams 2004, volume 2980 of Lecture Notes in Computer Science, pages 147–150. Springer, 2004. [13] Chris John, Andrew Fish, John Howse, and John Taylor. Exploring the notion of clutter in euler diagrams. In Proceedings of Diagrams 2006, International Conference on the Theory and Application of Diagrams, LNAI 4045, pages 267– 282, 2006. [14] Brian Johnson. TreeViz: treemap visualization of hierarchically structured information. In Proceedings of the SIGCHI conference on Human factors in computing systems, pages 369–370. ACM Press, 1992. [15] Donald E. Knuth. Fundamental Algorithms, volume 1 of The Art of Computer Programming, pages 308–316. AddisonWesley, third edition, 1997. [16] John Lamping and Ramana Rao. Laying out and visualizing large trees using a hyperbolic space. In ACM Symposium on User Interface Software and Technology, pages 13–14, 1994. [17] Michael J. McGuffin and M.C. Schraefel. A comparison of hyperstructures: Zzstructures, mspaces, and polyarchies. In Proceedings of the fifteenth ACM conference on Hypertext and hypermedia, pages 153–162. ACM Press, 2004. [18] D. M. Ritchie. The evolution of the UNIX time-sharing system. BSTJ, 63, 8:1577–1594, 1984. [19] George Robertson, Kim Cameron, Mary Czerwinski, and Daniel Robbins. Polyarchy visualization: visualizing multiple intersecting hierarchies. In Proceedings of the SIGCHI conference on Human factors in computing systems, pages 423–430. ACM Press, 2002. [20] Atsushi Shimojima. Inferential and expressive capacities of graphical representations: Survey and some generalizations. In Diagrammatic Representation and Inference: proceedings of Diagrams 2004, volume 2980 of Lecture Notes in Computer Science, pages 18–21. Springer, 2004. [21] Ben Shneiderman. The eyes have it: A task by data type taxonomy for information visualizations. In VL ’96: Proceedings of the 1996 IEEE Symposium on Visual Languages, page 336. IEEE Computer Society, 1996. [22] Anselm Spoerri. Infocrystal: a visual tool for information retrieval & management. In ”CIKM ’93: Proceedings of the second international conference on Information and knowledge management”, pages 11–20. ACM Press, 1993. [23] Tamara Munzner. Exploring Large Graphs in 3D Hyperbolic Space. IEEE Comput. Graph. Appl., 18(4):18–23, 1998. [24] Thomas W. Malone. How do people organize their desks?: Implications for the design of office information systems. ACM Trans. Inf. Syst., 1(1):99–112, 1983.