communication in various road settings through field trials. Annette Böhm ... Abstract â Future cooperative Intelligent Transport Systems. (ITS) applications aimed ...
Böhm, A., K. Lidström, M. Jonsson, and T. Larsson, “Evaluating CALM M5-based vehicle-tovehicle communication in various road settings through field trials,” The 4th IEEE LCN Workshop On User MObility and VEhicular Networks (ON-MOVE), Denver, CO, USA, Oct. 2010.
Evaluating CALM M5-based vehicle-to-vehicle communication in various road settings through field trials Annette Böhm, Kristoffer Lidström, Magnus Jonsson and Tony Larsson CERES (Centre for Research on Embedded Systems) Halmstad University, Halmstad, Sweden {Annette.Bohm, Kristoffer.Lidstrom, Magnus.Jonsson, Tony.Larsson}@hh.se http://www.hh.se/ide
Abstract – Future cooperative Intelligent Transport Systems (ITS) applications aimed to improve safety, efficiency and comfort on our roads put high demands on the underlying wireless communication system. To gain better understanding of the limitations of the 5.9 GHz frequency band and the set of communication protocols for medium range vehicle to vehicle (V2V) communication, a set of field trials with CALM M5 enabled prototypes has been conducted. This paper describes five different real vehicle traffic scenarios covering both urban and rural settings at varying vehicle speeds and under varying line-of-sight (LOS) conditions and discusses the connectivity (measured as Packet Reception Ratio) that could be achieved between the two test vehicles. Our measurements indicate a quite problematic LOS sensitivity that strongly influences the performance of V2V-based applications. We further discuss how the awareness of these context-based connectivity problems can be used to improve the design of possible future cooperative ITS safety applications. Keywords – V2V communication, VANET, IEEE 802.11p, CALM M5, empirical study, field measurements.
I. INTRODUCTION One major goal of future Intelligent Transport Systems (ITS) is to improve safety, efficiency and comfort on our roads. The introduction of wireless communication technology offers great potential for future ITS safety applications. Through the exchange of information on the state of the vehicle (e.g. its speed and position) or detected events (like traffic jams, icy road surfaces etc.) to surrounding vehicles, drivers can be warned of hazardous traffic situations, increasing their chances to react properly and avoid potentially severe traffic accidents [1][2]. This concept of cooperative awareness puts high demands on the underlying wireless communication system. A vehicle needs to broadcast relevant information to other traffic participants in its surroundings with low delay and a high success rate in packet delivery. As road networks – in both urban and rural environments – offer far from ideal, obstaclefree radio conditions, these requirements are very difficult to meet. Low- to medium-range wireless communication standards for vehicle-to-vehicle (V2V) and vehicle-to-infrastructure
(V2I) are currently under development. IEEE 802.11p [3], an adaptation of the physical and MAC layer of the IEEE 802.11 WLAN standard, constitutes, together with a set of upper layer protocols, the WAVE (Wireless Access to Vehicular Environments) protocol suite. A dedicated 10 Hz frequency channel has recently been specifically allocated for ITS safetyrelated transmissions. CALM (Continuous Air interfaces-Long and Medium Range) [4] is an ISO-approved framework for packet-switched communication in mobile environments and is supported by the development of several standards (e.g. IEEE 802.11p, IEEE 802.15 or the 2G/3G/4G cellular network). The substandard CALM M5 describes the medium range part of the framework based on IEEE 802.11p. Apart from output power and dedicated bandwidth, the physical layer properties of IEEE 802.11p are a copy of 802.11a, developed for much lower mobility and more stable channel conditions than present in a vehicular network. The 10 MHz frequency channel (compared to 20 MHz in 802.11a) makes the WAVE technology more vulnerable to multipath effects, further deteriorating the signal quality. One of several major projects concerned with the development, integration and implementation of CALMrelated standards and technologies is the EU 6th Framework Programme funded CVIS project (Cooperative VehicleInfrastructure Systems) [5]. Within CVIS a CALM prototype platform was developed and two of these platforms were used to conduct the field trials described in this paper. The main objective of this field study was to get real world experience of the connectivity that can be achieved between the two test vehicles in various settings using the CALM M5 card and 5.9 GHz antenna developed in the CVIS project. As many ITS safety applications are based on a common understanding of the traffic situation and road environment amongst all vehicles in a larger geographic area, it is vital to understand how the realistic transmission range of such a communication system varies with changes in the surroundings, and thereby in the channel characteristics. We conducted measurements in both urban and a variety of rural settings at different vehicle speeds. Physical layer channel measurements to assess parameters like Doppler spread or frequency shift in 802.11p-based V2V communication equipment in the 5.9 GHz range have been conducted by Tan et al. [6]. Data from multiple locations were gathered but not presented and analyzed separately as the
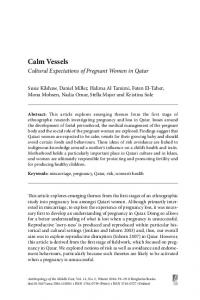
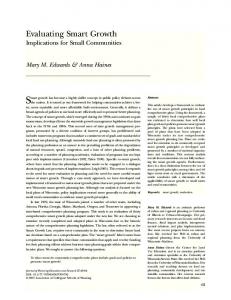
authors focused on a general understanding of the channel impairments on average. They conclude that the proposed standard is subject to potentially high error rates, especially for larger packets. In [7], the received power over a transmitterreceiver distance of 0 - 1000 m for 5.9 GHz V2V communication was studied in urban and rural field experiments. A rapid drop in received power at around 750 m corresponds to our findings for open road setting with constant LOS between the communicating vehicles. Empirical experiments with the CVIS platform used in this paper were conducted by Grau et al. [8]. The received signal strength under LOS and NLOS conditions in highway, urban and rural settings are logged while both vehicles drive in the same direction at low speed and at a distance below 100 m. A common purpose of most field measurements conducted with V2V communication equipment is to get real world input for the development of suitable channel models. In this paper, our aim is rather to evaluate the measurements results from an application point of view. Further, we isolate measurement data from particularly interesting road sections and distinguish between driving directions (when the receiving vehicle is moving towards or away from the transmitting vehicle) which enables a more fine-grained evaluation of the test results. The rest of this paper is organized as follows: Section II provides details on the measurement setup. In section III we introduce and motivate the choice of test sites and scenarios. The actual results of the measurement campaigns are presented in Section IV, while conclusions are drawn in section V. II. FIELD MEASUREMENT SETUP Below, we introduce the hardware components of the CVIS platform and the software package used for data packet transmission and logging of the measurement results. Further, details on the data visualization and analysis are provided. A. System overview Measurements were performed using a vehicle-to-vehicle prototyping platform developed within the European CVISproject [5]. The CVIS platform allows rapid prototyping of cooperative vehicle-infrastructure applications and is largely based on open-source software components. Although the scope of the CVIS-project includes for example back-end systems and application lifecycle management, the components utilized in our measurement platform were limited to those necessary for direct V2V communication. Figure 1 gives an overview of the used CVIS hardware components used for the measurements; they consist of a computing platform, hereafter referred to as an eBox, and a roof-mounted shark fin antenna pod connected to a PCI sensor board mounted in the eBox. The CVIS antenna pod contains individual antennas for the different wireless access technologies specified in the CALM ISO standard [4]. The antenna pod (pictured without radome in Figure 2) includes antennas for CALM M5, CALM 2G/3G, DSRC, WLAN and GPS. In our measurements only the
Figure 1: CVIS eBox (left) and antenna pod (right).
CALM M5 and GPS antennas were connected for V2V communication and positioning respectively. The CVIS antenna radiation pattern for M5 communication is close to isotropic according to measurements by Jensen and Gamage [9]. The PCI sensor board developed within the CVIS project contains connectors for CALM M5, WLAN and GPS antennas. Two on-board Atheros radio chips are used for M5/WLAN communication. Additionally a GPS receiver, an accelerometers and a gyro are mounted on the sensor board. Sensor signals are made available as device files within the Linux operating system running on the eBox and a modified version of the open-source MadWifi driver is used for CALM M5 communication via the Atheros chipset. Although the CALM standard contains provisions for handling multiple wireless access technologies and the vertical hand-over between these, the multiple carrier functionality was disabled for our M5 tests. For positioning purposes the GPS signal was used without fusing it with inertial sensors as the positioning accuracy was deemed sufficient in relation to the types of obstacles and phenomena encountered in the various measurement scenarios. The software package RTMaps [10] was used to create packet-generators and loggers on both the receiving and transmitting vehicle. Within the CVIS project RTMaps is used to fuse sensor data from the sensor board before delivering it via a TCP socket to the higher level application framework (FOAM). A graphical component-based interface is used which allows components written in C to be connected together to form higher level functions called RTMaps
Figure 2: CVIS antenna pod without radome.
diagrams, for example in order to fuse accelerometer data with GPS data. In our measurement campaign a transmitter and receiver RTMaps diagram were constructed. The transmitter diagram contains a counter component which periodically increments an integer variable which in turn is used as a packet identifier. Packets were sent using UDP multicast and therefore no acknowledgements were used. For each outgoing packet a log entry is created on the transmitter that contains packet identity, timestamp and transmitter location. A similar log is created on the receiver side where the packet identity, time and location of the receiver are logged for each incoming packet. Additionally the receiver logs its position at 2Hz regardless of incoming packets, so as to have a record of the receiver position also during link failures. The clocks of the two nodes were synchronized to the GPS time signal. Configurable parameters and their values are summarized in Table I. TABLE I: Parameters used for measurement campaign Parameter TX Power Frame size Packets/s Data rate
Value 17dBm 94 byte 500 “auto”
B. Data analysis and visualization Both transmitter and receiver logs are downloaded after the measurement campaign has been completed. A MatLab script has been implemented that extracts packet-reception rate (PRR) by comparing the transmitter and receiver log files and then produces visualization data in KML format for viewing in GoogleEarth. For each 20 meters that the receiving vehicle moves, the ratio between packets received by the receiving vehicle and packets sent by the transmitting vehicle is calculated and output as a polygon in KML format. . The base of the polygon is defined by the line from (x(t0), y(t0)) to (x(t0+t20), y(t0+t20)) where [t0, t0+t20] is a time interval in which the receiver has travelled 20 meters and (x(t), y(t)) is the position of the receiving vehicle at time t. The height of the polygon is defined as PRR⋅k + m, where m = 10 m and k = 100 m and its color ranges from red (PRR = 0) to green (PRR = 1). Measurement data series of particular interest (as e.g. data from a specific road section or driving direction) were filtered out from the raw data set semi-manually with the help of time stamps, map and position data and visualized in MatLab. This enabled us to tightly couple the test results not only to the actual physical site but also to our notes about observations (road traffic or other mobile obstacles, changes in weather conditions etc.) that might lead to variations in the logs for a certain test site. III. CHOICE OF REPRESENTATIVE TEST SITES Various types of cooperative ITS safety applications assume sufficient connectivity between the cooperating vehicles to
© 2009 Google, Map Data © 2010 Lantmäteriet/Metria (used with permission I210/0061)
Figure 3: Measurement sites around Halmstad, Sweden.
exchange data over reasonable distances. The choice of the 5.9 GHz frequency band for V2V communication makes this a challenging task. The objective of the field measurement campaigns presented in this paper is to test the CALM M5 based prototype in a series of real world scenarios and settings, in order to gain insight into its limitations and draw conclusions on the possible impact on the design choices of future traffic safety applications. We study how the connectivity varies with inter-vehicle distance, maintaining unbroken LOS and how limited LOS (e.g. due to buildings or vegetation) or NLOS affect the percentage of successfully received packets. A total of five test sites in and around the city of Halmstad, Sweden were chosen (details are given below): Setting 1: Open, straight road Setting 2: Highway Setting 3: Urban environment Setting 4: Rural environment - steep crest Setting 5: Rural environment - curve with vegetation Settings 1-4 were visited in a 2-day test campaign in late winter under normal weather conditions (no snow, rain or fog). The measurements at setting 5 were conducted in May when the vegetation along the test site was sufficiently dense for our purposes. Even that day, weather conditions were normal with no precipitation but with strong winds creating considerable movement in the vegetation along the test road. Setting 1: Open, straight road While settings 2-5 were aimed to test the equipment under specifically challenging circumstances, setting 1 was simply chosen to produce a basic data set for comparison. The open space of a harbor area provided us with a straight, open road with unlimited LOS. The position of the transmitting vehicle was fixed and the test track was about 1 km long, i.e. the receiving vehicle drove away from the stationary transmitter, turned after ca. 1000 m and returned. This procedure was repeated several times to collect a number of data sets. The speed of the receiving vehicle was around 50 km/h. In the harbor area very light traffic was observed during the measurement campaign.
Setting 2: Highway The behavior of the system at high relative velocities was investigated on a straight highway section. Here, both transmitting and receiving vehicle were mobile at a velocity of ca. 120 km/h, respectively, giving us the opportunity to study the effects of a relative speed of 240 km/h on the transmission ranges and packet drop rates of the vehicles. The two test vehicles were driving towards each other with basically unbroken LOS. Setting 3: Urban environment An inner-city neighborhood with 3-5 story houses and a regular street grid was chosen as a suitable urban setting. On two sides, the test site was open to a wide river and a park, respectively, while the rest of the test streets were lined by buildings and parked vehicles. By keeping the transmitting vehicle stationary on several predefined spots along the streets for each test run by the receiving vehicle around the blocks, the radio environment in large parts of the environment could be mapped. The velocity of the receiver was kept between 10 and 30 km/h. Setting 4: Rural environment – steep crest Crests and even slight elevation in the road impair the driver’s ability to detect on-coming traffic. If a cooperative ITS safety application should improve this situation, radio contact prior to visual contact is required. Setting 4 is a steep crest along a smaller rural road. Both measurements with a stationary transmitter and with two mobile vehicles were conducted. In the first case, the transmitting vehicle was positioned on the foot of the crest while the receiver drove back and forth over the crest, recording the quality of the connectivity. The distance between the stationary vehicle and the hill top was approximately 150 m. In the second case, both vehicles were approaching each other from either side of the crest. Vehicle speeds were kept under 20 km/h. Setting 5: Rural environment – curve with vegetation Setting 5 was chosen to investigate another type of visual obstacle that might keep a driver from detecting an on-coming vehicle in time. A curve turning softly at an angle of about 90 degrees with sheer vegetation (sparse trees and shrubberies with moderate foliage) impairing the LOS was chosen to represent this rural road scenario. The transmitter was kept stationary about 100 m from the curve while the speed of the mobile receiver was kept intentionally low at walking speed or below. IV. MEASUREMENT RESULTS AND EVALUATION The levels of connectivity between transmitting and receiving vehicle over each entire day of the measurement campaign are visualized as a time series in GoogleEarth. Snap shots are shown in figures 4, 9, 10 and 13 below. A yellow pin depicts the transmitter position, while each green/red bar shows how the receiver moves along the test track over time. The height
of the bar shows how the packet reception ratio varies from 0 to 100 % depending on the distance from the transmitting vehicle. To study the behavior of the communication system further, particularly interesting parts of the measurements were filtered out from the raw data set and visualized in MatLab. In that way, data from a specific road section, driving direction etc. could be isolated and compared. The results for each scenario are shown below. We introduce the following definitions: Run - For measurements with fixed transmitter, one run is the time span from when the receiving vehicle leaves the transmitting vehicle, passes a turning point and returns to the transmitter. For measurements where both transmitter and receiver are mobile, one run starts when both vehicles start driving towards each other and stops when they reach the other’s starting point. Packet Reception Ratio (PRR) - For a time interval (e.g. one second), the PRR states the ratio between correctly received packets and the total number of transmitted packets. The PRR is given in percent. B. Evaluation At each test site data was collected during several runs where similar conditions (test vehicle speed, weather, presence of objects like parked cars or vegetation etc.) produced very consistent results. In the MatLab graphs of this chapter we show the average PRR of typically 3 consecutive runs. An observation common to most test scenarios is a difference in PRR when driving towards the transmitting car compared to driving away from it. When entering the transmitter’s communication range, the approaching receiver experienced lower PRRs than at the same distance moving away from the source. This difference in PRR depending on the driving direction is a phenomenon that reoccurred in different settings and needs to be studied further. Just referring to the Doppler effect is not a satisfactory explanation as similar results were observed even at walking speed or below. Setting 1: Open, straight road The goal of the measurement campaign in the Halmstad harbor area was to establish a comparison baseline in an environment with very little disturbance from buildings, vegetation etc. and at medium speed. Figure 4 shows the combined results from three runs mapped onto an areal image of the test site. The graphs in figures 5 and 6 present the average PRR, where the results for “receiver moving away from transmitter” and “receiver moving towards transmitter” are shown separately. The PRR can be maintained at around 100 % up to a distance of 550 m when moving away from the transmitter while this level of PRR is first regained at a distance of 450 m when moving towards the transmitter. For slow to medium speed on an open road, with constant LOS and no objects on the roadside, it can be concluded that two vehicles driving in opposite direction receive the first packets from each other at a
PRR highway (LOS, high speed): receiver moving TOWARDS transmitter
packet reception ratio
1
© 2009 Google, Map Data © 2010 Lantmäteriet/Metria (used with permission I210/0061)
Figure 4: Variation of connectivity over distance for a series of open road, LOS measurement runs.
0.8 0.6 0.4 0.2 0
0
200 300 400 500 600 700 800 900 distance from (mobile) receiver to (mobile) transmitter
1000
Figure 7: PRR for one run on an open highway (receiver and transmitter driving towards each other)
PRR open road: receiver driving TOWARDS transmitter 1 0.8 0.6
PRR highway (LOS, high speed): receiver moving AWAY from transmitter 1
0.4 0.2 0
0
100 200 300 400 500 600 700 800 900 distance from (mobile) receiver to (fixed positioned) transmitter
1000
Figure 5: PRR for a set of LOS measurements (receiver driving towards transmitter)
packet reception ratio
packet reception ratio
100
0.8 0.6 0.4 0.2 0
PRR open road: receiver driving AWAY from transmitter
0
100
200 300 400 500 600 700 800 900 distance from (mobile) receiver to (mobile) transmitter
1000
packet reception ratio
1
Figure 8: PRR for one run on an open highway (receiver and transmitter driving away from each other)
0.8 0.6
the effect of speed on the connectivity between a vehicle and on-coming traffic has to be considered.
0.4 0.2 0
0
100 200 300 400 500 600 700 800 900 distance from (mobile) receiver to (fixed positioned) transmitter
1000
Figure 6: PRR for a set of LOS measurements (receiver driving away from transmitter)
distance of ca. 700 m while they reach full connectivity at around 500 m. Setting 2: Highway The goal of the highway measurements was to test high relative speeds (up to 240 km/h) by letting receiver and transmitter drive towards each other at constant LOS. Transmitter and receiver entered the highway on different highway entrances and drove towards each other at a speed of about 120 km/h. Even here we separated the data for “driving towards each other” from “driving away from each other” (see figures 7 and 8). We conclude that for high speeds on an open road, with constant LOS and no objects on the roadside, two vehicles driving in opposite direction reach full connectivity at a distance of ca. 350 m. When driving away from each other, on the other hand, full connectivity is first lost at ca. 600 m. Compared to the results from setting 1 (low to medium speed),
Setting 3: Urban environment In an urban setting the line-of-sight of the driver is significantly reduced due to buildings and other structures. At the same time traffic density is high and accidents frequently occur where roads intersect, suggesting that NLOS radio communication could increase traffic safety. The aim of the urban scenario was to evaluate communication in such a cluttered environment. The streets in the chosen area were relatively narrow (approximately 10 m wide) and bidirectional, additionally several vehicles were parked on the sides of the streets. Buildings in the area were 3-5 stories tall and predominantly made of stone. The effect of obstacles on PRR was found to be highly correlated with LOS/NLOS as seen in Figure 9. In NLOS conditions almost all packets were dropped even for very short distances between transmitter and receiver with the exception of areas in the immediate vicinity of intersections between the street where the transmitter was located and other streets. In LOS conditions, when the receiver was on the same street in our scenario, PRR was observed to be at 100%.
© 2009 Google, Map Data © 2010 Lantmäteriet/Metria (used with permission I210/0061) © 2009 Google, Map Data © 2010 Lantmäteriet/Metria (used with permission I210/0061)
Figure 10: NLOS measurement series over a steep crest. PRR rural road (steep crest): receiver driving TOWARDS transmitter 1
Setting 5: Rural environment – curve with vegetation As the second rural setting, we chose a curve with vegetation (mixed forest in late spring) to obstruct the LOS between the transmitter, parked 90 m from the curve, and the receiver driving with very low speed (walking speed and below)
0.8 0.6 0.4 0.2 0
0
20 40 60 80 100 120 140 160 180 distance from (mobile) receiver to (fixed positioned) transmitter
200
Figure 11: PRR for a set of NLOS measurements over a steep crest (receiver driving towards transmitter)
PRR rural road (steep crest): receiver driving AWAY from transmitter 1 packet reception ratio
Setting 4: Rural environment – steep crest A narrow road over a steep crest with road cut on each side was chosen as the first rural test environment. The transmitting car was parked on the bottom of the hill while the receiving vehicle drove at low speed over the top and back again. The goal was to measure the effect of considerable changes in the road topography. The GoogleEarth visualization in figure 10 shows the series of three complete runs over the crest which is marked with an ‘X’. The light and dark green bars highlight the difference in connectivity depending on the driving direction. Figures 11 and 12 show the average PRR of three runs, moving away from and towards the transmitter, respectively. The hill top lies exactly 140 meter from the transmitter. Contradicting the results from sites with constant LOS, roads with hills or crests show better connectivity when the receiver is moving towards the transmitter than when driving away from it. This can be explained by the fact that the receiver car itself gets in the way between the antenna on its roof and transmitting antenna when the car drives downhill away from the transmitter. When driving uphill towards the transmitter, on the other hand, the receiving antenna is perfectly placed up front on the roof. For both driving directions connectivity was lost at about 140 m from the transmitter, which coincides with the location where LOS is suddenly lost due to the crest. The PRR jumps from 100% to almost 0 within just 10 meters. Compared to the harbor scenario with constant LOS, the rapid loss of connectivity due to an obstacle (here the road itself) is evident. How the road cut affects the radio signals (e.g. possible improvement due to reflection) has to be further investigated.
packet reception ratio
Figure 9: Variation of connectivity in an urban setting
0.8 0.6 0.4 0.2 0
0
20 40 60 80 100 120 140 160 180 distance from (mobile) receiver to (fixed positioned) transmitter
200
Figure 12: PRR for a set of NLOS measurements over a steep crest (receiver driving away from transmitter)
around the curve and back. The goal was to measure the effect of vegetation that inhibits the driver from detecting on-coming traffic visually but still allows some radio contact. Figure 13 visualizes the connectivity during a series of runs and a considerable difference in connectivity depending on the driving direction can be detected. The difference in PRR depending on the driving direction is even obvious in this scenario (see figures 14 and 15). When driving away from the transmitting vehicle, connectivity started to degrade at 90 m which is the exact position where the LOS for the first time is decreased by the foliage of the trees. The PRR reaches 0 at about 140 m. When driving
towards the transmitter, connectivity is regained at about 130 m from the sender until full connectivity is reached at 90 m with the re-entry into the LOS. Despite the obvious degradation of the radio signal due to the vegetation, limited connectivity could be maintained several tenths of meters from the sender, indicating that communication-based, cooperative warnings to on-coming traffic are possible even without LOS. V. CONCLUSIONS
© 2009 Google, Map Data © 2010 Lantmäteriet/Metria (used with permission I210/0061)
Figure 13: Variation of connectivity over distance for a series of measurement runs with limited LOS PRR rural road (curve): receiver moving TOWARDS transmitter packet reception ratio
1 0.8 0.6 0.4 0.2 0
0
20 40 60 80 100 120 140 160 180 distance from (mobile) receiver to (fixed positioned) transmitter
200
Figure 14: bending rural road with limited LOS due to vegetation (receiver driving towards transmitter)
PRR rural road (curve): receiver moving AWAY from transmitter 1 packet reception ratio
In this paper, the results of real world measurements of 5.9 GHz CALM M5-based vehicle-to-vehicle communication in various road settings were presented and evaluated. From our tests with prototypes of the up-coming WAVE technology for short and medium range cooperative vehicle safety applications we conclude that connectivity is almost immediately lost with the loss of LOS. This limits the range of safety applications that can be built around WAVE-based inter-vehicle communication considerably as it appears to be difficult to warn a driver of e.g. on-coming traffic before LOS between the vehicles is established and the driver is (theoretically) able to visually detect the other vehicle. Despite the need for LOS, the potential of cooperative safety applications is still huge. Limited LOS by e.g. vegetation or other vehicles between transmitting and receiving vehicle still offers reasonable connectivity where a driver might not be able to assess the traffic situation correctly. Applications that help avoid dangerous and uneducated overtaking manoeuvres or increase a driver’s awareness horizon in severe weather (such as fog, snow or sand storms) have the potential to save many lives. The effect of weather conditions on the radio signal quality needs of course to be investigated in detail before further conclusion can be drawn. Another mechanism for handling the NLOS communication failures observed in this paper is to make the communication stack context-aware by utilizing historically collected observations regarding the communication channel. Vehicles in a VANET can be employed to not only run traffic safety applications but also to log communication quality metrics. In fact, in a VANET relying on periodically sent beacon messages very little communication overhead would need to be introduced for this type of communication quality monitoring. Logs aggregated from multiple vehicles could then be used to form maps of the radio environment. Knowledge of potential radio “black-spots”, locations where communication quality has been observed to be poor, could then be used to adapt system functionality at multiple levels of the communication stack. For example, a vehicle approaching an intersection where communication quality is known to be poor can choose to enter into degraded mode at the application level, change routing strategy at the network level or change physical level characteristics such as transmission power or frequency. The use of infrastructure to mitigate NLOS link failures is yet another way of addressing the situations observed in our measurements. Both active and passive solutions to relaying radio transmissions around NLOS obstacles can be employed.
0.8 0.6 0.4 0.2 0
0
20 40 60 80 100 120 140 160 180 distance from (mobile) receiver to (fixed positioned) transmitter
200
Figure 15: bending rural road with limited LOS due to vegetation (receiver driving away from transmitter)
However, the cost associated with installing and maintaining infrastructure equipment means that novel infrastructure planning tools are necessary that take not only communication aspects into account but also application aspects. The use of Geographic Information Systems (GIS) to predict radio wave propagation for different wireless communication technologies over a geographical area has been suggested by Crosette et al. [11] and could be a useful tool in the investigation of relevant sites to set up road side infrastructure. Information from road accident databases, such as the Swedish STRADA (Swedish TRaffic Accident Data Acquisition) database, might also be fused with both measured and simulated communication
quality in order to find locations where the deployment of infrastructure could improve not just the communication quality but ultimately traffic safety. ACKNOWLEDGEMENTS This work was funded by the Swedish Transport Administration (Trafikverket) and the KK-foundation in participation with Volvo Technology Corp., the Technical Research Institute of Sweden (SP) and Free2Move AB. The authors would like to acknowledge Intempora S.A. for valuable assistance in configuring the RTMaps software. REFERENCES [1]A. Böhm and M. Jonsson, “Position-based data traffic prioritization in safety-critical vehicle-to-infrastructure communication”, Proc. IEEE ICC Vehicular Networks & Applications Workshop, Dresden, Germany, June 2009. [2] K. Lidström, T. Larsson and L. Strandén, "Safety Considerations for Cooperating Vehicles using Wireless Communication", Proc. of the 5th IEEE Conference on Industrial Informatics (INDIN 07), Vienna, Austria, July, 2007 [3] Task Group p. IEEE 802.11p: Wireless Access in Vehicular Environments (WAVE), draft standard ed., IEEE Computer Society. [4] ISO TC.204 WG.16 [Online]. Available: http://www.isotc204wg16.org
[5] [6]
http://www.cvisproject.org I. Tan, W. Tang, K. Laberteaux and A. Bahai, “Measurement and analysis of wireless channel impairments in DSRC vehicular communications“, Proc. IEEE Int. Conf. on Communications (ICC 2008), Beijing, China, May 2008, pp. 4882-4888. [7] L. Cheng, B. Henty, F. Bai and D. D. Stancil, “Doppler spread and coherence time of rural and highway vehicleto-vehicle channels at 5.9 GHz”, Proc. Global Telecommunications Conf. (Globecom 2008), New Orleans, LA, USA, Nov. 2008, pp. 1-6. [8] G. P. Grau et al., “Characterisation of IEEE 802.11p radio channel for vhicle-2-vehicle communications using the CVIS platform”, technical report, Centre for Adaptive Wireless Systems, Cork Institute of Technology, Ireland. [9] I. Jensen., J.K.H. Gamage. ”CVIS vehicle rooftop antenna unit”, in 6th ITS in Europe Congress & Exhibition, 2008 [10] Intempora S.A., [Online]. Available: http://www.intempora.com/ [11] D. Cossette, M. Sawada, G. Chouinard, G. Briggs and P. G. Johnson, “Combination of geographic information system (GIS) and radio frequency (RF) planning software, to assess the market potential of wireless broadband internet to unserved rural populations”, Proc. Conf. of the Canadian Institute of Geomatics, Ottawa, Canada, June 2005.