Modern Applied Science; Vol. 6, No. 11; 2012 ISSN 1913-1844 E-ISSN 1913-1852 Published by Canadian Center of Science and Education
Evaluating Emergency Department Resource Capacity Using Simulation Norazura Ahmad1, 2, Noraida Abdul Ghani2, Anton Abdulbasah Kamil2, Razman Mat Tahar3 & Aik Howe Teo4 1
School of Quantitative Sciences, College of Arts and Sciences, Universiti Utara Malaysia, Kedah, Malaysia
2
School of Distance Education, Universiti Sains Malaysia, Pulau Pinang, Malaysia
3
Faculty of Technology Management, Universiti Malaysia Pahang, Kuantan, Malaysia
4
Penang General Hospital, Pulau Pinang, Malaysia
Correspondence: Norazura Ahmad, School of Quantitative Sciences, College of Arts and Sciences, Universiti Utara Malaysia, Sintok 06010, Kedah, Malaysia. Tel: 60-4-928-6959. E-mail:
[email protected] Received: August 27, 2012 doi:10.5539/mas.v6n11p9
Accepted: October 7, 2012
Online Published: October 25, 2012
URL: http://dx.doi.org/10.5539/mas.v6n11p9
This study is funded by Universiti Sains Malaysia under the Postgraduate Research Grant Scheme but the views expressed in the paper are those of the authors alone Abstract Emergency departments open 24 hours every day and may receive patients at any time most unexpectedly. Adequate resource planning to meet the various demands in emergency departments is arguably amongst the most critical challenges faced by hospital administrators due to the complexity of the system and diverse patient flows. In this paper, we present a computer simulation model to evaluate resource utilization among personnel and physical resources in a typical emergency department (ED) of a government hospital in Malaysia. The model allows administrators to see patient movement flows as well as how these flows are affected by resource capacity level in the ED. The use of this simulation model helps to evaluate ED operations, provides useful insight for possible areas of improvement, and directs the allocation of specific resources for maximal impact. Three scenarios were tested to find out the impact of patient surge on ED performance measures. Results from the scenarios show that a 30% increase of attendances according to triage zones affects most of the performance measures. In addition, medical assistants are the critical resources with average utilization greater than 70%. Keywords: computer simulation, discrete-event simulation, emergency department 1. Introduction In Malaysia, emergency department (ED) in government hospitals is the front door for patients seeking for immediate treatment. The emergency patients often expect to receive treatment with minimum delay and in a timely manner. Lack of resource capacity, such as beds, doctors and nurses will hamper the care process and reduce health care quality, as well as increasing the potential of medical errors and long waiting times. This scenario is inherently difficult because in hospital, capacity decision is a major determinant for providing services over a specified time interval. Due to this, a sound capacity analysis is required to help ED administrations evaluate the resource utilization and system performance efficiency periodically. ED entails three main components, which are people, processes and equipments. Therefore, modelling an ED system requires an approach that can portray the integrated relation between those three components. Due to this fact, the use of analytical models that requires many assumptions and simplifications seems not practical for ED modelling. A significant amount of reported studies in health care has been conducted in EDs (Jun, Jacobson, & Swisher, 1999). Among these studies, simulation has outnumbered other Operations Research approaches to model EDs (Ruohonen, Neittaanmaki, & Teittinen, 2006). Simulation is chosen for at least three reasons: Firstly, healthcare systems require stochastic approach as there are many uncertainties and variability that are involved in the systems. Secondly, the complex nature of healthcare systems requires a modelling approach that can deal with complexity. Finally, human involvement in healthcare systems needs proper approach for interactions and communications between modeller and user (Brailsford, 2007). 9
www.ccsenet.org/mas
Modern Applied Science
Vol. 6, No. 11; 2012
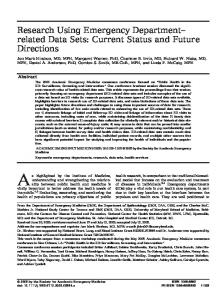
Several researchers have successfully adopted and implemented simulation to solve ED problems that are associated with resource allocation, improving patient flow and reducing patients’ waiting time (Komashie & Mousavi, 2005; Ruohonen et al., 2006; Gunal & Pidd, 2007; Powell, Khare, & Reinhardt, 2007; Medeiros, Swenson, & DeFlitch, 2008; Ahmad & AlKhamis, 2008; Brenner et al., 2010; Peck & Kim, 2010). Other researchers have taken advantage on the flexibility of simulation approaches by integrating simulation with other techniques like integer linear programming (Centeno, Giachetti, Linn, & Ismail, 2003), genetic algorithm (Yeh & Lin, 2007) and optimization algorithm (Ahmad & AlKhamis, 2008). These approaches mainly used discrete event simulation (DES) that is able to model complex patient flows and provide detail operational characteristic of ED. DES is a modelling approach that allows end-users such as health administrators to evaluate the efficiency and ask “what-if” questions for existing and non-existing systems. DES is concerned with the modelling of systems that can be represented by series of events at discrete time intervals. Entities in the system flow around a network of services or processes and may have characteristics which determine their trail through the network. DES allows the modeller to create entities with necessary human traits such as age, gender, marital status and mode of arrival. These traits are typically seen in patients who are seeking various treatments in hospital system. DES permits one to track the status of individual entities in a system and compute performance measures associated with the entities. The tracking is done by focusing on times at which the various events occur. In DES modelling great emphasis is given on the effect of random variation. Such stochastic effects are not considered in analytical models and even less important in system dynamics models. Another advantage of DES is the animations and graphics visualization embedded in the software packages. The animations provide justification for factual figures and help in better understanding of the system. This makes DES as an ideal tool to communicate with healthcare administrators. All of these appealing facts may contribute to the increasing practice of DES in healthcare modelling. Though many models of ED were constructed, those models mainly represent hospitals in the US and Europe (Brailsford, Harper, Patel, & Pitt, 2009). Different factors and structures applied in these countries are not applicable in Malaysia. For example, there is no ambulance diversion reported in the country as the policy of government hospital is to serve every patient that arrives at their door. Thus, increasing number of patients to ED is inevitable and could increase the workloads among staffs. In addition, unlike developed countries that have separate ambulance providers, ambulance is part of ED services which is manned by the ED staffs who work as emergency staffs and ambulance crews in parallel. The following section delineates problems faced by a government ED in Malaysia that require a simulation approach. 1.1 Problems With the increased level of population, demand for health services particularly in the ED will also be increased (Hong & Ghani, 2006). For instance, in the six-year period in Penang from 2005 to 2010, the number of attendances to an ED increased from 101 841 to 136 576 (Figure 1).
Figure 1. Number of arrival to an ED from 2005-2010 10
www.ccsenet.org/mas
Modern Applied Science
Vol. 6, No. 11; 2012
It represents an overall increase of 34.1%, which is higher than the 9.6% increase in Penang’s estimated total population in the same time period (Penang Statistics, 2010). This situation has positioned the ED under increasing pressure to treat its patients within the expected timeline. With more patients needing care and fewer resources to care for them, ED that operates at or above capacity is inevitable. If this trend persists, what will happen to ED should there be a surge in demand in the future? Emergency patients in government hospitals are classified using a three-color triage zone, namely Red, Yellow and Green. Red represents critical cases in which life is at stake while Green represents the least severe cases. The surge in demand for emergency care associated with continually changing demand case mixes makes the ED an ever-changing system. This situation is tougher with the introduction by the Ministry of Health (MOH) in 2009 of a new target time for patients to be attended to by doctors in the ED (refer Table 1). The target time is the key performance indicator (KPI) monitored by the MOH. Table 1. KPI for the three-colour triage zone Triage Zone
Time to be attended to Prior
New
100% immediately
100% immediately
Yellow
100% within 30 minutes
100% within 15 minutes
Green
75% within 90 minutes
75% within 60 minutes
Red
The new target time only affect the Yellow and Green cases but yet is pressing the ED staff as the two groups constitutes almost the total number of ED arrivals. The KPI states that for all Yellow triaged patients, they must be attended to within 15 minutes while three-quarter of Green triaged patients must be attended to within 60 minutes. The new target time must be achieved without additional resources. As such, efficient allocation and utilization of staff resources are keys to achieving these new targets. However, this places the ED at a reduced capacity to handle surge situations. The aim to determine the ideal staffing resources to ensure ability to handle this increased workload in an efficient manner is important. Thus, by using a computer simulation model the administrators will be able to determine the impact of patient surge on resource capacity and to identify increased staff requirements that will avoid delays in treatment and non-compliance to performance targets. 2. Method 2.1 System Model Description The ED understudy is open 24 hours every day a week and receives an average of 1563 patients weekly. Figure 2 shows the primary patients’ process flow in the ED. The process flow begins with patient arrival. Patients arrive either by ambulance or as walk in cases. Regardless of mode of arrival, the arriving patient stops at a registration counter for registration. At the same time a medical assistant will triage the patient. However, critical patients will be sent directly to the critical area and bedside registration will be performed at a later time by the registrar. Once triaged, the patient moves to the waiting area and wait to be called for treatment. If there is availability of a doctor, the patient moves to thetreatment area and sees the doctor. Delay of doctor to patient contact depends on severity of illnesses. Doctors will decide if the patient needs further tests such as clinical lab tests or X-rays. Results obtained will be reviewed by doctors and a decision is made upon the results. Some patients will be observed temporarily in ED’s observation ward before release for discharge. Discharged patients can either be released to go home or send to hospital wards for further treatment.
11
www.ccsenet.org/mas
Modern Applied Science
Vol. 6, No. 11; 2012
Figure 2. The process flow 2.2 Simulation Approach There are several structured approaches to conduct a simulation study, which in general have common elements. Figure 3 presents the general simulation steps as proposed by many simulation modelers (Law & Kelton, 2000; Banks, Carson, & Nelson, 1996; Law & McComas, 1991). A similar approach has been applied in this simulation study.
12
www.ccsennet.org/mas
Modernn Applied Sciencce
Vol. 6, No. 11; 2012
Figure 3. Genneral simulatioon steps The studyy starts with system s investiggation, which includes anallysis of deparrtment layout, patient flowss and activity rellationships. Thhe investigatioons help to idenntify the probllem clearly andd define proceesses and flowss that must be inncluded in the model, in ordder to achieve a sufficiently aaccurate representation of thhe real system. The conceptuall model is then formulated aand later transslated into a prrogrammed m model using AnnyLogic simulation software. T The model is then t verified aand validated tto ensure that the developedd model imitattes the real sysstem. Model expperimentationss are then perfo formed to deterrmine the likely outcomes fr from alternativve solutions. At this stage, suggestions to im mprove the exiisting system can be drawnn from the resuults generatedd by the simulation experimennts. Simulationn has to be runn with many reeplications, whhich at least beetween three too five times and the average off these runs is recorded (Law w & McComass, 1991). The rresult of outpuut analysis shouuld be docume ented clearly andd concisely. Byy doing so will build confideence in the sim mulation modell and the systeem owner can make m decisions bbased on the annalysis prior too implementattion. 2.3 Data C Collection At the inittial stage, we interviewed thhe ED adminiistration to geet a the view oof how the syystem operates. For further undderstanding wee observed andd interviewed staff throughouut the processees in the ED. B Before observa ation, approval w was obtained from f the Minisstry of Health Medical Reseearch Ethics C Committee. Ann online application form was submitted throough the publiic Research Diirectory of Nattional Medicall Research Register website. The data regardding the processing times off activities in thhe ED are not aavailable and nneed to be colllected. In obtaining the time aactivities take on average too perform, the ED staffs succh as doctors and nurses weere observed while w performingg their duties. We designed a data collection form that w was used by thhe data collectiion team. The team conductedd many hours of o observationss in one monthh. It was not poossible to obseerve all staffs aand patients, so the team gatheered random samples s of proocessing times to create morre accurate durrations for thee simulation model. m In additionn, data on paatient arrivals, the number of patients inn each triage zzone, ambulannce call timess and ambulancee depart timess were extraccted from the log books annd ambulancee database sysstem. Arena Input I Analyzer iis used to fit thhe appropriate distribution too the empirical data obtainedd. 2.4 Model Development In this stuudy, the DES model m was deeveloped usingg AnyLogic sooftware, versioon 6.6. We used Network Based B 13
www.ccsenet.org/mas
Modern Applied Science
Vol. 6, No. 11; 2012
Modelling objects in Enterprise Library section to model the process flow in the ED. Just like its name, a set of objects in Network Based Modelling enable users to model network or layout based modelling. These objects are useful when the processes that need to be modelled involve certain physical space with moving entities and resources. This criteria is suitable for modelling hospital system especially ED. Figure 4 shows a screen shot of the ED model logic.
Figure 4. A part of DES model logic In this study, distribution for input data is based on actual data and empirical data. Patient arrivals, time spent at the registration counter as well as delay time for x-Ray are independently and identically distributed as a Weibull distribution (Centeno et al., 2003). On the other hand, delay time for doctor to patient contact and lab results follow a triangular distribution (Komashie, Mousavi, & Gore, 2008). Capacity of an arrival in the model is assumed as a single patient. 2.5 Model Outputs In order to evaluate the ED performance, we collected several performance measures. These outputs will provide ED administrations the information to decide upon possible alternative solutions. The following is a list of outputs yielded from the model: 1) Average wait time to see the doctor. 2) Average treatment time (length of time when a patient sees a doctor until decision is made to discharge from ED). 3) Average length of stay (length of time a patient arrives in ED until discharge). 4) Resources utilization. 2.6 Verification and Validation The ED model logic was shown and verified by the ED administration. Values for performance measures such as waiting times were compared to current system and reviewed by the head of the department before accepting the model as valid. We also perform verification check based on Little’s formula (Altiok & Melamed, 2001).
N W Where, N = average number of jobs in the system W = average time a job spends in the system
λ = average rate of arrivals that manage to enter the system 14
(1)
www.ccsenet.org/mas
Modern Applied Science
Vol. 6, No. 11; 2012
From the simulation output, the average number of jobs in the system is estimated as the average of work-in-process (WIP) in the system where N = 8.545. The average time a job spends in the system is estimated from the average length of stay that gives W =55.29 while the average total arrival rate, λ = 0.154. Estimating each side of (1) separately yields N = 8.545 and W = 8.515. Note that left hand side and right hand side are approximately equal, thereby providing additional confidence of the model. For the purpose of validation, the model is run 12 times for seven day replication length. Historical figures disclose that on weekdays between 5 to 6 am, there were less than five patients in the system. Therefore, instead of using a warm-up period, the model is started in an empty state. The simulation clock is started at any weekdays at 5 am. Result from the 12 replications is compared to actual 12 weeks data that record the number of arrivals and the number of patients in each triage zone. The difference between these data is computed using the following formula: Difference (%) = (|Simulation output – Actual data| /Actual data) x 100% Based on the recommendation put forward by Carson (2002) the difference must be less than 10% to achieve the level of sufficient accuracy. The actual arrivals range from 1504 to 1713 patients per week whereas the simulated arrivals vary from 1568 to 1678 patients per week. The difference between the average actual arrivals and simulated arrivals is 3.23%. In addition, we also computed the difference between actual and simulated data for the number of patients in each triage zone and obtained 3.85% for Green triaged, 2.23% for Yellow triaged and 1.12% for Red triaged. The values are in the acceptable range of accuracy and are considered to be in a good agreement. 3. Results The ED administrators highlighted at the initial stage of the work that they want to know whether current resources are adequate to serve patient surge in a timely manner. Therefore we want to see the impact of 30% patient surge in these resources and KPIs. The type of patient surge assumed in this model is the daily surge that reflects an increase in patient visits to the ED applied evenly over time. We do not consider a surge related to a large scale incident or natural disaster. Preliminary results from the DES model reveal that an average of 1613 patients visit the ED per week with a standard deviation of 63, which is an indication of high variability of patient volume to the ED. Of the average total patients, 89.77% were triaged as Green, 9.3% were triaged as Yellow and less than 1% were triaged as Red. From the results, medical assistants score the highest utilization with an average of 70%. Resource utilization is a good indicator for the administration to evaluate how the resources are being deployed. The 70% utilization is parallel with the administration’s claim that medical assistants usually are the busiest resources because they assist doctors in treatment processes and also serve for ambulance services. For room utilization, waiting area has highest value, which is 70%. High utilization in treatment area usually occurs when most of the resources such as doctors and nurses are directed to treat several Yellow and Red cases that appear consecutively. As for Green triaged patients, results reveal that they wait on average approximately 15 minutes to see the doctors and spend around an hour in the system. On the other hand, for Yellow triaged patients, the mean wait time is 3.5 minutes and the average length of stay is 103.44 minutes. This result is similar to normal expectation that severely ill patients usually spend a longer period than least severe patients in ED as summarized in Table 2. The model does not monitor the outputs for Red triaged patients since these patients are the first priority in ED, where clinical care is given immediately as they arrive in the ED. 4. Discussion Through discussion with the administrators we tested three what-if scenarios to identify whether current resources in the system are able to cope with a surge in the number of attendances. To accomplish this we increase 30% of attendances according to triage and see the impact to the system performance. 30% increase is chosen after taking consideration to the overall increase during the last six-year period.
15
www.ccsenet.org/mas
Modern Applied Science
Vol. 6, No. 11; 2012
Table 2. Comparison of wait times, treatment times and ALOS*
Mean wait time for triaged Green (minute) Mean treatment time for triaged Green (minute) ALOS triaged (minute)
for Green
Mean wait time for triaged Yellow (minute) Mean treatment time for triaged Yellow (minute) ALOS for triaged Yellow (minute)
Original simulation output (base model)
Scenario 1 (increase triaged Green by 30%)
Scenario 2 (increase triaged Yellow by 30%)
Scenario 3 (increase triaged Red by 30%)
15.20
33.64
31.16
39.13
(95% CI* =12.4-18)
(95% CI* =23.76-43.52)
(95% CI* =22.10-40.22)
(95% CI* =27.27-51.00)
48.81
67.91
70.03
70.35
(95% CI* =40.71-56.92)
(95% CI* =66.40-69.42)
(95% CI* =68.09-71.96)
(95% CI* =67.96-72.74)
70.24
105.89
106.29
113.72
(95% CI* =60.34-80.14)
(95% CI* =95.56-116.21)
(95% CI* =97.03-115.54)
(95% CI* =102.10-125.35)
3.5
4.25
7.54
8.50
(95% CI* =3.09-3.91)
(95% CI* =3.54-4.95)
(95% CI* =5.02-10.06)
(95% CI* =4.78-12.22)
103.44
113.59
101.97
116.61
(95% CI* =93.69-113.18)
(95% CI* =111.19-115.98)
(95% CI* =96.74-107.19)
(95% CI* =111.11-122.11)
116.63
140.25
117.12
140.35
(95% CI* =107.25-126.01)
(95% CI* =129.08-151.43)
(95% CI* =111.29-122.94)
(95% CI* =128.33-152.38)
*ALOS - Average length of stay, CI – confidence interval. In Table 2, the average wait time before seeing the doctor is presented as well as the average treatment time and the average length of stay for both Green and Yellow triaged patients. Similarly, for each of the scenarios, the model was run for 12 times with different random number seed. The results from different random number seeds are computed together, which then yielded the average values that are used in this discussion. For Scenario 1, the 30% expected increase of Green triaged patients impact most of the KPIs such as mean wait time, mean treatment time and average length of stay. However, the great difference between the baseline model and Scenario 1 can be seen in the average wait time to see the doctor for Green triaged patients, which increases by more than 100%. Due to the long waiting times, the total length of stay of these patients also has increased around 50%. In Scenario 2, due to the 30% expected increase of Yellow triaged patients, an obvious difference can be seen in the parameters of Green triaged patients. The average wait time and the average treatment time increase considerably as does the average length of stay. In overall, parameters in Scenario 1 and Scenario 2 have relatively higher values than the baseline model. However, all values are within the KPI targets (refer Table 1). For Scenario 3, Table 2 clearly depicts that the 30% increase in Red triaged patients increases the average wait time to see the doctor for both Green and Yellow triaged patients by more than 140%. This could due to the fact that more than one doctor is required to treat severe casualties. Besides doctors, other staffs such as medical assistants and nurses are also required to treat the Red critical cases. Therefore, it is vital for the administrators to find the lowest number of additional resources needed in the ED to handle the expected increase of patient volume in future.
16
www.ccsenet.org/mas
Modern Applied Science
Vol. 6, No. 11; 2012
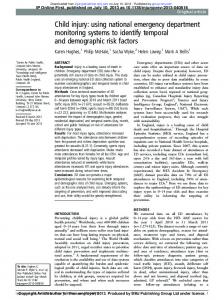
Figure 5. Waiting time histogram of triaged Green for Scenario 3 A low waiting time and a short length of stay usually are the indicators of efficient patient flow in ED while maintaining sufficient resource utilization rates (Jun et al., 1999). The longer wait time suggests that current resource capacity was affected with 30% expected increase in Red triaged patients. In Scenario 3, the mean wait time for Green triaged is 39.13 minutes and 10.75 minutes for Yellow triaged. We further investigated these values and identified that approximately 80% of Green triaged were attended to within 60 minutes as shown in Figure 5. The result is in line with the new target time introduced by the MOH (refer Table 1). On contrary, Figure 6 shows the spread of wait times for Yellow triaged patients. It can be seen that around 11% of them were attended to after 15 minutes whereas only around 89% managed to see the doctor after waiting less than 15 minutes. The result shows that the ED has breached the new target time established by the MOH when 30% expected increase of Red triaged patients enter the ED.
Figure 6. Waiting time histogram of triaged Yellow for Scenario 3 With regard to resource utilization, Table 3 displays that all scenarios have higher values than the baseline model. The utilization of doctor and medical assistant increases considerably as does the nurse utilization. The experimental results also predicted that critical human resources in the ED were the medical assistants, because in a stable system human resource utilization should not exceed over 70% (Luna, 2009). Higher human 17
www.ccsenet.org/mas
Modern Applied Science
Vol. 6, No. 11; 2012
utilization rate can reduce health care quality by increasing the potential of medical errors (Delia, 2005). Therefore the administration should identify ways to ensure human resources utilization is maintained at below 70%. Also, the tested scenarios indicated that for room utilization, the waiting area was more busy than 75% of the time when the number of triaged patients is increased. It depicted that the waiting area was quite packed with patients waiting for treatment. On contrary, treatment area can cope with the expected increase of attendances since the utilization rates were lower than 65%. Table 3. Resource utilization Original simulation output
Scenario 1 (increase triaged Green by 30%)
Scenario 2 (increase triaged Yellow by 30%)
Scenario 3 (increase triaged Red by 30%)
Doctor
52%
58%
65%
61%
Medical Assistant
70%
73%
77%
75%
Nurse
41%
46%
48%
51%
Waiting Area
70%
78%
76%
78%
Treatment Area
50%
61%
58%
61%
5. Conclusions and Future Work This paper presents a simulation study of an emergency department in a government hospital. The developed model enhances administration understanding of patient flows and how the flows are affected by the increasing number of patients. The model is used to investigate the possible impact of expected increase on ED performance using the existing resource capacity. The results show that a 30% expected increase of patients according to the triage zones will increase the waiting times and length of stay. The expected increase also raises the utilization of personnel resources, where medical assistant score the highest utilization by more than 70%. With the increasing of patient, the utilization of physical resources also increases. Bottlenecks in the ED occur when patients arrive at a rate faster than they can be treated. Alleviating the bottleneck is difficult and usually involves testing many possible alternative scenarios. Through simulation modeling ED administrators are able to make better decisions prior to implementation without affecting the real system. The next phase of this study will focus on integrating the result from the DES model to a macro model, which is developed using system dynamics (SD) approach. By integrating the models, we hope to be able to grasp the detailed and dynamic complexity of the ED and thus be able to gain a better understanding of complex feedback system in an ED. The hybrid model will also permit us to inspect the impact of sharing resources between ED and other units in the hospital. Future work should also concentrate on the ideal resource-patient ratio that will be robust enough to withstand surge situations in ED admissions. This will be useful information for planning and placement of critical resources in the MOH. Acknowledgements The authors would like to thank the Ministry of Health, Malaysia for granting permission to collect data from the hospital, and to Universiti Sains Malaysia and Universiti Utara Malaysia for the financial support in conducting the study. References Ahmed, M. A., & AlKhamis, T. M. (2009). Simulation optimization for an emergencydepartment healthcare unit in Kuwait. European Journal of Operational Research, 198, 936-942. http://dx.doi.org/10.1016/j.ejor.2008.10.025 Altiok, T., & Melamed, B. (2001). Simulation modeling and analysis with Arena. USA: Cyber Research Inc and Enterprise Technology Solutions Inc. Banks, J., Carson, J. S. II., & Nelson, B. L. (1996). Discrete-event system simulation (2nd ed.). Prentice Hall. Brailsford, S. C. (2007). Tutorial: Advances and challenges in healthcare simulation modeling. In Proceedings of the 2007 Winter Simulation Conference, 1436-1448. http://dx.doi.org/10.1109/WSC.2007.4419754
18
www.ccsenet.org/mas
Modern Applied Science
Vol. 6, No. 11; 2012
Brailsford, S. C., Harper, P. R., Patel, B., & Pitt, M. (2009). An analysis of the academic literature on simulation and modeling in health care. Journal of Simulation, 3, 130-140. http://dx.doi.org/10.1057/jos200910 Brenner, S., Zeng, Z., Liu, Y., Wang, J., Li, J., & Howard, P. K. (2010). Modeling and analysis of the emergency department at University of Kentucky Chandler Hospital using simulations. J. Emerg. Nurs., 36, 303-310. http://dx.doi.org/10.1016/j.jen.2009.07.018 Carson, J. S. (2002). Model verification and validation. In Proceedings of the 2002 Winter Simulation Conference, 52-58. Centenno, M. A., Giachetti, R., Linn, R., & Ismail, A. M. (2003). A simulation-ILP based tool for scheduling ER staff. In Proceedings of the 2003 Winter Simulation Conference, 1930-1938. DeLia, D. (2005). Emergency department utilization and surge capacity in New Jersey, 1998-2003 (a report to the New Jersey Department of Health and Senior Services). Retrieved from http://www.cshp.rutgers.edu/ Gunal, M. M., & Pidd, M. (2007). Interconnected DES models of emergency, outpatient and inpatient departments of a hospital. In Proceedings of the 2007 Winter Simulation Conference, 1461-1466. http://dx.doi.org/10.1109/WSC.2007.4419757 Hong, N. C., & Ghani, N. A. (2006). A Model for Predicting Average Ambulance Service Travel Times in Penang Island. Proceedings of the 2nd IMT-GT Regional Conference on Mathematics, Statistics and Applications, UniversitiSains Malaysia. Jun, J. B., Jacobson, S. H., & Swisher, J. R. (1999). Application of discrete event simulation in health care clinics: A survey. Journal of the Operational Research Society, 50, 109-123. Komashie, A., & Mousavi, A. (2005). Modeling Emergency Departments Using Discrete Event Simulation Technique. In Proceedings of the 2005 Winter Simulation Conference, 2681-2685. http://dx.doi.org/10.1109/WSC.2005.1574570 Komashie, A., Mousavi, A., & Gore, J. (2008). Using discrete event simulation (DES) to manage theatre operations in healthcare: An audit-based case study. Proceedings of the Tenth International Conference on Computer Modeling and Simulation, 360-365. http://dx.doi.org/10.1109/UKSIM.2008.112 Law, A. M., & McComas, M. G. (1991). Secrets of successful simulation studies. In Proceedings of the 1991 Winter Simulation Conference, 21-27. http://dx.doi.org/10.1109/WSC.1991.185587 Law, A. M., & Kelton, W. D. (2000). Simulation modelling analysis (3rd Ed). McGraw Hill. Luna, J. J. (2009). Automating the constraining process. In Proceedings of the 2009 Winter Simulation Conference, 1194-1199. Medeiros, D. J., Swenson, E., & DeFlitch, C. (2008). Improving patient flow in a hospital emergency department. In Proceedings of the 2008 Winter Simulation Conference, 1526-1531. http://dx.doi.org/10.1109/WSC.2008.4736233 Peck, J. S., & Kim, S. G. (2010). Improving patient flow through axiomatic design of hospital emergency department. CIRP Journal of Manufacturing Science and Technology, 2, 255-260. http://dx.doi.org/10.1016/j.cirpj.2010.04.003 Powell, E. S., Khare, R. K., & Reinhardt, G. (2007). Using computer simulation to evaluate the effect of point of care testing on ED patient flow. Ann Emerg Med, 50(3), S70. http://dx.doi.org/10.1016/j.annemergmed.2007.06.375 Ruohonen, T., Neittaanmaki, P., & Teittinen, J. (2006). Simulation model for improving the operation of the emergency department of special health care. In Proceedings of the 2006 Winter Simulation Conference, 453-458. http://dx.doi.org/10.1109/WSC.2006.323115 Socio-Economic & Environmental Research Institute. (2010). Penang Statistics. Retrieved http://www.seri.com.my/v3/files/quarterly_penang_statistics/2010/Q1_Jan-March_2010.pdf
from
Yeh, J. Y., & Lin, W. S. (2007). Using simulation technique and genetic algorithm to improve the quality care of a hospital emergency department. Expert Systems with Applications, 32, 1073-1083. http://dx.doi.org/10.1016/j.eswa.2006.02.017
19