MODSIM World 2017
Evaluating Game-Based Environments for Army Aviation Collective Training Lauren Reinerman-Jones, Martin S. Goodwin, Brian F. Goldiez, Andrew J. Wismer University of Central Florida Institute for Simulation and Training (UCF IST) Orlando, FL
[email protected],
[email protected],
[email protected],
[email protected] Robert A. Crapanzano U.S. Army Program Executive Office for Simulation, Training, and Instrumentation (PEO STRI) Orlando, FL
[email protected]
ABSTRACT The U.S. Army Aviation Combined Arms Training Strategy highlights the use of Training Aids, Devices, Simulations, and Simulators (TADSS) as key, low cost tools to prepare Army aviation forces for future combat. A prominent component of this strategy is an increasing reliance on games-for-training. Game-based systems are capable of supporting training and assessment of mission procedures and situational judgement tasks. However, little research exists on the capabilities of the specific types of game-based systems for supporting Army aviation collective training. The present study evaluated the effectiveness of the Virtual Battlespace 3 and Microsoft Flight Simulator game-based training environments for a set of collective air assault mission tasks. Study participants consisted of previously qualified Army aviators recruited from various U.S. Army Aviation Center of Excellence (USAACE) schoolhouses located at Fort Rucker, Alabama. An air assault mission scenario, consisting of a set of operationally demanding flight procedures, mission procedures, and cognitive-decision making tasks, formed the basis of the evaluation. Study metrics consisted of mission performance rubrics, a physiological measure of heart rate variability, and a variety of subjective measures. Results indicate that, when compared to each other, both game environments provide comparable opportunities for collective training, allowing training resource decisions to be made based on other factors.
ABOUT THE AUTHORS Lauren Reinerman-Jones, PhD is the Director of Prodigy, which is one lab at the University of Central Florida’s Institute for Simulation and Training, focusing on assessment for explaining, predicting, and improving human performance and systems. Martin S. Goodwin, M.S. is a Modeling & Simulation Ph.D. Candidate at the University of Central Florida. He has over 30 years of experience in the research and development of dynamic instructional systems, simulation and gaming technology integration, and evaluation methodologies to improve learning, engagement, and retention in virtual environments. Brian F. Goldiez, Ph.D. is the Deputy Director of the University of Central Florida’s Institute for Simulation and Tarining and a Research Associate Professor at UCF. Dr. Goldiez has over 40 years of modeling and simulation experience spanning Government, Industry, and Academia. His principal focus has been oriented to optimizing technology to enhance human performance. Robert A. Crapanzano, MAJ, is an Assistant Product Manager at the U.S. Army’s Program Executive Office for Simulation, Training, Instrumentation and is a doctoral student at Embry Riddle Aeronautical University. Andrew J. Wismer, M.A. is a Human Factors & Cognitive Psychology Ph.D. Candidate at the University of Central Florida with research experience in categorization, decision making, and learning in dynamic environments.
2017 Paper No. 38 Page 1 of 11
MODSIM World 2017
Evaluating Game-Based Environments for Army Aviation Collective Training Lauren Reinerman-Jones, Martin S. Goodwin, Brian F. Goldiez, Andrew J. Wismer University of Central Florida Institute for Simulation and Training (UCF IST) Orlando, FL
[email protected],
[email protected],
[email protected],
[email protected] Robert A. Crapanzano U.S. Army Program Executive Office for Simulation, Training, and Instrumentation (PEO STRI) Orlando, FL
[email protected]
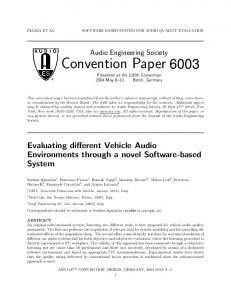
INTRODUCTION For the United States, the Global War on Terrorism has been characterized by the Army Force Generation (ARFORGEN) training model with rapid successions of training, deployment, and reset periods. In this cycle, training predominantly focused on preparing aviation units for the threats they would encounter in deployments to fight unconventional forces in Iraq and Afghanistan. The United States Army has since begun to reduce deployments to Iraq and Afghanistan and prepare for future, unknown combat scenarios. These future scenarios could include warfare against unconventional forces such as the Islamic State of Iraq and Syria (ISIS), regional security and stability operations, or combat against conventional forces who have peer or near peer military capabilities. During this period, the Army seeks to optimize cost-effective training strategies to account for both the technological evolution of modern warfare and political pressure to reduce the defense budget. The U.S. Army Aviation Combined Arms Training Strategy (2016) highlights the use of Training Aids, Devices, Simulations, and Simulators (TADSS) as key, low-cost tools to prepare Army aviation forces for future combat. A prominent component of this strategy is an increasing reliance on games-for-training. Games-for-training provide a platform for soldiers to train various tactics, techniques, and mission procedures. These simulators have an increasing importance in the overall aviation training objectives as they cost less than equivalent aircraft or flight hours and allow for exceptionally costly or dangerous training tasks to be safely performed. However, little research exists on the capabilities of the specific types of game-based systems for supporting Army aviation collective training. Two such game-based systems available are the Virtual Battlespace 3 and the Microsoft Flight Simulator X. The focus of the current paper is a comparison of these two game-based systems, and each system is described in more detail below. Virtual Battle Space 3 (VBS3) is a first-person, gamebased military simulation training software system developed by Bohemia Interactive Simulations (see Figure 1). It can operate on a laptop or desktop computer. Pilots can use the game with a mouse and a keyboard or they can add additional peripheral devices such as multiple monitors or commercial-off-the-shelf (COTS) video game flight controllers. In the game, pilots can Figure 1. Virtual Battlespace 3 (Morris, 2015). train in scenarios with various military and civilian entities. In joint exercises, on a network, pilots can link their training system to train with teammate aircraft or with additional operators from infantry, armor, artillery, headquarters, or various other military units. Actions are recorded and can be replayed from multiple perspectives. VBS3 provides a platform for tactical training and mission rehearsal. It allows for repeated training of field tactics without costly ammunition, travel time, or risk of injury or damage
2017 Paper No. 38 Page 2 of 11
MODSIM World 2017
(“Virtual Battlespace 3,” 2017). While VBS3 has a significant network capability and low cost, it has very limited functionality compared to the actual aircraft. Most avionics and weapon systems are not simulated in VBS3. Microsoft Flight Simulator (MSFS), on the other hand, is a commercially available program with a history as a popular flight simulator game. MSFS is a desktop application run on Windows that is typically controlled with a mouse and keyboard or joystick. MSFS is a low fidelity simulator that provides similar opportunities for tactical training and mission rehearsal as VBS3. A screenshot of the MSFS dashboard/cockpit can be seen in Figure 2. In the current study, both low fidelity game-based systems were used with the same set of peripherals - a collective device Figure 2. Microsoft Flight Simulator (“Cera and a joystick – and they could be programmed to train a Sim,” 2013). similar mission scenario involving the operation of a UH60A/L Black Hawk helicopter. The two systems were run in the same desktop setup. The only difference between the two simulators lies in the underlying technology. While MSFS runs on C++ with missions programmed in XML, VBS3 uses its own proprietary engine Real Virtuality 3. The UH-60A/L model used in the present study came standard in VBS3, but needed to be imported into MSFS. The Army training strategy begins by training individuals in their respective individual tasks. Training requirements then get progressively more difficult and complex to train teams and then teams-of-teams. These team skills are referred to as collective tasks. While there has been some research conducted that supports game-based training (Sotomayor & Proctor, 2009; Whitney, Tempby, & Stephens, 2014), there is little-to-no research on the effectiveness of game-based training for collective tasks. It is unclear if there would be any degradation in collective training from applying any training tasks currently conducted with the Aviation Combined Arms Tactical Trainer (AVCATT) virtual environment to lower fidelity game-based training devices such as the VBS3 or MSFS. Applying training to gamebased systems could have significant cost savings, but the risk to training and performance is unclear. The present study set out to investigate the potential value of using a game-based simulator – such as VBS3 or MSFS – for collective training by comparing the two game-based systems on a set of collective air assault mission tasks.
METHOD Participants Data from this study is comprised of 17 previously qualified Army aviators recruited from various U.S. Army Aviation Center of Excellence (USAACE) schoolhouses located at Fort Rucker, Alabama (12 participants in VBS3 condition; 5 participants in MSFS condition). Participant ages ranged from 29 to 53 years (M = 37.35, SD = 6.11). There were 16 males and 1 female (the female was in MSFS condition). The participant sample was considered expert in terms of military service and flight hours. Years in the Army spread from 7 to 16 years (M = 15.88, SD = 4.46). Lifetime rotary aircraft flight hours ranged from 200 to 7100 hours (M = 1945.71, SD = 1660.94), which included lifetime UH-60A/L flight hours that ranged from 35 to 6600 (M = 1569.82, SD = 1590.07). Number of deployments ranged from 1 to 4 (M = 2.24, SD = 0.90). All participants were healthy adults with normal or corrected-to-normal vision and no reported color blindness. Participants were compensated at their normal hourly wage. Experimental Design The current study compared the use of two training simulated environments (VBS3 and MSFS) for completing a set of collective flight training tasks. The between-subjects independent variable was the training simulated environment (VBS3 or MSFS) experienced by a participant.
2017 Paper No. 38 Page 3 of 11
MODSIM World 2017
Every participant completed a mission scenario in one experimental session lasting approximately 3.5 hours. Only one flight simulated environment could be run per week due to aviator availability, facility space, flight stick and collective equipment availability, and Army support staff availability. Participants during the first week of data collection completed the VBS3 training simulated environment, while participants in the second week completed the MSFS training simulated environment. Unanticipated limitations in pilot availability during the second week led to the uneven sample sizes. Both training simulated environments used the same set of controls to complete the mission scenario (see Figure 3). In either environment, a two-person crew was employed through designation of pilots and copilots. Study participants were the pilots, while copilots were soldiers briefed on their respective roles as confederates in the study. All experimental sessions were conducted under the operation of the USAACE Directorate of Simulation at Fort Rucker, Alabama. Experimental Scenarios
Figure 3. Saitek Pro Flight X52 Control Set Used With Game-Based Systems (“Pro Flight X52,” n.d.).
Equated mission scenarios were used for the VBS3 and MSFS training simulated environments and were similar with respect to terrain, weather conditions, and approximate flight time and distance. The mission scenario positioned the pilot participant as an Air Mission Commander of a General Support Aviation Battalion (GSAB) leading a flight of two UH-60A/L aircraft engaged in collective air assault operations. Remaining roles were played by researchers or Army simulator operators. The mission scenario employed a narrative involving hostile conditions where enemy forces attempted to seize key terrain. The mission involved the air assault of quick reaction force (QRF) soldiers from a pickup zone (PZ) into a landing zone (LZ). Along the way, pilot tasks included reporting several ACP waypoints, making fuel checks, and requesting status updates and clearances. The end of the scenario included a casualty evacuation (CASEVAC) event of which the participant was not pre-briefed. Dependent Measures Study measures included subjective measures of simulator sickness, stress, presence, and workload, seven mission performance metrics relating to tasks, decisions, and flight time, and one physiological measure of heart rate variability. Simulator Sickness Simulator sickness was assessed using the Simulator Sickness Questionnaire (SSQ) by Kennedy, Lane, Berbaum, and Lilienthal (1993) to determine the specific symptoms experienced while interacting within a virtual environment. The SSQ is a self-reporting symptom checklist with 16 associated symptoms rated on a four point scale. Scores are aggregated along three subscales: Nausea, Oculomotor Discomfort (e.g., eyestrain), and Disorientation. The SSQ was administered before and after the participant experienced the training simulated environment, although only the posttest scores are included in the results. Stress Stress state was assessed using the short version of the Dundee Stress State Questionnaire (DSSQ) by Matthews, Emo, and Funke (2005). The DSSQ assesses subjective states of stress along three factors: Task Engagement, Distress, and Worry. The DSSQ was administered before and after the training simulated environment. Presence Presence is a self-report measure that quantifies subjective experiences of involvement and immersion within a virtual environment (Witmer & Singer, 1994). Presence was assessed using the Presence Questionnaire by Witmer and Singer (1998). The 7-point scale questionnaire assesses presence along seven factors: Realism, Possibility to Act, Quality of Interface, Possibility to Examine, Self-Evaluation of Performance, Sounds, and Haptic. Presence was assessed after the participant completed the training simulated environment.
2017 Paper No. 38 Page 4 of 11
MODSIM World 2017
Workload The NASA-Task Load Index (TLX; Hart & Staveland, 1988) was administered after the training simulated environment to assess participants’ perceived workload while performing the mission scenario. The NASA-TLX is composed of six subscales measuring workload across the dimensions of Mental Demand, Physical Demand, Temporal Demand, Effort, Frustration, and Performance. Performance Mission performance was assessed along three dimensions: Tasks, Decisions, and Flight Time. There were a total of 12 tasks that were broken down into five subcategories (the number of corresponding tasks in parentheses): Clearance (3), Fuel Checks (2), Status Requests (2), ACP Reports (3), and Landing tasks (2). There were a total of four decisions that participants could correctly make in the scenario and the proportion of total correct decisions served as the second dimension of mission performance. Cognitive decisions involved situational judgment tasks and responses to changing mission parameters. Finally, the flight time for the CASEVAC portion of the mission served as the third dimension of performance. Flight time incorporated elements of a participant’s route selection, airspeed, approach/landing instructions, etc. Heart Rate Variability (HRV) HRV was captured using a Microsoft Band 2 fitness tracker (see Figure 4) worn on the wrist throughout the mission. Heart rate variability is generally associated with changes in cognitive workload and engagement in effortful information processing (Jorna, 1993). Increases in cognitive workload of task demands are associated with decreases in heart rate variability (an inverse relationship; Mulder, de Waard, & Brookhuis, 2004). Procedure Upon entering the Seneff Aviation Warfighting Simulation Center at Fort Rucker, Alabama, participants completed an informed consent, received study and mission briefing, and were paired (randomly) with a copilot. Participants were provided mission materials including an air assault route map and a kneeboard packet for the simulated mission scenario. Participants were then provided an overview of the study by the lead researcher and a comprehensive mission briefing by an Army operations officer. Figure 4. Microsoft Upon completion, participants and copilots were taken to separate rooms. Participants Band 2 Fitness Tracker. completed a demographics survey, restrictions checklist, SSQ, and a Short DSSQ PreTest on a Microsoft Surface tablet, while copilots were briefed on their role in the study and provided with a script for the crew brief. Then, each study participant and copilot were reunited and escorted to the appropriate training simulated environment where ECG sensors were applied to the participant. The participant received a brief familiarization period with the simulation device, followed by an aircrew briefing by the copilot. Once ready to begin, a physiological baseline was conducted. This was a five minute resting baseline where the participant was instructed to remain still, look forward, and stay silent. This baseline served as a reference against which potential physiological changes during the mission could be measured. After the baseline, the mission scenario began. Sessions included a video recording of the simulator instrument panel. Pilots completed the mission scenario consisting of twelve tasks including radio calls, fuel checks, pickups and dropoffs. Each scenario also included four decision points. At the end of the mission, copilots were sent to a separate room for a post-mission briefing while the ECG sensors were removed from the pilot and video recording ended. The pilot then completed the Presence Questionnaire, SSQ, NASA-TLX, and Short DSSQ Post-Test. The study took participants approximately 3.5 hours or less to complete, and participants were compensated at their regular hourly wage.
RESULTS A descriptive analysis was conducted on the dependent measures to determine normality. Data from the task, decision, SSQ, lifetime UH-60 flight hours, and lifetime rotary aircraft flight hours variables were determined to come from
2017 Paper No. 38 Page 5 of 11
MODSIM World 2017
non-normal distributions. For these measures, nonparametric Mann Whitney U tests were conducted. For all other measures, which assumed approximately normal distributions, results were analyses using independent samples ttests. These analyses were conducted using IBM SPSS 24. In addition, Bayes Factors (BFs) were estimated for each dependent measure, using JASP 8.0, to determine the likelihood of differences. BFs less than 1 provide support for the null model (no differences), while BFs up to 3 provide anecdotal evidence and BFs up to 10 provide substantial evidence for the alternative model (differences; Jeffreys, 1961). VBS3 and MSFS conditions did not differ with respect to age, years in army, total deployments, lifetime UH-60 hours, or lifetime rotary aircraft hours (all p’s > .382; see Table 1). Results of statistical analyses can be seen for all dependent measures in Table 2. Table 1. M (and SD) of Demographic Variables by Condition Condition
Age
Years in Army
VBS3 (N = 12) MSFS (N = 5)
36.74 (6.14) 38.80 (6.50)
16.08 (3.99) 15.40 (5.94)
Total Deployments 2.33 (0.89) 2.00 (1.00)
Lifetime UH-60 Hours 1723.08 (1834.81) 1202.00 (784.71)
Table 2. Statistical Analysis Results for All Dependent Measures VBS3 MSFS Dependent Measure Test statistic M (SD) M (SD) 38.59 (35.61) 31.84 (75.18) t(15) = 0.26 HRV 20.50 (4.87) 20.40 (8.82) t(15) = 0.02 Realism 13.42 (2.81) 15.40 (4.28) t(15) = -1.14 Possibility to Act 9.67 (2.78) 9.20 (4.49) t(15) = 0.26 Interface Quality 10.33 (3.00) 11.60 (3.58) t(15) = -0.75 Possibility to Presence Examine 8.17 (2.73) 7.40 (3.98) t(15) = 0.46 Self-Evaluation 12.17 (3.59) 12.80 (6.30) t(15) = -0.27 Sound 4.58 (2.28) 5.20 (3.27) t(15) = -0.45 Haptic 8.83 (2.44) 7.60 (0.89) U = 18 Nausea 10.33 (3.28) 8.60 (2.61) U = 18.5 Oculomotor SSQ 8.25 (1.96) 8.00 (1.41) U = 29.5 Disorientation 63.75 (19.67) 64.00 (8.22) t(15) = -0.03 Mental WL 41.67 (28.63) 48.00 (37.68) t(15) = 0.38 Physical WL 49.17 (20.65) 44.00 (22.75) t(15) = 0.46 Temporal WL NASA TLX 69.17 (17.69) 72.00 (14.41) t(15) = -0.32 Effort 70.42 (30.34) 55.00 (39.05) t(15) = 0.88 Frustration 42.08 (30.11) 52.00 (34.93) t(15) = -0.59 Performance 23.58 (4.40) 24.00 (4.74) t(15) = -0.17 Pre-Engagement 26.08 (4.30) 25.80 (4.82) t(15) = 0.12 Post-Engagement 10.08 (6.08) 5.00 (3.46) t(15) = 1.73 Pre-Distress DSSQ 12.83 (6.93) 11.20 (5.36) t(15) = 0.47 Post-Distress 11.08 (5.60) 8.20 (5.17) t(15) = 0.99 Pre-Worry 8.33 (6.11) 9.80 (6.02) t(15) = -0.45 Post-Worry 2.08 (1.00) 2.80 (0.45) U = 17 Clearance 1.83 (0.39) 0.80 (1.10) U = 14 Fuel Checks Performance 1.83 (0.39) 1.80 (0.45) U = 29 Status Requests 2.75 (0.45) 2.60 (0.55) U = 25.5 ACP Reports 1.75 (0.62) 0.60 (0.89) U = 10 Landing 2.58 (0.79) 2.20 (1.10) U = 21 Decisions t(14) = 0.22 CASEVAC Flight time 729.91 (150.72) 713.00 (121.83)
2017 Paper No. 38 Page 6 of 11
Lifetime Rotary Hours 2214.75 (1877.51) 1300.00 (776.31)
.801 .982 .272 .795 .463
Bayes Factor 0.445 0.475 0.675 0.455 0.535
.650 .794 .660 .234 .234 .959 .979 .709 .654 .757 .392 .563 .864 .906 .103 .646 .339 .657 .195 .104 .959 .646 .037 .383 .830
0.477 0.455 0.475 0.648 0.632 0.455 0.445 0.466 0.476 0.460 0.572 0.499 0.449 0.447 1.129 0.478 0.609 0.476 0.922 5.143 0.498 0.448 6.014 0.552 0.456
p-value
MODSIM World 2017
Subjective Measures Presence There were no significant differences in presence between VBS3 and MSFS on any of the seven presence dimensions (all p’s > .271). Presence was highly similar between conditions on each of the seven dimensions (see Table 2 for precise means). Simulator Sickness (SSQ). There were no cases of drop outs due to simulation sickness. There were also no significant differences between VBS3 and MSFS on any of the three dimensions of simulator sickness taken after participating in the simulated training environment (all p’s > .296). Workload (NASA-TLX) There were no significant differences in workload between VBS3 and MSFS on any of the six dimensions of workload (all p’s > .391). Average mental demand, physical demand, temporal demand, effort, frustration, and performance scores can be seen in Figure 5. In VBS3, workload was high in terms of mental demand, effort, and frustration, while physical demand, temporal demand, and performance were moderate. In MSFS, workload was high in terms of mental demand and effort, and moderate in terms of physical demand, temporal demand, frustration, and performance.
Figure 5. NASA-TLX Workload Subscale by Condition. Stress (DSSQ) First, independent samples t tests were conducted on each of the pre-task DSSQ dimensions to ensure there were no differences in perceived stress before the mission. Indeed, there were no significant differences between VBS3 and MSFS on any of the three pre-task DSSQ measures (all p’s > .102; see Table 2). Second, DSSQ pre- and post-task scores were entered into a 2 x 2 mixed factor ANOVA - with measurement time (pre, post) as the within-subjects variable and training environment (VBS3, MSFS) as the between-subjects variable – to determine if the training environments had a significant effect on any dimension of stress state. There was a significant main effect of measurement time on distress, F(1, 15) = 6.14, p = .026, ηp2 = .290, such that distress was higher after completing the mission in the simulated training environment (M = 12.35, SD = 6.38) than before completing the mission (M = 8.59, SD = 5.84). Cohen’s effect size value (d = 0.61) suggests this is a medium effect. There was no main effect of measurement time on engagement, F(1, 15) = 2.29, p = .151, ηp2 = .132, or worry, F(1, 15) = 0.17, p = .685, ηp2 = .011. There were no significant main or interactive effects on the influence of training environment. Average pre- and post-task DSSQ scores can be seen in Figure 6.
2017 Paper No. 38 Page 7 of 11
MODSIM World 2017
Figure 6. DSSQ Pre- and Post-Task Scores by Condition. Mission Performance Tasks Mann Whitney U tests revealed a significance difference between conditions with respect to landings, U = 10.00, p = .037, with more successful landings in VBS3 (Mdn = 2) than MSFS (Mdn = 0). No other performance task measures were significant using this analysis (all p’s > .103). The average number of tasks completed, by condition, can be seen in Figure 7. Task performance is also displayed in terms of deviation from optimal because of the different number of tasks in each subscale (see Figure 8).
Figure 7. Average Number of Performance Tasks Completed by Condition. However, performance task measures were also examined by estimating a Bayes factor using Bayesian Information Criteria (Wagenmakers, 2007). This compares the fit of the data under the null hypothesis, compared to the alternative hypothesis. An estimated Bayes factor (null/alternative) for landing performance suggested that the data were 0.166 in favor of the alternative hypothesis, or rather, 6.01 times as likely to occur under the model including an effect for landing performance, rather than the model without it. In addition, the estimated Bayes factor (null/alternative) for fuel check performance suggested that the data were 0.194 in favor of the alternative hypothesis, with the model
2017 Paper No. 38 Page 8 of 11
MODSIM World 2017
including an effect for fuel check performance being 5.14 times as likely as the model without the effect. Both of these Bayes factors suggest substantial evidence for performance differences according to Jeffreys (1961).
Figure 8. Deviation from Optimal Performance on Tasks by Condition. Decisions There was no significant difference between VBS3 and MSFS with respect to the average number of correct decisions overall, t(15) = 0.82, p = .428. On average, pilots in both VBS3 and MSFS made between 2 and 3 correct decisions out of 4. However, trends in two of the four decisions hinted at performance differences between VBS3 and MSFS. The first decision metric assessed whether a pilot requested landing zone (LZ) status before both the pickup zone (PZ) and release point (RP). Nine of 12 VBS3 pilots (75%) successfully met this mark, whereas only 1 of 5 MSFS pilots (20%) made both requests. On the other hand, MSFS pilots did better on the decision metric asking if a pilot diverted west – as instructed – when they were informed of the LZ status change. Three of 5 MSFS pilots (60%) correctly diverted west, whereas only 4 of 12 VBS3 pilots (33%) did so. While these proportions are not significantly different from each other, and they are based on unequal sample sizes, they suggest these game-based environments might differentially influence cognitive decision making to some extent. CASEVAC Flight Time There was no significant difference between VBS3 and MSFS with respect to the average CASEVAC flight time occurring at the end of the scenario, t(14) = 0.22, p = .830. For both conditions, the CASEVAC flight took approximately 12 minutes (i.e., 720 seconds). Heart Rate Variability (HRV) There was no significant difference between VBS3 and MSFS with respect to heart rate variability, t(15) = 0.26, p = .801. HRV values can be seen in Table 2.
DISCUSSION In this study Virtual Battlespace 3 (VBS3) and Microsoft Flight Simulator (MSFS) game-based training environments were evaluated for a set of collective air assault mission tasks. Outcome measures included simulator sickness, stress, presence, workload, tasks completed, correct decisions, CASEVAC flight time, and heart rate variability. Results suggested performance benefits for VBS3 compared to MSFS with respect to landings and fuel check tasks, with a greater number of successful landings in VBS3 than MSFS. There were no significant differences between environments with respect to presence, simulator sickness, workload, stress, decisions, or CASEVAC flight time. DSSQ results provided some insight into the implications of this study. First, a relatively small, non-significant increase in task engagement from pre- to post-task was found. Pilots appeared to be engaged with the task. One reason
2017 Paper No. 38 Page 9 of 11
MODSIM World 2017
engagement scores may not have increased to a greater extent may be the generally high ratings of task engagement present at the pre-test (M = 23.71, SD = 4.36). Second, a small, non-significant decrease in worry in VBS3 but a relative lack of change in worry in the MSFS was found. In general, as participants engage with a task it might be expected to see a (greater) decrease in worry as participants focus on external demands. The fact that worry did not decrease at all (MSFS) or decreased only slightly (VBS3) suggests that pilots might be engaging in self-evaluation during the task (Matthews et al., 2002). Worry has been shown to increase when participants lose control over performance (Matthews et al., 1997). The moderate NASA TLX performance ratings, corresponding to performance “failure”, and the relatively low performance in certain tasks help explain this somewhat unexpected result in the worry dimension – particularly for MSFS (with respect to landings and fuel checks). Altogether, there was a significant increase in distress from pre- to post-task (Cohen’s d = 0.61). An increase in distress is not surprising given a moderately difficult task, and it corresponds with the generally high ratings of workload seen in the NASA-TLX results. However, the significant increase in distress from pre- to post-task that occurs for both VBS3 and MSFS poses a potential problem for training effectiveness. Training simulations that cause distress can take away from training effectiveness if the focus of the distress is due to frustration with the use of the simulator. This idea is supported by the high levels of frustration reported on the NASA-TLX as well as anecdotal reports from pilot interviews following the simulation. The increase in distress could also indicate a need for familiarization time with the simulators to not affect other learning factors. Overall, the stress profiles look similar between conditions and generally correspond to respective workload and task demands, but more research is needed to understand the cause of increased distress in both environments. The primary difference between simulated environments was in the number of successful landings. The average number of landings in VBS3 was 1.75 (Mdn = 2) but only 0.60 in MSFS (Mdn = 0). There was one difference in functionality between the two systems that may be a contributing factor to this landing difference. Namely, VBS3 offers a hover button that enables the helicopter to auto-hover and stabilize, whereas MSFS does not offer this functionality. VBS3 pilots were not told to use this function for landings. However, pilots were briefed on the function’s ability to help stabilize the aircraft when needed, and researcher observations suggest many VBS3 pilots did use this function to help with landings. There were no such cues or control mechanisms for mission tasks (e.g., fuel checks and clearances) that might have influenced any performance trends. The two training simulated environments – VBS3 and MSFS – used the same setup and controls, and other than the auto-hover functionality, they differed only in the underlying technologies. VBS3 is supported by proprietary software Real Virtuality 3, while MSFS is powered by C++ (with scenarios programmed in XML). Given this, it is not too surprising to find only a few performance differences. Yet, anecdotal evidence by researchers who observed the experimental sessions revealed a clear difference between the environments with respect to lag. Researchers noted that response delay from control input to output on the screen was greater in MSFS, and this finding was corroborated by general comments from pilots in this condition. It is possible this lag is due to having to import the UH-60A/L model into MSFS whereas this was not necessary with VBS3. It is also possible that the overall increase in distress – which increased more in MSFS than VBS3 – may have to do in part with the observed lag. Furthermore, it is important to qualify the results of this study by highlighting the difference in sample sizes. Twelve pilots completed the mission scenario in VBS3, while only five pilots completed the scenario in MSFS. The difference between conditions is due simply to resource and time constraints for data collection at Fort Rucker. However, given that the participants were actual flight pilots matching the population of interest, the sample size may be less of a concern. Overall, the results suggest that selection of a game-based simulation for collective aviation training may be made largely based on factors such as availability and ease of programming. The main difference between the two environments exists in the areas of programming and support. All things considered, VBS3 offers a wider array of application support, while fewer resources may be required for programming mission scenarios in MSFS with XML. Beyond these technological differences, the results of this study suggest that any differences between the two systems may be quite small. Greater landing and fuel check performance was found in VBS3 compared to MSFS, but this may be driven primarily by the auto-hover button; more research is needed to understand its impact on transfer of training. Overall, the present results provide preliminary support for the use of game-based systems for Army aviation collective training. Future research should consider game-based systems directly compared to higher fidelity systems to
2017 Paper No. 38 Page 10 of 11
MODSIM World 2017
determine the types of tasks best trained on a given system. Additional assessments with other mission scenarios and larger participant populations are also needed to get a more complete picture of training effectiveness.
ACKNOWLEDGEMENTS This research was coordinated with and managed by Douglas Maxwell, Ph.D. at the Advanced Simulation Training Division of the Army Research Laboratory.
REFERENCES Cera Sim – UH-60L Blackhawk for FSX. (2013, September 20). Retrieved from http://www.fspilotshop.com/cera-sim-60l-blackhawk-for-fsx-p-4677.html Davoudi, M., Wahidi, M. M., Zamanian Rohani, N., & Colt, H. G. (2010). Comparative effectiveness of low- and high-fidelity bronchoscopy simulation for training in conventional transbronchial needle aspiration and user preferences. Respiration, 80(4), 327-334. doi: 10.1159/000318674. Hart, S. G., & Staveland, L. E. (1988). Development of NASA-TLX (Task Load Index): Results of empirical and theoretical research. Advances in Psychology, 52, 139-183. Jeffreys, H. (1961). Theory of Probability (3rd Ed.). oxford, UK: Oxford University Press. Jorna, P. G. A. M. (1993). Heart rate and workload variations in actual and simulated flight. Ergonomics, 36(9), 10431054. doi: 10.1080/00140139308967976 Kennedy, R. S., Lane, N. E., Berbaum, K. S., & Lilienthal, M. G. (1993).Simulator sickness questionnaire: An enhanced method for quantifying simulator sickness. The International Journal of Aviation Psychology, 3(3), 203-220. doi: 10.1207/s15327108ijap0303_3 Matthews, G., Campbell, S. E., Falconer, S., Joyner, L., Huggins, J., Gilliland, K., … Warm, J. S. (2002). Fundamental dimensions of subjective state in performance settings: Task engagement, distress and worry. Emotion, 2(4), 315-340. doi: 10.1037//1528-3542.2.4.315 Matthews, G., Emo, A. K., & Funke, G. J. (2005). A short version of the Dundee Stress State Questionnaire. Presented at the Twelfth Meeting of the International Society for the Study of Individual Differences, Adelaide, Australia, July 2005. Matthews, G., Joyner, L., Gilliland, K., Campbell, S., Falconer, S., & Huggins, J. (1997). Validation of a comprehensive stress state questionnaire: Towards a state ‘big three’?. In I. Mervielde, I. J. Deary, F. De Fruyt, & F. Ostendorf, F. (Eds.), Personality Psychology in Europe Vol. 7 (pp. 335-350). Tilburg: Tilburg University Press. Morris, K. (Photographer). (2015, December 21). U.S. Army Aviation Center of Excellence uses VBS3 [digital image]. Retrieved from http://dogsofwarvu.com/forum/index.php?topic=1555.0 Mulder, L. J. M., de Waard, D., & Brookhuis, K. A. (2004). Estimating mental effort using heart rate and heart rate variability. In N. Stanton, A. Hedge, K. Brookhuis, E. Salas, & H. Hendrick (Eds.), Handbook of Human Factors and Ergonomics Methods (pp. 201-208). Boca Raton, FL: CRC Press. Munshi, F., Lababidi, H., & Alyousef, S. (2015). Low- versus high-fidelity simulations in teaching and assessing clinical skills. Journal of Taibah University Medical Sciences, 10(1), 12-15. doi: 10.1016/j.jtumed.2015.01.008 Pro Flight X52 Pro Flight System for PC. (n.d.). Retrieved from http://www.saitek.com/uk/prod/x52pro.html U.S. Army Aviation Center of Excellence. (2016, January). Army Aviation Training Strategy. Fort Rucker, AL. Virtual Battlespace 3. (2017). Retrieved from https://bisimulations.com/virtual-battlespace-3 Wagenmakers, E. J. (2007). A practical solution to the pervasive problems of p values. Psychonomic Bulletin and Review, 14(5), 779-804. doi: 10.3758/BF03194105 Witmer, B. G., Singer, M. J. (1994). Measuring presence in virtual environments (Technical Report no. 1014). Retrieved from http://www.dtic.mil/cgi-bin/GetTRDoc?AD=ADA286183 Witmer, B. G., & Singer, M. J. (1998). Measuring presence in virtual environments: A presence questionnaire. Presence, 7(3), 225-240. Retrieved from http://graphics.hallym.ac.kr/teach/2007/tcg/src/ps00734.pdf
2017 Paper No. 38 Page 11 of 11