Evaluating the arrayed primer extension resequencing assay of TP53 tumor suppressor gene Neeme To˜nisson*†, Jana Zernant*, Ants Kurg†, Hendrik Pavel*, Georg Slavin*, Hanno Roomere*†, Aune Meiel*†, Pierre Hainaut‡, and Andres Metspalu*†‡§ *Asper, Ltd., 3 Oru Street, 51014 Tartu, Estonia; †Institute of Molecular and Cell Biology, University of Tartu兾Estonian Biocentre, 23 Riia Street, 51010 Tartu, Estonia; and ‡International Agency for Research on Cancer, 150, Cours Albert Thomas, F-69372 Lyon Cedex 08, France Communicated by C. Thomas Caskey, Cogene Biotech Ventures, Ltd., Houston, TX, February 20, 2002 (received for review July 9, 2001)
APEX 兩 oligonucleotide array 兩 chip
T
he evidence is growing that specific mutations in the TP53 gene can represent important factors for the prognosis of cancer and for the response to various types of cytotoxic therapy. Furthermore, patterns of TP53 mutations have differed considerably from one type of cancer to the other (1–4). However, screening for TP53 mutations gene has yet to become a routine in clinical or epidemiological practice, mainly because current detection technologies are labor-intensive and have prohibitive costs for large-scale prospective studies. Another strong limitation to routine analysis of TP53 mutations resides in the fact that many tumors contain an excess of wild-type TP53 as compared with mutant, resulting from the presence of intact alleles in tumor as well as in noncancer cells (stroma, inflammatory cells, blood vessels). In this report we describe the development of an arrayed primer extension (APEX) assay for the rapid and sensitive detection and identification of mutations in the TP53 gene. APEX is a genotyping and resequencing technology that combines the advantages of Sanger dideoxy sequencing with the parallelization and high-throughput potential of the microarray format. A DNA sample is amplified, fragmented enzymatically, and annealed to arrayed primers, promoting sites for templatedependent DNA polymerase extension reactions by using four fluorescently labeled dideoxynucleotides. Each base is probed with two primers, one for the sense and another for the antisense strand (5). GENORAMA imaging system and genotyping software (Asper Ltd., Tartu, Estonia, www.asperbio.com) were used for imaging and semiautomatic sequence analysis (Fig. 1). The principle of sequencing by primer extension on oligonucleotide array has been successfully applied for the systematic identification of all common TP53 mutations in human cancers. The TP53 microarray presented here spans exons 2–9 [containing more than 98% of all mutations described so far in human cancer (6)], together with flanking splice sites and introns 5 and www.pnas.org兾cgi兾doi兾10.1073兾pnas.082100599
8 from both strands (total of 1,218 bases; Fig. 2). This system has been designed to allow the detection of most common mutations (missense, nonsense, tandem, insertions, deletions, and complex mutations) and all identified polymorphisms in the TP53 coding sequence. We found that this system allows for sequencing of an average of 97.5% of the arrayed TP53 gene from either sense or antisense strand, whereas 81% of the whole sequence was simultaneously analyzed from both strands. The length of this simultaneous DNA sequence readout (1.2 kb from both strands) outmatches the limits of the current standard for mutation detection, automated dideoxy sequencing. We describe performance of this assay, evaluated by using 100 normal genomic DNA samples from the Estonian population, plus DNA extracted from 11 archival pathology sections (paraffin-embedded resections of primary esophageal cancers), which were demonstrated to contain TP53 mutations by using classical mutation detection methods [temporal temperature gradient gel electrophoresis (TTGE), followed by direct sequencing]. Two silent, six missense, one splice-site mutation, and an insertion were confirmed by both techniques (Table 1). One of the tumors showed a missense mutation at codon 290 by APEX, instead of a silent, point mutation as detected by TTGE plus dideoxy sequencing. In addition, one point mutation, which escaped detection by TTGE plus dideoxy sequencing, was identified by APEX. On the basis of these results, we conclude that the APEX-based TP53 mutation assay provides an accurate and cost-efficient tool for DNA sequence analysis of this frequently mutated gene. Additional oligonucleotides or regions of the TP53 gene can be easily added to the assay. This prototypic assay represents a valuable platform for the development of diagnostic sequencing assays, for TP53 and other genes of interest. Methods Template Preparation. Exons 2–9 of the TP53 gene were amplified
from genomic DNA in three amplicons: exons 2–4 (with 5⬘TGGAAGTGTCTCATGCTGGA and 5⬘-ATACGGCCAGGCATTGAAGT primers), exons 5–6 (with 5⬘-TCTGTCTCCTTCCTCT TCCT and 5⬘-CACTGACA ACCACCCT TA AC primers), and exons 7–9 (with 5⬘-CTCATCTTGGGCCTGTGTTA and 5⬘-GCCCCAATTGCAGGTAAAAC primers). A 20% fraction of the dTTP in the amplification mixture was substituted by dUTP (5, 7). The amplification products were concentrated and purified by ethanol precipitation in the presence of ammonium acetate. Fragmentation and functional inactivation of the unincorporated dNTPs was achieved in a one-step reaction by addition of shrimp alkaline phosphatase (Amersham Biosciences, Piscataway, NJ) and thermolabile uraAbbreviations: APEX, arrayed primer extension; TTGE, temporal temperature gradient gel electrophoresis. §To
whom reprint requests should be addressed. E-mail:
[email protected].
The publication costs of this article were defrayed in part by page charge payment. This article must therefore be hereby marked “advertisement” in accordance with 18 U.S.C. §1734 solely to indicate this fact.
PNAS 兩 April 16, 2002 兩 vol. 99 兩 no. 8 兩 5503–5508
GENETICS
Identification of mutations in the tumor suppressor gene TP53 has implications for the molecular epidemiology and for the molecular pathology of human cancer. We have developed and evaluated an arrayed primer extension assay for covering both strands of a region of the coding sequence containing more than 95% of the mutations described so far in TP53. On average, 97.5% of the arrayed TP53 gene sequence can be analyzed from either sense or antisense strands, and 81% from both strands. A patient DNA sample is amplified and annealed to arrayed primers, which then promote DNA polymerase extension reactions with four fluorescently labeled dideoxynucleotides. The TP53 gene chip spans exons 2–9 plus two introns from both strands. The performance of the assay was evaluated by using freshly extracted genomic DNA, as well as DNA extracted from archival (paraffin-embedded) DNA samples. The arrayed primer extension-based TP53 gene test provides an accurate and efficient tool for DNA sequence analysis of this frequently mutated gene for both research and clinical applications.
Fig. 1. TP53 APEX-based sequencing assay. (A) Grayscale images for each fluorescent dideoxy nucleotide are used for the sequence analysis. (B) Silent mutation in the third base of codon 170 of TP53, analyzed by the GENORAMA software. Signals from the analyzed base are averaged and the signal pattern obtained is compared with the wild-type (wt) reference. Grayscale bitmaps corresponding to all four fluorescent dideoxy nucleotides at the base to be determined are shown enabling visual analysis. A signal in the sense area and T in the antisense area are indicative for mutation in the current tumor sample. The distance and reference information consist of: (i) the distance measure of the given signal pattern from the wt reference pattern; (ii) the wt base with relative signal intensities at four (A, C, G, and T) fluorescence channels; (iii) percentage of the signal pattern at the wt reference cluster database for the given base; and (iv) index given by the GENORAMA software.
cil N-glycosylase (Epicentre Technologies, Madison, WI) (5) and heat treatment. Oligonucleotide Microchips. APEX primers were designed, according to the wild-type sequence of the human TP53 gene (accession
no. U94788) for both sense and antisense directions. The 25-mer oligonucleotides with 12-carbon amino linkers at their 5⬘ end were obtained from Genset (Paris). Used for spotting the oligonucleotides were 24 ⫻ 60 mm aminosilane plus phenylene diisothiocyanate-coated microarray slides (8) (Asper, Ltd.).
Fig. 2. Performance of the APEX-based sequencing in different regions in the TP53 gene. In some regions of the gene, sense and antisense strands have different performance in APEX. For instance, in exon 7, which can be viewed as an extreme case, the antisense strand signals are very good. At the same time the signals from the sense strand perform below the average level. (A) Performance of oligos corresponding to different regions of the p53 gene from sense (s) and antisense (as) strands is shown with data from two independent series of experiments. The upper bar (1) represents APEX performance from 20 repeated APEX reactions with the same wild-type reference DNA, whereas only the automatically clustered signal intensities are used. The lower bar (2) represents visually corrected data from 100 healthy individuals sequenced by APEX. Both of the patterns are highly overlapping. (B) Color code and scale for the image. Oligos with signals matching the wt sequence at least in 75% of experiments are shown black. Oligos with zero signals or signals different from the wt sequence are shown yellow, orange, or red. 5504 兩 www.pnas.org兾cgi兾doi兾10.1073兾pnas.082100599
To˜nisson et al.
Codon
8
172 315 175 213 170 Intron 5 splice 179 170 273 290 290 164 286 175 213
10 13 15 16 20 22 25 31 48 53
11
Amino acid
TTGE ⫹ sequencing
APEX
GTT3TTT TCT3TGT CGC3CAC CGA3CGG ACG3ACA TAG3TAA
Val3Phe Ser3Cys Arg3His Arg Thr
⫹ ⫺ ⫹ ⫹ ⫹ ⫹
⫺ ⫹ ⫹ ⫹ ⫹ ⫹
CAT3CGT ACG3ACACG CGT3TGT CGC3CGA CGC3CCC AAG3ACG GAA3AAA CGC3CAC CGA3CAA
His3Arg ins 2 bp Arg3Cys Arg Arg3Pro Lys3Thr Glu3Lys Arg3His Arg3Gln
⫹ ⫹ ⫹ ⫹ ⫺ ⫹ ⫹ ⫹ ⫹
⫹ ⫹* ⫹ ⫺ ⫹ ⫺ ⫹ ⫹ ⫹
13
12
Nucleotide
Total
Concordance with TTGE plus dideoxy sequencing as the reference was 10 of 13. One mutation was identified in the same codon by APEX compared with dideoxy sequencing (sample 31). One mutation was identified by APEX only (sample 8). *Presence of mutated base (A) determined from the sense strand only.
Primers were diluted to 50 M concentration in 100 mM carbonate buffer, pH 9.0, and spotted onto the activated surface with Affymetrix 417 arrayer (Affymetrix, Santa Clara, CA). The slides were blocked with 1% ammonia solution and stored at 4°C until needed. Washing steps with 95°C water and 100 mM NaOH were performed before APEX reactions to reduce the background fluorescence and avoid rehybridization of unbound oligonucleotides to the APEX slide. Genomic DNA Samples from Estonian Population. The genomic DNA
samples from healthy individuals were obtained from the Institute of Molecular and Cell Biology, University of Tartu兾Estonian Biocentre, and comprised a subset of samples collected within the framework of the project The Influence of Genetical and Environmental Factors on Health of Estonian Population of the Estonian Ministry of Social Affairs. The project had been approved by the ethics committee of University of Tartu. Informed consent was signed by all the participants of the study. APEX-Based Resequencing. One-third of a product from 50 l of
PCR was used for each primer extension reaction. The APEX mixture consisted of 10 l of fragmented product, 4 units of Thermo Sequenase DNA polymerase (Amersham Pharmacia), 2 l of Thermo Sequenase reaction buffer (260 mM Tris䡠HCl, pH 9.5兾65 mM MgCl2) (Amersham Pharmacia), and 2 M final concentration of each fluorescently labeled ddNTP: Texas RedddATP, Cy3-ddCTP, fluorescein-ddGTP, Cy5-ddUTP (Amersham Pharmacia; NEN). The DNA in buffer was denatured at 95°C for 5 min. The enzyme and dye terminators were immediately added to other components, and the whole mixture was applied to prewarmed slides at 58°C. The reactions were allowed to proceed 20 min under parafilm and stopped by washing at 95°C for 2 ⫻ 90 s in MilliQ water. A droplet of SlowFade Light Antifade Reagent (Molecular Probes) was applied to the microchips to limit bleaching of the fluorescein. The slides were imaged with the Genorama imaging system (Asper, Ltd.), at 20-m resolution. The TP53 gene sequence and mutations were identified by To˜ nisson et al.
d⫽
冘
冑
共N c ⫺ Ns兲2,
where Nc is the signal intensity of the given nucleotide (A, C, G, and T) in the cluster database, and Ns is the signal intensity of the given nucleotide of the DNA sample. Results Oligonucleotide Design. Each base in TP53 is identified by two
unique 25-mer oligonucleotides, one for sense and one for antisense strand (total of 2,436 oligonucleotides for the analyzed sequence). The oligonucleotides are based on TP53 wild-type sequence (accession no. U94788), with their 3⬘ends one base upstream of the base to be identified. The vast majority of these oligonucleotides performs well in APEX. A fraction of the oligonucleotides formed secondary structures, either enabling signals from self-priming or interfering with annealing to test DNA, and therefore needed redesigning. Although the 3⬘ end and its proximity of the primers cannot be modified, the internal part of the primer may be changed by incorporating a mismatch without seriously affecting the target-specific priming ability. Oligonucleotides for 5.9% of the sequenced bases from either strand were redesigned by introducing a mismatch to reduce the stability of the predicted dimers and avoid self-priming. After modification, 62% of these oligonucleotides generated signals only in the presence of target DNA and not from oligonucleotide dimers; 21% of the modified oligonucleotides did not give any signal either from the target DNA or self-priming because of their reduced hybridization ability; 17% of the modified sequences produced weak or undetectable signals in half of the experiments. None of the modified oligonucleotides generated false-positive signals in the absence of the target DNA. Some areas of the gene are difficult to sequence from both strands (Fig. 2 A) for multiple reasons, including sequence repeats, regions with very high GC content, sequences corresponding to oligonucleotide with AT-rich 3⬘ ends, etc. However, only a very limited number of bases (2.5% on average) were not detected from either strand at the present state of assay development. Sequence Analysis Algorithm. As a general strategy in APEX, the sequence can be identified either from a single experiment or interpreted on the basis of a statistical analysis. Statistical analysis facilitates identification of deviations from the wild-type reference signal pattern indicative of mutations (Fig. 1B). The level of possible secondary signals in the wild-type reference is useful for determining a threshold for acceptance or rejection of signals interpreted as mutations. A sequenced wild-type genomic DNA from a healthy individual was used to create a reference database of signal patterns. The signals from all of the oligonucleotides were analyzed by a clustering algorithm, grouping the signal patterns from four fluorescence channels. Each base in the sample was compared with the wild-type reference, and the value of the distance (see Methods) between the signal pattern and the corresponding wild-type base was used as a measure for calling the given base. Zero distance indicates a perfect match between the given base and the wild-type reference base. The analysis was performed in an automated manner, and only a subset of signals needed visual examination. PNAS 兩 April 16, 2002 兩 vol. 99 兩 no. 8 兩 5505
GENETICS
Mutation Sample
genotyping software by using clustered signal patterns from a sequenced wild-type DNA as the statistical reference. The distances of signals from the clusters were used as measures of match with the wild-type gene sequence. Distance (d) of the sample signal pattern compared with the signal patterns in the wild-type reference cluster database were calculated as follows: GENORAMA 3.0
Table 1. Mutations detected by TTGE and APEX assays
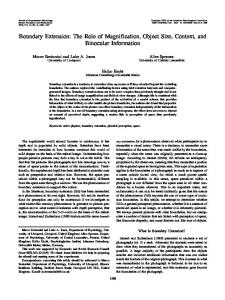
Fig. 3. APEX sensitivity for the fraction of mutated DNA. Relationship between the fraction of mutated DNA and the value of distance measure from the wild-type reference signal pattern. PCR products from two cDNA clones with known missense mutations Arg273His (CGT3 CAT) and Arg248Trp (CGG3TGG) were used for the titration. Both mutations are analyzed at the DNA strand with G to A change. Five percent content of mutated DNA is detectable in both cases (indicated by circles). Error bars represent the standard deviations.
APEX Performance in TP53 Sequencing Tests with Numerous Samples.
To evaluate performance of the TP53 APEX assay in large-scale studies, 100 normal DNA samples from the Estonian population were tested for common, single-nucleotide polymorphisms and for possible point mutations. A common single-nucleotide polymorphism in exon 4 (Arg-72 3 Pro; Arg72Pro) was found with minor allele frequency of 0.26. The identified single-nucleotide polymorphism matches the Hardy–Weinberg equilibrium by the calculated 2 value (P ⬎ 0.05). We also detected two silent point mutations in codons 36 (CCG to CCA) and 139 (AAG to AAA) (6) in two analyzed samples. The first one may correspond to a rare polymorphism, which has been identified in up to 4% of the general population (9). At present, no evidence has been published regarding the status of silent mutation at codon 139, but it cannot be ruled out that it might also correspond to a previously unrecognized, rare polymorphism. On average, 97.5% of the arrayed TP53 sequence was identified in our current version of the TP53 assay from either sense or antisense strand, and 81% from both strands. In the best cases, respectively, up to 99.8% and 96% of the sequence were analyzed. Sensitivity for Mutated DNA. DNA extracted from tumor samples
always contains a background of normal DNA. APEX sensitivity for the minimal identified percentage of mutated DNA was titrated by mixing PCR products obtained from the mutant (Arg248Trp and Arg273His) TP53 cDNA clones at different ratios (Fig. 3). The mutations are located in different exons, and the clones were therefore used as a competitor fraction of normal DNA for each other. The signal patterns were different from the wild type, and both mutations were detected even if the sample contained as little as 5% of mutant DNA. The samples with zero percent of mutated DNA were matching the wild-type reference DNA (Arg273His with zero distance and Arg248Trp with a distance value of 3). The mixed samples with 5% of mutated DNA, on the contrary, did not match the signal pattern of the reference wild-type sample (average distances, 19 for Arg273His and 58 for Arg248Trp). In fact, 5% of the mutated DNA allowed identification from the analysis software window (Fig. 1B) by eye. APEX sensitivity to detect deletions was titrated with del 13–19 TP53 cDNA clone. The first base after deletion is detected instead of the first deleted base (10, 11). The deletion was detected with sensitivity equal to a point mutation
5506 兩 www.pnas.org兾cgi兾doi兾10.1073兾pnas.082100599
Fig. 4. APEX sensitivity for detecting deletions. Detailed patterns of signal intensities in the deletion area. The actual footprint (with weaker or missing signals) exceeds the deleted sequence by 13 to 15 bases in the 3⬘ direction from either strand because of partial annealing with the target sequence. The first base after deletion is detected instead of the first deleted base. Because of cDNA used as the template, intron 3 footprint (IFP) is detectable in the antisense strand.
by analyzing first base after the deletion. The complementing algorithm, based on detection of decreased signal intensities and deletion-specific footprint was less sensitive and required at least 15% mutant sequence for detection (Fig. 4). The actual footprint (with missing or weaker signals) exceeds the deletion by 13–15 bases at 3⬘ direction from either strand because of the partial annealing with the target sequence (Fig. 4). Blind Test with Tumor Samples. The tumors tested were from a
series of squamous cell carcinomas of the esophagus collected in Iran between 1992 and 1998. These cancers often contain TP53 mutations and are very good examples of a type of cancer in which TP53 mutation analysis may have a strong impact in clinical and epidemiological applications. Eleven samples, with a total of 12 point mutations and a 2-bp insertion in TP53, previously identified by TTGE plus manual or automated dideoxy sequencing of the extracted heteroduplex band, were used in a blind test for sensitivity and accuracy of APEX. Sequencing of the heteroduplex band has superior sensitivity to direct sequencing but requires gel purification of the PCR product. The total number of mutations determined was similar in both techniques. Two silent, six missense, one splice site mutation, and an insertion were concordantly identified (Table 1). A missense mutation at the codon 290 was found by APEX instead of a silent point mutation as identified by TTGE plus To˜ nisson et al.
dideoxy sequencing. One missense mutation not previously identified by TTGE plus sequencing was de novo identified by APEX. Only wild-type APEX signals were present in two samples, where missense mutations were previously determined.
To˜ nisson et al.
Fig. 5. Missense mutation Arg273Cys CGT3 TGT, difficult to identify by automated dideoxy sequencing. (A) First base of TP53 codon 273, analyzed by APEX-based sequencing. The signals corresponding to T in the sense strand and A in the antisense strand are indicative for mutation. (B) Automated dideoxy sequencing images corresponding to the Arg273Cys mutation from both DNA strands. The indicated mutation-specific peaks are in the range of the background noise and can be easily missed by visual analysis.
sequencing. Two silent, six missense, one splice-site mutation, and an insertion were concordantly identified (Table 1). A missense mutation at the codon 290 was found by APEX instead of a silent-point mutation as identified by TTGE plus dideoxy sequencing. One missense mutation not previously identified by TTGE plus sequencing was de novo identified by APEX. Two samples with missense mutations escaped identification by APEX. However, in these specimens, identification of the mutation was possible only by dideoxy sequencing of a PCR product generated from excised TTGE bands with abnormal migration patterns, indicating that mutant DNA was present only in a tiny fraction of the tumor. The latter results suggest that performance and sensitivity of the APEX-based sequencing could be enhanced and all of the mutations possibly identified by use of enrichment techniques such as microdissection of tumor cells from the sample. In conclusion, we have developed and evaluated an APEXbased sequencing test at the scale of the almost complete TP53-coding sequence, providing an accurate and cost-efficient tool for DNA sequence analysis of this frequently mutated gene. Novel analysis algorithms were developed enabling automatic sequencing. The evaluation test with tumor samples showed performance comparable with one of the most sensitive and also laborious technologies available, dideoxy sequencing of heteroduplex band obtained by TTGE. However, due to the reduced number of steps in template preparation and the possibility of performing automated analysis, APEX is much more suitable for developing tests for high-throughput in clinical diagnostics and large scale epidemiological studies. Note Added in Proof. When this manuscript was in process, a paper describing the resequencing of exon 7 in the TP53 gene was published (21). We thank Dr. A. Kristjuhan and V. Jaks, who kindly provided the mutant TP53 cDNA clones; E. Haamer, L. Land, I. Valvas, and V. Soo for technical assistance; Dr. K. Kask for critical reading of the manuscript; and Mrs. Krista Liiv for superior organizing work throughout the whole project. This work was supported in part by research grants from the European Community (IC15-CT98-0309), the Estonian Science Foundation (4479), and the Estonian Ministry of Education (Core Grant 0181518s98). A. Metspalu received the Visiting Scientist Award of the International Agency for Research on Cancer, Lyon, France. PNAS 兩 April 16, 2002 兩 vol. 99 兩 no. 8 兩 5507
GENETICS
Discussion A practical approach to TP53 mutation screening has to combine affordable cost, high throughput, high specificity, and high sensitivity. So far, the most advanced, current alternative to dideoxy sequencing is the GENECHIP p53 assay (Affymetrix, www. affymetrix.com), which has been recently evaluated (12–14). The Affymetrix chip has good overall performance but a limited ability to detect deletions and insertions. Promising efforts have been made to couple the oligonucleotide array technology to single-base extension reaction by the DNA polymerase (10). Another recent approach, pyrosequencing, has shown accurate results for detection of mutations in a few exons of TP53 (15). The currently described APEX-based sequencing approach by comparing a sample with the wild-type reference by the distance measure is comparable with the GENECHIP p53 assay where a score from a mixture of variables between the wild-type reference and a given sample is calculated. The higher the score for a probe set contributing to a given base, the higher the likelihood for the base being mutated (12, 14). In the GENECHIP p53 assay, the single cutoff level for calling mutations has been reported to be unsatisfactory (14). The same situation could apply to the TP53 APEX-based sequencing assay, but further studies are needed to evaluate the possible benefit of approaching each base as a separate entity. The applicable cutoff value for base calling also depends on whether the sample is analyzed for germ-line or somatic mutations. In the current work, prescan of the sequence was made with a general cutoff distance. The positions exceeding the threshold distance from the wild-type signal pattern were visually verified. Just one APEX oligonucleotide per each sequenced base and the general low noise makes possible the fast visual inspection at positions where the software is giving ambiguous results. The results from the 100 healthy individuals analyzed are encouraging for applying APEX in large-scale TP53 studies, whereas single-nucleotide polymorphism data can have an impact on the analysis of individual risks or of cancer outcome. The identified Arg72Pro polymorphism has recently been proposed to play a role in tumorigenesis. Controversial evidence exists that the Arg-72 allele might be more sensitive to degradation induced by the oncoproteins of human papilloma viruses, suggesting that this polymorphism may predispose to cervical cancer (16). On the other hand, recent studies have shown that the cellular interactions of mutant p53 protein may be different depending of the allelotype of codon 72 (17). The fact that our assay can simultaneously perform mutation detection and correct identification of codon 72 status adds further weight to its usefulness as a one-step assay in clinical or epidemiological studies. The TP53 detection limit for known alleles was identified as low as in 5%. The actual limit could sometimes be even less than 5%, but in real life the possible alleles are mostly unknown and reliable control and comparison with results obtained with standard methods can be technically difficult because of their own error rates. The dideoxy chain termination sequencing (ref. 18; Fig. 5) and the pyrosequencing (15) are operating at a 30% detection limit of mutation-specific signals. Heteroduplex analysis techniques like TTGE have 10⫺2 sensitivity under optimized conditions (19), but the most commonly used screening method, single-strand conformational polymorphism, has been shown to produce also 5% false-positive results (20). A potential explanation is misincorporation of bases in PCR. Therefore, the fraction of mutated DNA was not further diluted, and the TP53 APEX-based sequencing was evaluated with tumor samples in a blind test. The total number of mutations determined in 11 esophageal cancer samples was similar by both APEX and TTGE plus
1. Thorlacius, S., Borresen, A. L. & Eyfjord, J. E. (1993) Cancer Res. 53, 1637–1641. 2. Wen, W. H., Reles, A., Runnebaum, I. B., Sullivan-Halley, J., Bernstein, L., Jones, L. A., Felix, J. C., Kreienberg, R., el-Naggar, A. & Press, M. F. (1999) Int. J. Gynecol. Pathol. 18, 29–41. 3. Aas, T., Borresen, A. L., Geisler, S., Smith-Sorensen, B., Johnsen, H., Varhaug, J. E., Akslen, L. A. & Lonning, P. E. (1996) Nat. Med. 2, 811–814. 4. Cabelguenne, A., Blons, H., de Waziers, I., Carnot, F., Houllier, A. M., Soussi, T., Brasnu, D., Beaune, P., Laccourreye, O. & Laurent-Puig, P. (2000) J. Clin. Oncol. 18, 1465–1473. 5. Kurg, A., To ˜nisson, N., Georgiou, I., Shumaker, J., Tollett, J. & Metspalu, A. (2000) Genet. Test 4, 1–7. 6. Hernandez-Boussard, T., Rodriguez-Tome, P., Montesano, R. & Hainaut, P. (1999) Hum. Mutat. 14, 1–8. 7. Cronin, M. T., Fucini, R. V., Kim, S. M., Masino, R. S., Wespi, R. M. & Miyada, C. G. (1996) Hum. Mutat. 7, 244–255. 8. Guo, Z., Guilfoyle, R. A., Thiel, A. J., Wang, R. & Smith, L. M. (1994) Nucleic Acids Res. 22, 5456–5465. 9. Felix, C. A., Brown, D. L., Mitsudomi, T., Ikagaki, N., Wong, A., Wasserman, R., Womer, R. B. & Biegel, J. A. (1994) Oncogene 9, 327–328. 10. Head, S. R., Rogers, Y. H., Parikh, K., Lan, G., Anderson, S., Goelet, P. & Boyce-Jacino, M. T. (1997) Nucleic Acids Res. 25, 5065–5071. 11. To ˜nisson, N., Kurg, A., Lo ˜hmussaar, E. & Metspalu, A. (2000) in Microarray Biochip Technology, ed. Schena, M. (Eaton Publishing, Natick, MA), pp. 247–263.
5508 兩 www.pnas.org兾cgi兾doi兾10.1073兾pnas.082100599
12. Ahrendt, S. A., Halachmi, S., Chow, J. T., Wu, L., Halachmi, N., Yang, S. C., Wehage, S., Jen, J. & Sidransky, D. (1999) Proc. Natl. Acad. Sci. USA 96, 7382–7387. 13. Wen, W. H., Bernstein, L., Lescallett, J., Beazer-Barclay, Y., Sullivan-Halley, J., White, M. & Press, M. F. (2000) Cancer Res. 60, 2716–2722. 14. Wikman, F. P., Lu, M. L., Thykjaer, T., Olesen, S. H., Andersen, L. D., Cordon-Cardo, C. & Orntoft, T. F. (2000) Clin. Chem. 46, 1555–1561. 15. Garcia, C. A., Ahmadian, A., Gharizadeh, B., Lundeberg, J., Ronaghi, M. & Nyren, P. (2000) Gene 253, 249–257. 16. Storey, A., Thomas, M., Kalita, A., Harwood, C., Gardiol, D., Mantovani, F., Breuer, J., Leigh, I. M., Matlashewski, G. & Banks, L. (1998) Nature (London) 393, 229–234. 17. Tada, M., Furuuchi, K., Kaneda, M., Matsumoto, J., Takahashi, M., Hirai, A., Mitsumoto, Y., Iggo, R. D. & Moriuchi, T. (2001) Carcinogenesis 22, 515–517. 18. Rosenblum, B. B., Lee, L. G., Spurgeon, S. L., Khan, S. H., Menchen, S. M., Heiner, C. R. & Chen, S. M. (1997) Nucleic Acids Res. 25, 4500 – 4504. 19. Bjorheim, J., Lystad, S., Lindblom, A., Kressner, U., Westring, S., Wahlberg, S., Lindmark, G., Gaudernack, G., Ekstrom, P., Roe, J., et al. (1998) Mutat. Res. 403, 103–112. 20. Yuan, B., Thomas, J. P., von Kodolitsch, Y. & Pyeritz, R. E. (1999) Hum. Mutat. 14, 440–446. 21. Shumaker, J. M., Tollet, J. J., Filbin, K. J., Montague-Smith, M. P. & Pirrung, M. C. (2001) Bioorg. Med. Chem. 9, 2269–2278.
To˜ nisson et al.