summer sun. Fig. 1: View of the institute building of Fraunhofer Institute for Solar Energy Systems, Freiburg (Germany). The technical facilities, the energy use in ...
Eighth International IBPSA Conference Eindhoven, Netherlands August 11-14, 2003
EVALUATION OF A PARAMETRIC MODEL AND BUILDING SIMULATION FOR DESIGN OF PASSIVE COOLING BY NIGHT VENTILATION
Jens Pfafferott and Sebastian Herkel Fraunhofer-Institute for Solar Energy Systems Heidenhofstraße 2, 79098 Freiburg - Germany
ABSTRACT At the new institute building of Fraunhofer ISE, both mechanical and free night ventilation is used for passive cooling of the offices. The results from a monitoring of room temperatures in 21 office rooms during summer 2002 show that room temperatures exceeds 25 °C in less than 8 % of the working hours, even at high ambient air temperatures. In two offices, experiments were carried out in order to determine the efficiency of night ventilation dependent on air change rate, solar and internal heat gains. During the experiments, meteorological data, air change rates, air temperatures (incl. three-dimensional temperature field), surface temperatures (floor, ceiling, window, and internal wall) and the operative room temperature (globe thermometer) were measured.
inevitably results in a high energy demand. Therefore, the energy demand is reduced by both the building design and the operation management, see [Voss, 2000]. The table below gives the key building informations: gross volume 64,322 m³
net floor area 14,001 m²
working hours
occupants
Mon – Fri 8 a.m. – 8 p.m.
approx. 300
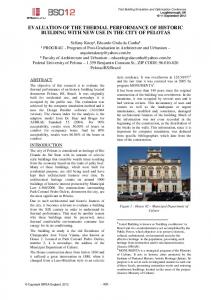
Fig. 1 shows the façade concept with optimised day lighting and solar heat gains: The deep winter sun can be used for passive solar heating while the solar obstruction prevents over-heating by the high summer sun.
The aim is to identify two characteristic building parameters, i.e. the thermal loss factor H and the solar aperture G. Though the night ventilation effect is described only by the thermal loss factor H, the solar aperture G is necessary to determine the complete energy balance for the room. Thus, the night ventilation effect can be separated from other terms in the energy balance. The experiments (one room with and one without night ventilation) are evaluated by using both a parametric model and the ESP-r building simulation programme. While the results from the building simulation match the measurements but deals with many input parameters, the parametric model deals only with two building characteristics and few weather data but does not agree well with measurements at each time step. Therefore, both models are merged in order to develop a method for data evaluation in office buildings with night ventilation and to provide a simple model for integration in a building management system.
INTRODUCTION The institute building of Fraunhofer ISE consists of laboratories and offices, see [www.solarbau.de]. The current use of the building for applied research
Fig. 1: View of the institute building of Fraunhofer Institute for Solar Energy Systems, Freiburg (Germany).
The technical facilities, the energy use in offices and the room temperatures are monitored by a long term measurement. This paper deals only with room temperatures in the office rooms in one of the three wings, Fig. 2. The laboratories (facing North) are mechanically ventilated and must be hydraulically segregated from the corridor. Due to the parallel use of laboratories and office rooms (facing South), the office rooms cannot be ventilated by free cross-ventilation. Thus, there is a need of mechanical ventilation (only exhaust air). The ventilation system ensures a
- 1033 1025 -
minimum air change rate of 1 h -1 during working hours. A heat recovery system recycles the waste energy to the supply air for the laboratories in winter. In summer nights, the air change rate in the office rooms is increased to 5 h -1, Fig. 3.
The different thermal behaviour in these office rooms can be deduced from a graphical analysis, if room temperatures are sorted by the ambient air temperature for the summer period: On the one hand, Fig. 5 shows a similar dependence of room temperatures on the ambient air temperature.
wing C
On the other hand, the difference of room temperatures at a certain ambient air temperature is up to 6 K. These differences caused by the user behaviour, i.e. use of equipment and lighting, window opening and blind control. operative room temperature [°C]
30
Fig. 2: Floor plan. All office rooms in the building wing C are facing South and the laboratories North. The two office rooms (experiments) are on the ground floor. nocturnal ventilation, 5 ac/h
controlled office ventilation, 1 a c/ h
heat recovery system
variable lab ventilation
corridor
shaft
lab
office
Fig. 4 illustrates the room temperatures in four office rooms in the ground floor (subset of 21 office rooms) for the whole year 2002. Despite of identical construction and (almost) same climatic boundary conditions, there are strong differences in temperature level: The room temperatures differs dependent on user behaviour (window opening and sun protection) and internal heat gains (persons and equipment). Each room temperature exceeds 25 °C at less than 10 % of working hours, according to [Deutscher et.al, 2000].
ambient
24 22
operative room temperature [°C]
20 24 28 ambient air temperature [°C]
32
36
30 28 26 24 without night ventilation
22
with night ventilation
20 12
C111
16
As the night ventilation was used only between 15th of July and 31st of August 2002, the operative room temperatures can be classified by days with and without night ventilation. Fig. 6 shows the mean value of the room temperatures which are shown in Fig. 5: Night ventilation reduces the mean room temperature by 1.2 K.
30 C109
C111
Fig. 5: Operative room temperature sorted by ambient air temperature for the working hours during the summer period (01/06/02 – 31/08/02).
Fig. 3: Ventilation of the office rooms with heat recovery in winter and night ventilation in summer. The air exchange can be intensified by single-sided ventilation (windows).
C107
C107
C109
26
12
slit valve
ambient air
C105
C105
20
openable skylight
ventilation louvers
operative room temperature [°C]
exhaust air
28
16
20 24 28 ambient temperature [°C]
32
36
ambient
28
Fig. 6: Mean value of the operative room temperature in the office rooms at the ground floor with (01/06/02 – 15/07/02) and without night ventilation (15/07/02 – 31/08/02).
26 24
The operative room temperatures are evaluated not only for the four office rooms in the ground floor but in all 21 office rooms in wing C:
22 20 8%
18 0
20
40 60 working hours [% of 2.600 h]
80
100
Fig. 4: Frequency distribution of operative room temperatures for the working hours during the whole year (01/01/02 – 31/12/02). The ambient air temperature exceeds 25 °C at 8 % of working hours and its maximum is 37 °C.
- 1034 1026 -
Table 1 shows the working hours with temperatures over 25 °C for each office room. In comparison with Fig. 4, the room temperature exceeds 25 °C in some rooms less (e.g. C205 and C209) and in some rooms more (e.g. C309 and
C317) frequent than in the office rooms at the ground floor. This can be attributed to the user behaviour, too. Fig. 7 shows the mean day for the working days during the summer 2002. The mean operative room temperature in each of the three floors are sorted by time. Due to thermal stratification and solar radiation (static sun protection for the office rooms on the gorund floor by the attached building), there is an increase in temperature of 0.5 K from one floor to the next.
operative room temperature [°C]
26
RT_C1 25
RT_C2 RT_C3
24
23
22 0:00
4:00
8:00
12:00
16:00
20:00
0:00
Four periods were defined for detailed data evaluation. Each period is characterised by (almost) regularly oscillating climatic conditions. Table 3 gives an overview over the main experimental set ups and boundary conditions. Fig. 8 shows measured temperatures in the office room with night ventilation from 2 am to 7 am for 24th of April 2002: As expected, the fluctuation of air temperature is higher than of operative room temperature. According to the temperature stratification, the surface temperature at the ceiling is higher than at the floor. Due to its small heat storage capacity and high heat conductivity the temperature fluctuation at the internal wall (adjacent to a similar office room) is higher than at the floor or the ceiling. But the most notable result is that the wall-mounted air-thermometer “RT_C115” for long term measurement do not give the air temperature at a certain time. The temperature is partly influenced by the wall temperature (adjacent to the corridor) but shows a sufficient match to the operative room temperature for a long period.
Fig. 7: Operative room temperature in the office rooms for the working days between 01/06/02 and 31/08/02: mean day. room / air / surface temperature [°
30
In the following, experiments and data evaluation based on a parametric model and building simulation is used to describe this differing thermal behaviour.
EXPERIMENT In April 2002 (28/03/2002 – 07/052002), some experiments were carried out in two office rooms in order to determine the effect of night ventilation. While one room was passively cooled by night ventilation the other room was not cooled (reference room). A small ventilator was used to draw a defined air flow rate through the office room during night (2am – 7 am), instead of the exhaust fan (see Fig. 3). During day the air change rate is dependent on the ventilation system and the status of flaps and windows in the two office rooms and the adjacent rooms (see Fig. 3). This interrelationship was taken into account by a simple air flow network to calculate the air change rate in each office room. Besides air, surface and operative room temperature, the air change rate was measured using tracer gas technique. The internal heat gains were “simulated” by a fan heater with a thermal energy performance of 980 W from 8 am to 6 pm. The venetian blinds were either closed or opened during the whole day. As the air flow rate caused by natural ventilation is the most uncertain parameter, detailed measurements were repeated several times in order to validate the air flow model. Table 2 shows some results from these measurements in ordinary operation.
28
air temperature operative room temp. surface : internal wall
26
surface : floor surface : ceiling RT_C115
24
22
20 night ventilation 18 0:00
4:00
internal (and solar) heat gains 8:00
12:00
16:00
20:00
0:00
Fig. 8: Temperature fluctuation in the office room with night ventilation (air change rate 4 h-1 ) at 24 th of April 2002.
There are many data from the experiments and the long term measurements but neither Table 3 nor Fig. 8 provides data for comparison of night ventilation, because there are thermal influences which affect the energy balance in addition to the night ventilation. In the following, two models are introduced in order to evaluate the contribution of night ventilation to the energy balance and the temperature behaviour in an office room: Parametric model and building simulation. Both methods aim at a separation of night ventilation from other influences and effects, such as user behaviour (blind control and window opening), effect of heat storage capacity or internal heat gains.
PARAMETRIC MODEL The experiments can be evaluated with a very simple energy balance equation. Taking the most important energy fluxes into account, two main equations (eqn. 2 and 3) can be derived to calculate the mean air temperature Ti,m and its fluctuation ∆Ti according to
- 1035 1027 -
[Keller, 1997]. In case all boundary conditions oscillate regularly, the variation of temperature with time can be approximated by eqn. 1 with eqn. 2 and 3:
T i,m = T a,m +
∆T i =
(1)
G ⋅ I m + Q m Aext .wall H
T 2 ⋅π ⋅C K
G ⋅ ∆I + ∆Q ⋅ ∆T a + H
(2) (3)
6
In this paper, the data evaluation deals only with the mean air temperature (eqn. 2) for certain periods during the experiments. These periods are characterised by the mean ambient air temperature Ta,m , the mean global solar radiation on the surface Im , and the mean internal heat gain Qm . All heat fluxes are related to the external wall area. The thermal loss factor H (with the surface area A of the external wall in m², air change rate ACH in h-1 and V in m³, all thermal characteristics in SI units) and the solar aperture G (with the surface area A of transparent surfaces in m² and their total solar energy transmittance g) are defined as: H =
G=
1 Aext .wall
n (c ⋅ ρ )air ⋅ ∑ Aext .wall,i ⋅ U i + ACH ⋅ V ⋅ 3600 i =1
k 1 ⋅ ∑ Atrans.surface ,i ⋅ g i Aext .wall i =1
(4)
(5)
The ground floor area is 18.4 m², the external wall area 12.4 m² and the gross volume 60.6 m³. There are some simplifications in this model: (1) the total solar energy transmittance g is independent from the incident angle, (2) shading is not taken into account, (3) constant air change rates, (4) no transient thermal behaviour, (5) fixed heat transfer coefficients, (6) no time shift between ambient air temperature and solar radiation, (7) user behaviour is calculated by a standardised time profile, (8) there is no solar radiation on external walls and (9) no heat flux through internal walls. (10) As night ventilation operates with an high air change rate during night and a lower air change rate during working hours, a variable air change rate necessarily has to be taken into account. While a constant temperature difference between inside and outside is assumed, a thermally effective air change rate ACHeff should be calculated from hourly data by:
∑ [ACHt ⋅ (Ti ,t 24
ACHeff =
t =1
− Ta ,t
∑ (Ti ,t − Ta,t ) 24
)] (5)
t =1
Fig. 9 compares the thermal loss factor H from measurements by parameter identification using
thermal loss factor H [W/m²/K]
T i (t ) = T i,m + ∆ Ti ⋅ sin(ω ⋅ t )
eqn. (2) with the calculated H-value from eqn. (4) for the four periods which are defined in Table 4. Both models correlate better without (white points) than with (black points) night ventilation, as the parametric model is based on a constant air change rate: Though the air change rate in the room without night ventilation varies during the day (around 1 h-1), too, the variation in the room with night ventilation is much higher (day: approx. 1 h -1, night: max. 5 h -1).
5 3 1 4
4 No. of period
2
3
2
4
1
3 2
meas : with night ventilation meas : without night ventilation calc : with night ventilation
1
calc : without night ventilation
0 0
20
40 60 80 thermally effective air flow rate [m³/h]
100
120
Fig. 9: Thermal loss factor H from measurements and parametric model for 4 periods.
Though there is only a weak correlation between the H-values from measurement and from calculation, the parametric model can be used in principle, but the assumptions and simplifications have to be taken into account.
BUILDING SIMULATON The ESP-r simulation programme 4.37a of June 2002 [Clarke, 2001] was used for data evaluation, apart from the parametric model. All input parameters and boundary conditions (i.e. climate, blind control, air flow rates, internal heat gains, user behaviour) are well known. The building characteristics (i.e. heat transfer coefficients at internal walls, solar absorption at the external wall, g-value and thermal conductivity of the ceiling) are known approximately and can be fitted to the measurements. Fig. 10 compares the operative room temperature from measurement (globe thermometer) and simulation for two days. (The building simulation has been performed not only for the 4 periods, but for the whole experiment.) Additionally, the results from the parametric model (H=4.0 W/(m² K) and G=0.046 for the 1st period) are shown. While the simulation model was set up with the data from April (parameter identification), the accuracy of the simulation model is checked with data from July 2002 when the office rooms were under ordinary operation. The internal heat gains, the operation of the ventilation system, the status of flaps, windows and blinds are well known. In contrast to the simulation with the measured air change rates from
- 1036 1028 -
the data in April, the air flow rate (infiltration from outside, ventilation with adjacent zones and exhaust air from the ventilation system) is calculated by the simulation. Fig. 11 shows a good agreement between measurement and simulation results. 28 operative room temperature [°C]
measurement
simulation
parametric model
26 24 22 20 18 16 144
hour of experiment168 (03/04/02 - 04/04/02)
192
Fig. 10: Variation of temperature with time for two days: measurements, simulation and parametric model (eqn. 1 with H, G and C calculated for the 1st period of experiment in April 2002, Table 3). Parameter identification.
ambient
operative room temperature [°C]
A promising approach for data evaluation is to transfer the results from a parameter identification with the building simulation to the parametric model: First, the simulation model is fitted to extensive measurements (here: April simulation). This model is validated with measurements from the building under ordinary operation (here: July simulation). At last, the simulation model can be used for data evaluation with standardised boundary conditions and operation. As a single office room should be characterised, adiabatic boundary condition are introduced at the internal walls in order to prevent heat flux between adjacent rooms. The simulation has been carried out with fixed air change rates separately for day and night, sun protection on or off, no internal heat gains and climatic data from 28th July of 2002 with Ta,m =23.8 °C and the vertical solar radiation on the South facade Im =160 W/m². Table 5 shows the input parameters (air change rate and g-value) and Fig. 12 the simulation results with (a) the effect of night ventilation and (b) sun protection on the indoor air temperature: In this case, night ventilation reduces the mean indoor temperature by 2 to 3 K dependent on sun protection, sun protection by 3 to 4 K dependent on night ventilation and both night ventilation and sun protection by 5.7 K.
30
27
overestimate the thermal loss factor H about 10 %, Table 4.
measurement simulation
24
21
18
15 24.7
25.7
26.7
27.7
28.7
29.7
30.7
32
31.7
30
Fig. 11: Comparison between measurements and simulation in July 2002 for ordinary service. Model validation.
air temperature [°C]
28
Thus, the simulation model is validated with measurements from two different periods (April and July) and can be used for data analysis. The assumptions, which are made in the parametric model, can be taken into account, if the heat fluxes are calculated accurately by the building simulation programme. This is described in the next chapter.
26 24 22
ambient without NV, without SP
20
with NV, without SP without NV, with SP
18
with NV, with SP
16 0:00
4:00
8:00
12:00
16:00
20:00
0:00
Fig. 12: Simulation with standardised inputs.
ANALYSIS Starting from realistic assumptions, the parametric model does not agree with transient measurements at a certain time while the building simulation shows a sufficient agreement with measured temperatures. Furthermore, if the same simplified assumptions (i.e. constant air change rate and regularly oscillating ambient temperature) are made for both the extensive building simulation and the parametric model, they will result in the same conclusion: If solar heat gains are ignored and internal heat gains are considered constant during the day, the parametric model will
This simulation is dependent on the thermal behaviour of the room but is independent from the operation. Thus, the building characteristics G and H can be derived from these simulation results, Table 5. In comparison to the thermal loss factor H from experiments in Fig. 9, the thermal loss factor H from the standardised simulation is in the same order of magnitude but lower: As the internal heat gains are smaller in the standardised simulation than during experiments, the heat loss by ventilation is smaller. Noteworthy, there is a negative thermal loss factor, if the office room is cooled by night ventilation and the
- 1037 1029 -
blinds are closed: In this case, the mean indoor air temperature is lower than the ambient air temperature. Eqn. 1 demands a negative H-value, which is delivered by a (mathematically correct, but physically impossible) negative air change rate from eqn. 5.
CONCLUSIONS The building simulation provides accurate results, if input parameters and boundary conditions are well known. However, user behaviour results in energy and temperature variations which are in the same order of magnitude as the effect of different design decisions and operation strategies, respectively. There are two ways to manage these variations with a probabilistic approach and uncertainty analysis: If an extensive building simulation (see [Macdonald, 2001] and [Herkel, 2002]) is performed the effect of each varied parameter on the energy balance and the thermal behaviour can be deduced during the design phase. Statistically distributed events (i.e. user behaviour) affects the energy balance and the indoor temperatures in buildings. Thus, the data evaluation of measurements in buildings under ordinary operation is difficult. The presented parametric model focuses on main building characteristics and provides a simplified thermal model which can be used advantageously for data evaluation. With this model, the thermal behaviour of a building and its energy demand can be characterised independent of user behaviour and operation but dependent on day and night ventilation or blind control. An accurate parametric model can be deduced from a procedure in three steps: 1. Short term measurements (weather, indoor air, surface and operative room temperature, air change rate, sun protection, internal gains, occupancy). 2. The thermal behaviour is simulated by a sophisticated building simulation with the short term measurements as input data and known material properties (g-value, U-value, thermal properties).
whether the original design ideas were realised or not and whether control strategies (i.e. night ventilation and / or sun protection) are realised properly. Moreover, the simplified parametric model can be integrated in (predictive) controller for time and temperature controlled ventilation strategies. During the design phase, different design decisions from a building simulation can be evaluated by these building characteristics in order to compare different techniques for avoiding over-heating in passively cooled buildings.
ACKNOWLEDGEMENTS The research has been funded by the German Ministry of Economy and Technology under the reference O335006X. The building has been designed and realised and is monitored for a long time period in the framework of the German research programme solar optimised buildings “SolarBau”. SolarBau:Monitor as the related accompanying project documents and analyses all SolarBauprojects. This data evaluation has been done in the sub-project MessISE.
REFERENCES http://www.solarbau.de/english_version/doku/proj04/ index.htm Clarke, J., “Energy Simulation in Building Design (2nd Edition)“, Butterworth-Heinemann, 2001. Deutscher P., Elsberger, M. and Rouvel, L., „Sommerlicher Wärmeschutz: Eine einheitliche Methodik für die Anforderungen an den winterlichen und sommerlichen Wärmeschutz“, Bauphysik 22, 2000. (In German.) Herkel, S., Pfafferott, J. and Wambsganß, M., „Design, monitoring and evaluation of a low energy office building with passive cooling by night ventilation”, proceedings of EPIC-conference 2002, Lyon. Keller, B., “Klimagerechtes Stuttgart, 1997. (In German.)
Bauen”,
Teubner,
3. The main building characteristics are derived from the validated simulation model with standardised weather data, operation and user behaviour.
Macdonald, I. and Strachan, P., “Practical application of uncertainty analysis”, Energy and Buildings 33, 2001.
In the context of quality assurance, the presented method (measurement – simulation – building characteristics) can be used in order to check
Voss. K, “Toward lean buildings – examples and experience from a German demonstration program for energy efficiency and solar energy use in commercial buildings”, proceedings of EUROSUN 2000, Copenhagen.
- 1038 1030 -
Table 1:
Working hours [hrs of 2,600 h], when operative room temperature exceeds 25 °C. All 21 rooms in wing C from West “_05” to East “_17, _19 or _21”, see Fig. 2.
X=
05
07
09
11
13
15
17
19
21
RT_C3X
262
277
370
248
293
223
295
260
RT_C2X
140
192
137
163
160
224
215
222
RT_C1X
229
283
188
135
not used
not used
not used
Table 2:
Air change rates from measurements with tracer gas technique. day ventilation (exhaust day ventilation (exhaust free day ventilation fan), windows and flaps without exhaust fan fan), all windows and open only in 1 room flaps open
air change rate [h-1 ]
Table 3:
0.5
night ventilation, all windows and flaps open
2.7
0.3 – 1.7
3.7 – 5.25
period 1
period 2
period 3
period 4
31/03 – 08/04
13/04-15/04 27/04 – 29/04
02/05 – 05/05
19/04 – 26/04
Boundary conditions and results from measurements.
sun protection T a,m [°C]
(venetian blinds)
closed
closed
closed
open
(mean ambient air temperature)
11.31
9.42
8.5
11.97
(mean solar radiation)
204
84
52
134
(mean internal heat gain)
408
408
408
408
I global, m [W/m²] Qm [W]
office room with night ventilation
T i,m [°C]
yes
no
yes
no
yes
no
yes
no
(2 am – 7 am)
3.16
≈1
5.03
≈1
2.16
≈1
5.03
≈1
(mean indoor air temperature)
21.8
22.4
21.1
22.6
20.7
22.8
21.9
22.7
air change rate
Table 4:
226
Model comparison for the thermal loss factor H between parametric model and simulation. 0 h -1
air change rate
1 h -1
4 h -1
H from parametric model with eqn. 4
1.37
3.34
9.25
H from simulation with eqn. 2
1.37
3.07
8.26
difference
0%
8%
11 %
Table 5:
Standardised input parameters (ACH and g ⊥) and results (H and G) for the simulation of two strategies to lower the indoor air temperature: night ventilation and sun protection. no night ventilation, no sun protection
ACH (1 am – 24 am) + NV (2 am – 7 am)
night ventilation, but no sun protection
no night ventilation, but sun protection
night ventilation and sun protection
1 0
1 3
1 0
1 3
g⊥
0.51
0.51
0.11
0.11
H
1.73
3.36
1.67
-134.83
G
0.061
0.066
0.017
0.020
- 1039 1031 -
- 1040 1032 -