digestion,were compared with those obtainedby a manual alkaline ashing technique. Results of automated dialysis were consistently higher than those obtained ...
CLIN.CHEM.36/6, 865-869 (1990)
Evaluation of Automated Urinary Iodine Methods: Problems of Intertering Substances Identified WarwIckMay,1DIanaWu,1Creewell Eastman,1Pierre Bourdoux,2and Glen Maberly1 We evaluated automated methods for measurement of unnary iodine (UI) over a range expected in iodine-replete and
iodine-deficientpopulations.Results obtainedwith Technicon AutoAnalyzer II systems, based on either dialysis or acid digestion,were compared with those obtained by a manual alkaline
ashing
technique.
Results
of automated
dialysis
were consistently higher than those obtained by the other methods. The apparently higher concentrations of UI we measured were due to interfering substances crossing the
dialysismembrane and participatingin the catalyticreaction. Thiocyanate (5CN) was one endogenoussubstancecontributing to the increased measurement of UI. For urinary SCN concentrations of 5 to 15 mg/L, the amountof overestimation
in the UI measurementattributableto SCN rangedfrom21.8 to 61 g/L. However, SCN may accountfor only 40-50% of the apparent increase in UI. In samples with lower UI (15 mg/L are also common in populations consuming cassava in their diet (10,11). We alsodetermined the effect of endogenous USCN for each method. Where sufficient sample remained (n = 38), we determined USCN by using a modified method of Aldridge (12) as described by Bour866 CLINICAL CHEMISTRY, Vol. 36, No. 6, 1990
doux et al. (13). Data analysis. Statistical analysis-linear regression, Pearson’s correlation coefficient (r)-was performed with StatView 512+Tt (Brainpower Inc., Calabassa, CA) on an Apple MacIntosh computer. Results Recovery and precision. The mean (± SD) analytical recovery we obtained in method C, after the addition of radioisotopic and nonlabeled iodine, was 100.3 (2.9)% and 97.8 (7.2)%, respectively. These results are in close agreement with the analytical recoveries published by others who used this method (7, 14). Similarly, method A gave a mean analytical recovery of 99% (SD 3.7%), which accords favorably with the mean recovery of 97% obtained by Gary et al. (5). Iodine-supplemented urine assayed by method B also showed an analytical recovery of 96-97% (authors’
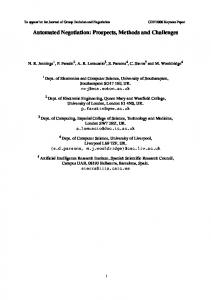
unpublished data). The between-assay precision (CV) for the assay of a control urine with a mean UI concentration of 11.3 zgfL, in a total of 30 alkaline asking assays, was 10.6%. In method A, the between-assay CV for the three urine controls with mean UI concentrations of 24, 45, and 94 p.g/L was 3.8%, 2.5%, and 2.4%, respectively (n = 35 assays). Discrepancy between methods. Figure 1 compares the UI results for the samples in each method. UI is plotted on a log scale, with results of the alkaline asking method used to rank samples in decreasing order. This Figure demonstrates an increase in results obtained in automated dialysis, especially in samples with UI -
4
z
0
10
20
30
40
50
60
SAMPLE NUMBER
Fig. 1. Comparison of UI (zg/L) values obtained by the three differentmethods Alkalineashingresultsused to ranksamplesindecreasing order. Note log scaleof yaxis
3.379x 2l.743,
Table 1. Effect of Exogenous SCN on IodIne Determinations
r
= 0.60
120
0 z
SCN I by SCN Mean(SD) UI, pg/I. added,b digestIon, added, mg/L Dialysis Alk. ashlng mg/L pg/I. 49 2.5 13.8(2.9) OC 16 (0.3) 1.25 21 (0.4)4 16.4(3.0) 5 51 2.5 26 (0.5)d 19 (0.1) 7.5 50 19.4 (2.7) 10 48 5 38 (0.8)” 49 17.4(0.8) 12.5 10 59 (1.2)’ Addedtoanequal volume of urine.b Addedto an equalvolumeof iodine standard. Urinedilutedwith anequalvolumeH20 only(baseline). d Statisticallydifferentfrombaseline (P