we have optimized two image processing and computer vision algorithms,
namely ... age processing algorithms of varying complexity were evaluated over ...
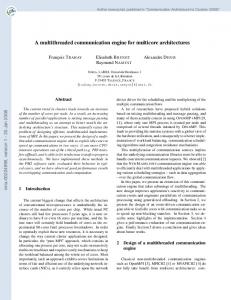
E VALUATION OF M ULTI - CORE A RCHITECTURES I MAGE P ROCESSING A LGORITHMS
A Thesis Presented to the Graduate School of Clemson University
In Partial Fulfillment of the Requirements for the Degree Master of Science Electrical Engineering
by Trupti Patil August 2009
Accepted by: Dr. Stanley Birchfield, Committee Chair Dr. John Gowdy Dr. Tarek Taha
FOR
A BSTRACT Diverse application scenarios and real-time constraints on computer-vision applications have motivated numerous explorations of computer architectures that provide more efficiency through hardware scalability by exploiting the characteristics of image processing and computer vision algorithms. The growing and computational power and programmability of the of multi-core architectures provide great prospects for acceleration of image processing and computer vision algorithms which can be parallelized. This thesis undertakes a novel study to find unique attributes of three widely used algorithms in computer vision, and identifies computer architecture(s) best suited for each algorithm. Significant acceleration over standard CPU implementations is obtained by exploiting data, thread and instruction parallelism provided by modern programmable graphics hardware. We test the following architectures most used for graphics and imaging applications: Intel Pentium 4 HT, Intel Core 2 Duo, NVidia 8 Series GPU and Sony PlayStation3 (PS3) CellBE. Additionally, we have optimized two image processing and computer vision algorithms, namely Canny edge detection and KLT tracking for the PS3. The architectures’ capabilities of handling three image processing algorithms of varying complexity were evaluated over standard inputs. The results are then tabulated for comparison.
ii
D EDICATION I dedicate this thesis to my parents for their example of courage, integrity, and humility; for encouraging me to stand by my conscience and beliefs no matter the risk; and for being my best friends. This thesis is also a dedication to those who believe in the joys of learning.
iii
ACKNOWLEDGMENTS This thesis would not have been possible without the help and support of the following faculty members, colleagues, friends and family. I must begin by thanking my thesis advisor Dr. Stanley Birchfield. His sage advice, patient encouragement, and insightful criticisms aided the writing of this thesis in innumerable ways. For their contributions as committee members and for their helpful suggestions, I owe my gratitude to Dr. John Gowdy and Dr. Tarek Taha, who also generously agreed to let me use his laboratory’s PlayStation 3. I am indebted to my many student colleagues, particularly those from Research Lab 309 who were great sources of pragmatic wisdom, knowledge and humor. I enjoyed the company and support of many others whom I fail to mention here, and I am thankful for their help and friendship. Finally, I wish to thank my best of friends and family for their absolute confidence in me. Most of all, I would like to thank my parents Vijaya Patil and Vikas T. Patil.
iv
TABLE OF C ONTENTS Page TITLE PAGE . . . . . . . . . . . . . . . . . . . . . . . . . . . . . . . . . . . . .
i
ABSTRACT . . . . . . . . . . . . . . . . . . . . . . . . . . . . . . . . . . . . . .
ii
DEDICATION . . . . . . . . . . . . . . . . . . . . . . . . . . . . . . . . . . . .
iii
ACKNOWLEDGMENTS . . . . . . . . . . . . . . . . . . . . . . . . . . . . . . .
iv
LIST OF TABLES . . . . . . . . . . . . . . . . . . . . . . . . . . . . . . . . . .
vii
LIST OF FIGURES . . . . . . . . . . . . . . . . . . . . . . . . . . . . . . . . . .
viii
CHAPTER 1
Introduction . . . . . . . . . . . . . . . . . . . . . . . . . . . . . . . . . . .
1
2
Previous work . . . . . . . . . . . . . . . . . . . . . . . . . . . . . . . . . .
3
3
The Image Processing Algorithms . . . . . . . . . . . . . . . . . . . . . . .
5
3.1
2-D Gaussian Smoothing . . . . . . . . . . . . . . . . . . . . . . . .
6
3.2
Canny Edge Detection . . . . . . . . . . . . . . . . . . . . . . . . .
8
3.3
KLT Feature Tracking . . . . . . . . . . . . . . . . . . . . . . . . .
11
Overview of Architectures . . . . . . . . . . . . . . . . . . . . . . . . . . .
15
4.1
Intel NetBurst Microarchitecture: Pentium 4 with Hyper-Threading .
16
4.2
Intel Core Microarchitecture: Core 2 Duo Mobile . . . . . . . . . . .
19
4.3
Cell Broadband Engine Architecture: PlayStation 3 . . . . . . . . . .
21
4.4
Graphics Processor Unit: Nvidia GeForce 8 Series . . . . . . . . . .
23
Implementation . . . . . . . . . . . . . . . . . . . . . . . . . . . . . . . . .
28
5.1
28
4
5
Gaussian Smoothing . . . . . . . . . . . . . . . . . . . . . . . . . . xi
Table of Contents (Continued) Page 5.1.1
Intel NetBurst Microarchitecture . . . . . . . . . . . . . .
28
5.1.2
Intel Core Microarchitecture . . . . . . . . . . . . . . . .
31
5.1.3
Cell B.E. Architecture . . . . . . . . . . . . . . . . . . . .
31
5.1.4
Graphics Processor Unit . . . . . . . . . . . . . . . . . . .
32
Canny Edge Detection . . . . . . . . . . . . . . . . . . . . . . . . .
34
5.2.1
Intel NetBurst Microarchitecture . . . . . . . . . . . . . .
34
5.2.2
Intel Core Microarchitecture . . . . . . . . . . . . . . . .
36
5.2.3
Cell B.E. Architecture . . . . . . . . . . . . . . . . . . . .
36
5.2.4
Graphics Processor Unit . . . . . . . . . . . . . . . . . . .
37
KLT Tracker . . . . . . . . . . . . . . . . . . . . . . . . . . . . . .
38
5.3.1
Intel NetBurst and Core Microarchitectures . . . . . . . . .
39
5.3.2
Cell B.E. Architecture . . . . . . . . . . . . . . . . . . . .
40
5.3.3
Graphics Processor Unit . . . . . . . . . . . . . . . . . . .
42
Experimental Results . . . . . . . . . . . . . . . . . . . . . . . . . . . . . .
45
6.1
2-D Gaussian Smoothing . . . . . . . . . . . . . . . . . . . . . . . .
45
6.2
Canny Edge Detection . . . . . . . . . . . . . . . . . . . . . . . . .
47
6.2.1
Comparing Canny results . . . . . . . . . . . . . . . . . .
49
KLT Tracker . . . . . . . . . . . . . . . . . . . . . . . . . . . . . .
50
6.3.1
Comparing KLT results . . . . . . . . . . . . . . . . . . .
52
Conclusion and Future Work . . . . . . . . . . . . . . . . . . . . . . . . . .
54
BIBLIOGRAPHY . . . . . . . . . . . . . . . . . . . . . . . . . . . . . . . . . . .
56
5.2
5.3
6
6.3
7
xii
L IST OF TABLES Table
Page
6.1
Gaussian smoothing: Results . . . . . . . . . . . . . . . . . . . . . . . . . .
46
6.2
Canny edge detection: Timing results . . . . . . . . . . . . . . . . . . . . .
47
6.3
Comparing execution time for Canny edge detection on PS3 . . . . . . . . .
49
6.4
Comparing execution time for Canny edge detection on Nvidia CUDA . . . .
49
6.5
Comparison of throughput in KLT Tracking . . . . . . . . . . . . . . . . . .
51
6.6
Comparing execution time for KLT tracking on Nvidia CUDA: . . . . . . . .
52
vii
L IST OF F IGURES Figure
Page
3.1
Input to and output of Gaussian Smoothing . . . . . . . . . . . . . . . . . .
7
3.2
Input to and outputs from each of three stages of Canny Edge Detection . . .
8
3.3
Angles and quadrants . . . . . . . . . . . . . . . . . . . . . . . . . . . . . .
10
3.4
Comparing results of grayscale and color Canny edge detection. L EFT: Input image “Lena” of size 1024×1024 pixels. C ENTER: Output of Grayscale Canny edge detector with σ=0.8, Gaussian kernel size = 5×5. R IGHT: Output of Color Canny edge detector with σ=0.8, Gaussian kernel size = 5×5. . . . .
11
4.1
Intel NetBurst 20-stage pipeline . . . . . . . . . . . . . . . . . . . . . . . .
17
4.2
The Intel Core microarchitecture 14-stage pipeline functionality . . . . . . .
19
4.3
Block diagram of a generic Cell B.E. architecture. L EFT: Structural diagram of the Cell Broadband Engine. T OP RIGHT: The PPE allows application execution, performs I/O and has the PPU in it. B OTTOM R IGHT: Each SPE incorporates its own SPU to perform its allocated computational task, while each SPU has a dedicated memory called the LS. . . . . . . . . . . . . . . .
22
4.4
GPU Data Flow . . . . . . . . . . . . . . . . . . . . . . . . . . . . . . . . .
24
4.5
The CUDA Programming model. L EFT: Grid of thread blocks. R IGHT: CUDA Memory Hierarchy. . . . . . . . . . . . . . . . . . . . . . . . . . . .
25
Mapping of graphics pipeline in NVIDIA GeForce 8 Series GPU. The fragment processor and frame-buffer objects’ direct off-screen rendering capability is frequently used in GPGPU applications. . . . . . . . . . . . . . . . . .
26
5.1
Parallel transposition of the image . . . . . . . . . . . . . . . . . . . . . . .
29
5.2
Border and image pixels during Gaussian smoothing. a) First pass: When Gx is convolved with I. b) Second pass: When Gy is convolved with J. . . . . .
33
The results of 2-D Gaussian smoothing on standard input images. L EFT: Input “Lena” sized 1024×1024 pixels. σ=1.0, kernel size = 5. R IGHT: Input “Mandrill” sized 1024×992 pixels. σ=2.4, kernel size = 5 . . . . . . . . . . .
46
4.6
6.1
6.2 6.3
A comparison of Gaussian smoothing timings on various multi-core architectures, for “Lena.jpg” and “Mandrill.jpg”. . . . . . . . . . . . . . . . . . . .
47
Typical inputs to and results of Canny edge detection. L EFT: Input “Lena” sized 1024×1024 pixels. σ=1.0, kernel size=5. R IGHT: Input “Mandrill” sized 1024×992 pixels. σ=1.2, kernel size=5. . . . . . . . . . . . . . . . . .
48
ix
List of Figures (Continued) Figure 6.4
Page Comparing execution times of Canny edge detection, for “Lena.jpg” and “Mandrill.jpg”. . . . . . . . . . . . . . . . . . . . . . . . . . . . . . . . . . . . .
48
6.5
CUDA profiler output of Canny, for “Lena.jpg” . . . . . . . . . . . . . . . .
49
6.6
Typical results of KLT tracking 600 features for input frame size (720 × 526) pixels. T OP L EFT: Determining good features for Frame 0. T OP R IGHT: Features tracked over Frame 11. B ELOW L EFT: Frame 37. B ELOW R IGHT: Frame 44. . . . . . . . . . . . . . . . . . . . . . . . . . . . . . . . . . . . .
50
Comparing throughput for KLT tracking, for 720× 526 image frame and 600 features. . . . . . . . . . . . . . . . . . . . . . . . . . . . . . . . . . . . . .
51
CUDA profiler output of KLT tracking, for 720× 526 image frame and 600 features. . . . . . . . . . . . . . . . . . . . . . . . . . . . . . . . . . . . . .
52
6.7 6.8
x
Chapter 1 Introduction Image processing is widely used in many fields, including medical imaging, industrial manufacturing, and security systems. Therefore, during the last few decades, there has been an increasing interest in the development and the use of parallel architectures and algorithms in image processing. Fast processing response is a major requirement in many image processing applications. Even when the size of the image is very large, typical vision systems involve real-time processing where a sequence of image frames must be processed in a very short time. The operations performed by image processing algorithms can be computationally expensive due to their manipulating large amount of data. To make a program execute in real-time, the data needs to be processed in parallel and often a great deal of optimization needs to be utilized. However, most of these operations exhibit natural parallelism in the sense that the input image data required to compute a given area of the output is spatially localized. This high degree of natural parallelism exhibited by most of the image processing algorithms can be easily exploited using SIMD parallel architectures and computing techniques. Recently, a number of novel and massively-parallel computer architectures have been introduced that promise significant acceleration of applications by using a large number of compute
cores. The super pipelined processor design approach that pushes the limits of performance by increasing the pipeline length has hit the power wall paving the way for multi-core and/or multithreaded architectures. GP GPUs take advantage of the GPU architectures stream model of computation. The IBM cell processor is another leading commercial processor based on the stream model of computation.
2
Chapter 2 Previous work The introduction of the Intel OpenCV library [4] represents an important milestone for Computer Vision. The motivation behind building and maintaining code libraries is to address reusability and efficiency, by providing a set of data structures and implementations of classic algorithms. In a field like Computer Vision, with a rich theoretical history, implementation issues are often regarded as secondary to the pure research components outside of specialty subfields, such as Real-Time Computer Vision. The Gaussian smoothing operator is a 2-D convolution operator used to remove detail and noise from, that is to ‘blur’, images. Smoothing is a precursor to many image processing algorithms, including Canny edge detection and KLT tracker, discussed futher along in this thesis. For a digital image affected by Gaussian noise, the Gaussian smoothing operation produces superior results at noise removal, but the fine details and the edges of the image become blurred after smoothing [14]. Therefore, it is may be unsuitable to perform classical 2D Gaussian smoothing if preserving details is of importance. For such instances, [10] present a technique in which the filter variance is adapted to both the the local variance and noise characteristics of the signal. We, however, follow the generic and most widely used classical case, and consider the adaptive Gaussian smoothing to be incorporated in future work.
In this thesis we focus on optimized Intel SSE, PS3 and faster GPU implementations of the Canny edge detector [5]. This algorithm has remained a standard in edge finding techniques over the years. Applications of edge detection include their use as features in vision algorithms, their use to improve the appearance of displayed objects, in image coding and others too numerous to discuss. Many implementations of the Canny algorithm have been made on various platforms in the past, including in the earlier GPGPU. A partial Canny edge filter for the GPU has been presented in OpenVIDIA using NVIDIAs Cg shader language [12]. This implementation, however, does not include the hysteresis labeling connected component part. Neoh and Hazanchuk [31] have presented an implementation on the Field-programmable gate array (FPGA), again without the connected components part. In both cases, the reason for the lack of the connected component is related to the need for non-local memory, which causes significant slowdowns. Recently, the algorithm’s implementation on CUDA [29] includes hysteresis labeling and with improved execution time. There has been merely one implementation of Canny edge detection, for color images, on the Cell Broadband Engine architecture (CBEA) [15], which, however, is unoptimized and has potential for speed-ups. Object tracking, although a simple task for humans, is a challenging problem for computer vision systems. Lucas and Kanade proposed a dynamic image registration technique, which made use of the spatial intensity gradient of the images to iteratively find a good match between frames [28]. The KLT model, a generalized extension of [28] by Shi and Tomasi [41], incorporates an affine transform to handle rotation, scaling, and shearing of objects. Highperformance, parallelized GPU based KLT feature tracking from video source has significantly improved the algorithm runtime performance [42] [43] [23] [49].
4
Chapter 3 The Image Processing Algorithms Image processing algorithms can be classified as low-level, intermediate-level and high-level operations [24]. Low-level image processing operations work on an entire image to generate either a single value, a vector,or an image from. Due the involved computations’ local nature, where they work on individual pixels and input image data is spatially localized, low-level operations offer fine grain parallelism [33]. This property of low-level image processing operations can be tapped using SIMD parallel architectures or techniques. Smoothing, sharpening, filtering, convolution, histogram-generation are few examples of low level image processing operations. Intermediate-level image processing operations produce compact data structures like lists from input images. As these computations work only on segments of and not on a whole image, intermediate-level image processing operations offer only only medium grain parallelism. They are more restrictive from data-level parallelism aspect (DLP) when compared to low-level operations. Hough transform, object labeling, motion analysis are examples of intermediate-level image processing operations. High-level image processing operations are characterized as symbolic processing where they work on data structures as input to return other data structures as output that lead to deci-
sions in an application. Also, they usually have irregular access patterns. Due to these properties, high-level operations offer coarse grain parallelism and are difficult to run data-parallel. Position estimation and object recognition are examples of high-level image processing operations.
3.1
2-D Gaussian Smoothing
Noise caused by sensor electronics, and introduced in signal transmission can reduce the visual quality of an image. So, it is desirable to remove it before image analysis. The 2-D Gaussian smoothing is a convolution operation, and a low-level image processing algorithm, that is used to remove detail and suppress noise [9] [14]. Smoothing is among the key techniques in image processing which can be implemented in both spatial domain and frequency domain. Compared with the frequency domain techniques, the spatial domain techniques are faster and easier to implement. It uses a moving kernel that represents the shape of a Gaussian hump. For a pixel, the intensity is replaced with the sum of the product between the intensity values within a neighboring area centered at the pixel and the coefficients of the kernel. Thus, any fine structure that is smaller than the filter’s kernel size gets removed. For a Gaussian function with standard deviation σ, a 1-D Gaussian filter can be written as:
Gx = √
x2 1 e− 2σ2 2πσ
A 2-D, isotropic Gaussian filter can be expressed as a product of two 1-D Gaussians:
Gx,y =
1 − x2 +y2 2 e 2σ 2πσ 2
= Gx Gy
6
The idea of Gaussian smoothing is to use this 2-D distribution as a ‘point-spread’ function, and this is achieved by convolution. Since the image is stored as a collection of discrete pixels we need to produce a discrete approximation to the Gaussian function before we can perform the convolution. Theoretically, the Gaussian distribution is non-zero everywhere, hence requiring an infinitely large convolution kernel, but practically it is effectively zero at more than about three standard deviations from the mean, and the kernel can truncated at this point. Figure 3.1 shows a suitable integer-valued convolution kernel that approximates a Gaussian with a (σ) of 1.0.
Figure 3.1: Input to and output of Gaussian Smoothing The effect of Gaussian smoothing is to blur an image, in a similar fashion to the mean filter. The degree of smoothing is determined by the standard deviation of the Gaussian. (Larger standard deviation Gaussians, of course, require larger convolution kernels in order to be accurately represented.) The Gaussian outputs a ‘weighted average’ of each pixel’s neighborhood, with the average weighted more towards the value of the central pixels. This is in contrast to the mean filter’s uniformly weighted average. Because of this, a Gaussian provides gentler smoothing and preserves edges better than a similarly sized mean filter.
7
Figure 3.2: Input to and outputs from each of three stages of Canny Edge Detection
3.2
Canny Edge Detection
Edge detection is one of the most commonly used operations in image analysis providing strong visual clues that can help the recognition process. Edges are local variations in a image function defined by a discontinuity in gray level values and have strong intensity contrasts. Canny Edge Detection is an optimal edge-detector algorithm that maximizes the probability of detecting true edges while minimizing the probability of false edges [5]. It is an intermediate-level image processing operation implemented in three stages, namely: gradient estimation, non-maximal suppression and edge-linking by hysteresis. The algorithm first smooths the image to eliminate noise through convolution with Gaussian kernel. It then finds the image gradient to highlight regions with high spatial derivatives. To achieve this, a separable Gaussian kernel (Gx , Gy ) and its derivative (G′x , G′y ) need to be generated. The reason behind using a Gaussian kernel is because a Gaussian function is completely described by its first and second order statistics. These kernels can be of variable kernel width (w) and variance (σ).
8
The calculation of gradients, (gx , gy )in X and Y directions respectively, for an image (I) involves smoothing of the image along one axis followed by convolving it with derivative of other axis. This process can be mathematically denoted as:
gx (x, y) = I ∗ Gy (x, y) ∗ G′x (x, y)
gy (x, y) = I ∗ Gx (x, y) ∗ G′y (x, y)
and
The gradient magnitude can be determined in terms of Euclidean distance measure. To reduce computational complexity, Manhattan distance measure is used instead, and thus gradient magnitude gets simplified into
|g(x, y)| = |gx (x, y)| + |gy (x, y)| Although the edges in gradient magnitudes image are usually well indicated, the spatial position for a thick or blurry edge cannot be determined correctly. A thick edge is made sharp through the elimination of unnecessary edge-pixels wherein the value of an edge-pixel is decided on the basis of its gradient direction. The method is called non-maximal suppression of edges. The gradient direction, θ(x, y), is the direction of the maximum slope formed by the vector addition of the image gradients in x and y directions given by
−1
θ(x, y) = tan
�
gy (x, y) gx (x, y)
�
The non-maximal suppression algorithm finds the local maxima in the direction of the gradient, and suppresses any pixel that is not at the maximum (non-maximal). This is done by labeling all possible edges in the image and disregarding all of the non-edges. To implement this, the pixels of the gradient magnitude image are grouped based on the four quadrants that their corresponding angles of the gradient direction fall in (Fig 3.3).
9
Figure 3.3: Angles and quadrants Hysteresis is used to track along the remaining pixels that have not been suppressed. Hysteresis uses two threshold values and the result contains all the one-pixels coming from the high threshold and those one-pixels from the low threshold that are connected to a high threshold pixel through eight-connected neighborhoods. This threshold technique improves edge localization. The high and low threshold values can be found from the statistics of the image. For the high threshold, a histogram of image magnitude gradient is created. From the histogram, a certain percent of the highest magnitude pixels are chosen to be definite edges. The percentage that yields the most reasonable results is used. Most edge detectors work on the grayscale representation of the image. This reduces the amount of data to work with, from three channels to one, but at the cost of losing some information about the scene. By including the color component of the image, the edge detector should be able to detect edges in regions with high color variation but low intensity variation. To Canny edge detector can be extended to perform color edge detection, and differs little from the traditional grayscale version. The algorithm reads in a color image and divides it into its three separate color channels. Then, each color channel is run through the Canny edge
10
Figure 3.4: Comparing results of grayscale and color Canny edge detection. L EFT: Input image “Lena” of size 1024×1024 pixels. C ENTER: Output of Grayscale Canny edge detector with σ=0.8, Gaussian kernel size = 5×5. R IGHT: Output of Color Canny edge detector with σ=0.8, Gaussian kernel size = 5×5. detector separately to find a resulting colored edge map. Finally, the resulting edge maps from each of the three color channels are combined into one complete edge map. Color edge detection seems like it should be able to outperform grayscale edge detectors since it has more information about the image. From Fig. 3.4, we can see that in the case of the Canny color edge detector, it finds slightly more number of edges than the grayscale version. Finding an optimal way to combine the three color challenges may improve this method. But, from a practical viewpoint, this difference may be significant to real world applications that depend more on efficiency than marginal improvement of results.
3.3
KLT Feature Tracking
Feature selection and tracking are the two major problems in many object tracking strategies. The feature tracker presented in [41] by Shi and Tomasi. It is an extension of Tomasi and Kanade’s work in [45], which itself uses techniques developed in [28] by Lucas and Kanade. [41] introduced the concept of using an affine motion model to evaluate feature quality across frames, thus allowing identification of features that do not correspond to features in the real world, such as depth illusions and edges of highlights. 11
The Kanade-Lucas-Tomasi (KLT) feature tracking, which is a high-level image processing operation, essentially comprises of two important steps: first step determines what feature(s) to track through feature selection, and the second step involves tracking of the selected feature(s) across a sequence of images. The KLT tracker rests on three assumptions: temporal persistence, spatial coherence and brightness constancy between the same pixels from one frame to the next. Temporal persistence implies that the image motion of a surface patch changes slowly in time. This means the temporal increments are fast enough relative to the scale of motion in the image such that the object does not move much from frame to frame. Spatial coherence assumes that neighboring points in a scene belong to the same surface, have similar motion, and project to nearby points on the image plane. The Brightness Constancy Equation assumes that an object’s brightness remains relatively constant along its motion trajectory, as long as both the object (or feature point) and its surroundings are in light of the same intensity. It enables the brightness of a feature point to propagate to its neighborhood and thus to model complex brightness changes. For image frame I(x, y, t), let (∆x, ∆y, ∆t) be a small step away from any point (x, y, t), between time t and t + ∆t. If the displacement of image point (x, y) over t + ∆t, denoted by (∆x, ∆y) is small, then according to the brightness constancy constraint,
I(x, y, t + ∆t) = I(x + ∆x, y + ∆y, t)
Let x = (x, y)T and d = (∆x, ∆y)T . In the presence of image noise r,
I(x, t + ∆t) = I(x + d, t) + r
12
KLT will compute the displacement vector d that minimizes the following error, over a small image patch W. r=
X W
(I(x + d, t) − I(x, t + ∆t))2
By its Taylor expansion, approximating I(x + d; t), one obtains a linear system for estimating the unknown d, where the image gradient vector at position x is denoted by G = )) δ(I(∗,t)+I(∗,t+∆T )) , ]. This can be written as [ δ(I(∗,t)+I(∗,t+∆T δx δy
X X ( GT G)(d) = GT ∆I(x, ∆t) W
W
P P Denoting ( W GT G) by matrix A, and W GT ∆I(x, ∆t) by vector b, we get A(d) = b
In [41], Tomasi presented a variation of the KLT equation which uses both images symmetrically. This equation, derived in [2] is identical to the above equation, is used in our implementations. Detection of features to track is a similar process. The key to detection is understanding that not all the pixels in the image are ’good’ for tracking, but, the pixels that are ”corners” are the ones that are good for tracking. A better method to detect if a pixel is a corner is computing the eigenvalues of the A matrix for the window of pixels surrounding the desired center or reference pixel. If both eigenvalues are non-zero, then the reference pixel is a corner. Thus, feature to track are selected by finding image points where corner-ness measure, c, is a local maximum. It is evaluated over the complete image [45] [28], following which a
13
non-maximal suppression is performed. The corner-ness measure can be written as X c = min(eig( GT G)) W
= min(eig(A))
The linearity assumption is only valid for a small displacement d, since a change in lighting occurs during motion such as shadows and occlusions. A multiresolution KLT tracker is often used in practice for handling larger image motion. It first tracks at coarse resolutions and then refines the result in finer resolutions. Multiple iterations are performed at each resolution for improved accuracy. New features are re-selected from time to time, in lieu of features tracks eventually lost due to camera motion and occlusion, to maintain an approximately fixed number of features in the tracker.
14
Chapter 4 Overview of Architectures Image processing algorithms have a close relationship with the type of architecture adopted for their execution, with an effective architecture reflecting the type of algorithm to be implemented. Recently, a number of novel and massively-parallel computer architectures have been introduced that promise significant acceleration of applications by using a large number of compute cores. In the world of desktop computers dominated by x86-based processors, the super pipelined processor design approach that pushes the limits of performance by increasing the pipeline length has hit the power wall paving the way for multi-core and/or multithreaded architectures to invade this market segment. In the world of mobile computers, novel low power design techniques have been adopted in the processor, chipset, and system to maximize the battery life while keeping the performance at acceptable levels. Also, virtualization and security support are now visible in many product offerings. GP GPUs take advantage of the GPU architectures stream model of computation. The IBM cell processor is another leading commercial processor based on the stream model of computation. The Stanford IMAGINE processor is based on a stream processor architecture developed by a team of researchers led by Professor William Dally. Multimedia and graphics applications and database queries are examples of applications which fit the stream model
of computation. In general, applications with large data sets and applications amenable to vector processing will perform well under this model of computation. The stream model of computation is based on the concepts of streams and kernels, where a stream is a set of sequential data that require related operations to be performed on them and the kernels relate to the instructions or operations to be performed on the data. Stream processors perform extremely well on media, graphics, applications with large data sets requiring the execution of similar operation on their data elements such as vector processing applications. With its unique capabilities for accelerating applications requiring video, 3-D graphics, for areas such as imaging and visualization, Cell Broadband Engine (CBE) technology is a promising step forward in the pursuit of real-time processing of highly sophisticated algorithms. Based on a high-bandwidth memory architecture and multicore technology, the CBE is a processor optimized for compute-intensive and broadband rich media applications.
4.1
Intel NetBurst Microarchitecture: Pentium 4 with HyperThreading
Intels Pentium 4 processor uses a redesigned microarchitecture named P68 or“NetBurst” by Intel. The NetBurst reflects the end of the P6 micro-architecture era that started with the Pentium Pro in 1995 and was used in all later Pentium versions through the Pentium III. Intels goals for NetBurst were to be able to execute legacy IA-32 and SIMD (executing a single instruction across multiple data) applications and operate at high clock rates that will scale easily in the near future. Hyper-Threading technology, which brings the concept of simultaneous multithreading to the Intel architecture, was first introduced on the Intel Xeon processor in early 2002 for the server market. In November 2002, Intel launched the technology on the Intel Pentium 4 at
16
Figure 4.1: Intel NetBurst 20-stage pipeline clock frequencies of 3.06 GHz and higher, making the technology widely available to the consumer market. The ”Hyper-Pipelined” technology refers to the 20-stage pipeline of the NetBurst microarchitecture as seen in Fig. 4.1. This is twice as long as the pipeline on the P6 microarchitecture and is the primary reason Intel is able to get such fast clock rates, because, if less work is being done on each clock tick, then clock ticks can occur faster. Intel claimed that the 20-stage pipeline would allow them to reach 10 GHz clock frequencies in the future without another micro-architecture change. The Hyper-Threading technology implementation on the NetBurst microarchitecture has two logical processors on each physical processor. Each logical processor maintains a complete set of the architectural state [26]. The architectural state consists of registers, including general-purpose registers, and those for control, the advanced programmable interrupt controller (APIC), and some for machine state. From a software perspective, duplication of the architectural state makes each physical processor appear to be two processors. Each logical processor has its own interrupt controller, or APIC, which handles just the interrupts sent to its specific logical processor. NetBurst instruction execution is broken into three main parts; an in-order issue front end, an out-of-order (OOO) superscalar execution core, and an in-order retirement. The job of the front end is to feed a continuous stream of micro-ops to the execution core. The fetch/decode unit can decode one IA-32 instruction per clock (complex instructions are looked up in a microcode ROM) and passes micro-ops to the Execution Trace Cache. The trace cache passes micro-ops to the execution core and can issue 3 micro-ops per cycle.
17
The fetch/decode unit can decode one IA-32 instruction per clock, with complex instructions being looked up in a microcode ROM, and passes micro operations per second (microOPS) to the Execution Trace Cache. The execution core has seven execution units accessible through one of four issue ports. One or more ports may be issued on each clock cycle (see figure 3) and ports may then dispatch one or two IOPS per clock. Two integer ALUs on the P4 actually run at twice the core processor frequency (this is what Intel calls the Rapid Execution Engine) and can execute in half a clock cycle. Two instructions are issued by sending one in the first half of the cycle and the second in the second half (if, of course, the port has access to these double speed ALUs. The branch predictor in the Pentium 4 is more advanced than its predecessors, the Pentium III and P6 microarchitecture. The branch delay could be as little as zero clock cycles on a correctly predicted branch, and a wrongly predicted branch costs on average 20 cycles. Prefetching in the NetBurst micro-architecture happens automatically by the hardware by bringing data or instruction cache lines into L2 based on prior reference. Basing prefetching decisions on prior reference is a new feature. The hardware can also do normal linear prefetching of instructions. Also, SSE2 adds instructions that can allow a programmer to request a data prefetch using software for code with irregular access patterns. The NetBurst architecture is particularly skillful at spotting sequences of instructions that can be executed out of original program order, that is, ahead of time. These sequences are have no dependency on other instructions and do not cause side effects that affect the execution of other instructions. When the processor spots these sequences, it executes the instructions and stores the results. After verifying that assumptions made during their speculative execution are correct, the processor then retires these instructions. Otherwise, all the pre-executed code is thrown out, the pipeline is cleared and restarted at the point of incorrect speculation. With the introduction of Streaming SIMD Extensions 2 (SSE2), the NetBurst microarchitecture extends the SIMD capabilities that MMX and SSE technologies delivered by adding 18
144 new instructions that deliver 128-bit SIMD integer arithmetic operation and 128-bit SIMD Double-Precision Floating Point. These new instructions deliver the capability to reduce the overall number of instructions required to execute a particular program task and as a result can contribute to an overall performance increase. They accelerate a broad range of applications, including video, speech, and image, photo processing, encryption, financial, engineering and scientific applications. For our work, we have used Pentium 4HT 600 series, a NetBurst with newer Prescott core which has an increased cache size over the older Northwood core (upto 2MB), and HyperThreading technology, a much larger instruction pipeline (31 stages compared to Northwood’s 20), an improved branch predictor and support for SSE3 SIMD instructions. The clockspeed was 3 GHz with 2MB L2 cache. Our code was compiled and executed on a system having 1GB of physical memory, with Intel C++ Complier 11.1 on Linux (Ubuntu 8.04).
4.2
Intel Core Microarchitecture: Core 2 Duo Mobile
Figure 4.2: The Intel Core microarchitecture 14-stage pipeline functionality
19
Intel Core Microarchitecture is a multi-core processor microarchitecture that supercedes the Intel NetBurst microarchitecture discussed in [19]. The NetBurst architecture was abandoned due to excessive power consumption and the resulting ineffectiveness to increase clock speed. The Intel Core microarchitecture reduced power consumption by lowering clock rate, and improved performance by better utilizing a processor’s usage of available clock cycles and power, thus causing the performance/watt factore to improve. Some features introduced by Core microarchitecture include: • Supplemental Streaming SIMD Extension 3 (SSSE3), which is Streaming SIMD Extension (SSE) instruction set’s fourth iteration is also known as Tejas New Instructiosn (TNI), or Merom New Instructions (MNI). SSSE3 contains 16 new discrete instructions over SSE3. Each can act on 64-bit MMX or 128-bit XMM registers. It allows horizontal operations within a register, as opposed to the almost strictly vertical operation of all previous SSE instructions. • Streaming SIMD Extension 4 (SSE4) contains 54 instructions that, unlike earlier SSE iterations, execute operations which are not specific to multimedia applications [46]. The instructions are divided into two categories: Vectorizing Compiler and Media Accelerators, and Efficient Accelerated String and Text Processing, for multimedia and database applications respectively. • Intel Wide Dynamic Execution delivers more instructions per clock cycle, improving execution and energy efficiency. Every execution core is wider, allowing each core to complete up to four full instructions simultaneously using an efficient 14-stage pipeline. • Intel Advanced Smart Cache includes a shared L2 cache to reduce power by minimizing memory traffic and increase performance by allowing one core to utilize the entire cache when the other core is idle. • Intel Smart Memory Access improves system performance by hiding memory latency and thus optimizing the use of data bandwidth out to the memory subsystem.
20
• Intel Advanced Digital Media Boost made all 128-bit SSE, SSE2 and SSE3 instructions execute within only one cycle, thus doubling the execution speed for these instructions which are widely used in multimedia and graphics applications. The Core 2 range from this microarchitecture lineup include single, dual and quad-core CPUs. The Core 2 adds some additional features to the Core microarchitecture. For our evaluation, we have used Intel Core 2 Duo T7250 (Merom-2M) low voltage mobile processor running at 2GHz with 2MB L2 cache. Our code was compiled and executed on a system having 2GB of physical memory, with Intel C++ Complier 11.1 on Linux (Ubuntu 8.04).
4.3
Cell Broadband Engine Architecture: PlayStation 3
The Cell Broadband Engine Architecture (CBEA) was developed jointly by Sony, Toshiba, and IBM. It is a heterogeneous multi-core microprocessor with an objective is to provide high performance computation for graphics, imaging and visualization, and to a wide scope of data-parallel applications. The Cell Broadband Engine (CBE) has one 64-bit host processor called PowerPC Processing Element(PPE), eight specialized co-processors called Synergistic Processing Elements(SPE), and one internal high speed bus called Element Interconnect Bus (EIB) which links the PPE and SPEs together. The host PPE houses the PowerPC Processor Unit (PPU), equipped with the 64-bit PowerPC AS instruction set architecture, and the VMX (AltiVec) vector instruction set architecture (AltiVec) to parallelize arithmetic operations. Each SPE consists of a Synergistic Processing Unit (SPU), and a Synergistic Memory Flow Controller (SMF) unit providing DMA, memory management, and bus operations. A SPE is a RISC processor with a 128-bit SIMD organization for single and double precision instructions. Each SPE contains a 256KB local memory area for instruction and data , called the local store (LS), which is visible to the PPE and can be addressed directly by software. The LS is not analogous in 21
Figure 4.3: Block diagram of a generic Cell B.E. architecture. L EFT: Structural diagram of the Cell Broadband Engine. T OP RIGHT: The PPE allows application execution, performs I/O and has the PPU in it. B OTTOM R IGHT: Each SPE incorporates its own SPU to perform its allocated computational task, while each SPU has a dedicated memory called the LS. operation to a superscalar CPU cache since it is neither transparent to software nor does it contain hardware structures that predict what data to load. The EIB is a circular bus made of two channels in opposite directions and allows for communication between the PPE and SPEs. The EIB also connects to the L2 cache, the memory controller, and external communication. The CBE can handle 10 simultaneous threads and over 128 outstanding memory requests. The clock speed for PPE is 3.2 GHz. The PPEs creates threads and these threads are carried to SPEs for performing the mathematical operations. The SPEs then send back the results of operation back to PPE. An SPE is a RISC processor. Each SPE has got a local storage of 256 KB. An SPE can operate on 16 8-bit integers, 8 16-bit integers, 4 32-bit integers, or 4 single precision floating-point numbers in a single clock cycle. It can also do a memory operation in the same clock cycle. The SPE processor cannot directly access system memory; the 64-bit memory addresses formed by the SPE must be passed from the SPE processor to the SPE memory flow controller (MFC) to set up a DMA operation within the system address space. 22
The number of SPEs that can be used in a specific application differs, for example in case of PS3 it can use 6 out of the 8 SPEs. Scaling is just one capability of the Cell architecture but the individual systems are going to be potent enough on their own. An individual Cell have a theoretical computing capability of 256 GFLOPS (Billion Floating Point Operations per Second) at 4GHz. CBE’s hardware has been specifically designed to provide sufficient data to the computational elements to enable such performance. This is a rather different approach from the usual way which is to hide the slower parts of the system. The main program executes on PowerPC and the calculation part is transferred to SPEs. SPEs perform the vector multiplication directly on 128 bits, making program execution faster. Our code was compiled and executed on a PS3 system having 512MB of physical memory, using Cell SDK 3.1 on Linux (Fedora 9).
4.4
Graphics Processor Unit: Nvidia GeForce 8 Series
Although there are many different graphics cards available, with each possessing slightly varying capabilities, graphics cards are basically data-flow machines (see Fig. 4.4). Data is instantiated in the main application that runs on the CPU. Then this data is passed to the GPU either through binding variables or through passing data to graphics registers in groups of values stored in textures. Once the data is on the graphics card, it follows through the rendering loop being modified at each step. In a common rendering pipeline, data starts out as models in a virtual scene. These models can be either 3-D or 2-D objects. In either case, models are composed of vertices and facets, and can be reconstructed by the data structure that describes its connectivity. The first modification happens in the vertex processor, where routines called vertex programs operate on each vertex of the model. In traditional graphics applications, this is where the shading and lighting computations are performed, as well as information regarding ver23
Figure 4.4: GPU Data Flow tex perturbation due to skinning or bump mapping. For image processing applications, the step though the vertex program is used to determine texture coordinates and modifications to the color of the objects surface due to shading. Next, the scene is assembled and rasterized. Rasterization is a process of scan converting a mathematical description of an objects surface (continuous or piecewise-continuous) into a discrete color values stored in a pixel frame buffer. Once broken into pixels, data is sent to the fragment processor, where routines called fragment programs further modify the pixel color data. The final stage in the GPU rendering pipeline is filling the frame buffer with the final color values for each pixel. Given its data flow architecture, programming the GPU amounts to transforming an algorithm to fit within the framework of the vertex and fragment programs. These programs act as microcode that is loaded directly onto the GPU and hence no instruction fetching from main memory is needed. Depending on the graphics, and the graphics interface, the capabilities of the fragment and vertex processors vary. Since early 2007, GPU manufacturers have begun to market them as compute coprocessors, and this is the way we consider them. The manufacturers have opened up the functionality of these coprocessors using common programming languages, and users no longer need to have knowledge of graphics concepts. This is especially useful when programming items that are not directly related to items that are in the graphics pipeline.
24
Figure 4.5: The CUDA Programming model. L EFT: Grid of thread blocks. R IGHT: CUDA Memory Hierarchy. For general purpose programming for the last couple of years, we are more familiar with the version released by NVIDIA. It consists of a programming model, Compute Unified Device Architecture (CUDA), and a compiler that supports the C language with GPU specific extensions for local, shared and global memory, texture memory, and multithreaded programming. The ability to program in a more native fashion means that more complex algorithms and data structures can be more easily implemented in this framework. The CUDA model is supposed to be extended over the next few generations of processors, making investment of effort on programming it worthwhile, an important consideration for researchers who have spent significant time on short-lived parallel architectures in the past. Under CUDA the GPU is a compute device that is a highly multithreaded coprocessor. A thread block is a batch of threads that executes on a multiprocessor that have access to its local memory. They perform their computations and become idle when they reach a synchronization point, waiting for other threads in the block to reach that point. Each thread is identified by its thread ID (one, two or three indices). The choice of 1,2 or 3-D index layout is used to map the different pieces of data to the thread. The programmer writes data-parallel code, which
25
executes the same instructions on different data, though some customization of each thread is possible based on different behaviors depending on the value of the thread indices.
Figure 4.6: Mapping of graphics pipeline in NVIDIA GeForce 8 Series GPU. The fragment processor and frame-buffer objects’ direct off-screen rendering capability is frequently used in GPGPU applications. The NVIDIA GeForce 8 Series GPU is the 2007-2008 generation of the NVIDIA GPU, and has also been released as the Tesla compute coprocessor [27]. It consists of a set of multiprocessors (16 on our GeForce 8800GTX), each composed of 8 processors. All multiprocessors talk to a global device memory, which in the case of our GPU is 768 MB, but can be as large as 1.5 GB for more recently released GPUs/coprocessors. The 8 processors in each multiprocessor share 16 kB local read/write shared memory, a local set of 8192 registers, and a constant memory of 64 kB over all multiprocessors, of which 8 kB can be cached locally at one multiprocessor. In order to achieve high memory throughput, the GPU attempts to coalesce accesses from multiple threads into a single memory transaction. If all threads within a warp (32 threads) simultaneously read consecutive words then single large read of the 32 values can be performed at optimum speed. If 32 random addresses are read, then only a fraction of the total DRAM bandwidth can be achieved, and performance will be much lower. Base read/write addresses of the warps of 32 threads also must meet half-warp alignment requirement in order to be 26
coalesced. If four-byte values are read, then the base address for the warp must be 64-byte aligned, and threads within the warp must read sequential 4-byte addresses. For our experiments, the code was compiled and executed using GCC on a system having NVIDIA GeForce 8800GTX, 1GB of physical memory, and ran CUDA 2.1 on Linux(Gentoo).
27
Chapter 5 Implementation 5.1
Gaussian Smoothing
This section describes the four architectures and their corresponding implementations of Gaussian smoothing. A Gaussian kernel is a separable filter. Usually, a non-separable filter of window size M × M computes M 2 operations per pixel, whereas for a separable filter its is M + M = 2M operations. This is a two step process where the intermediate results from the first separable convolution is stored and then convolved with the second separable filter to produce the output. The smoothing kernel G(x, y) is kept constant at a size of 5x5 with (σ) = 1. Since the same smoothing kernel is convolved with the imput image, the algorithm lends itself well to the Single Instruction Multiple Data (SIMD) technique to achieve data level parallelism.
5.1.1 Intel NetBurst Microarchitecture The NetBurst micro-architecture extends the SIMD capabilities of MMX and SSE technologies to deliver 128-bit SIMD integer arithmetic operation and 128-bit SIMD Double-Precision Floating Point, thus reducing the overall number of instructions required to execute a particu-
Figure 5.1: Parallel transposition of the image lar program task and resulting in an overall performance increase. We made use of this feature to improve on execution time. Since the smoothing kernel is separable, attempts to parallelize a 2-D separated convolution by conventional block partitioning may not be optimal, especially for larger kernel sizes because it requires the duplication of a large amount of boundary pixel data. Hence, instead of fixed partitioning the image blocks are redistributed among the tasks between the convolutions of two 1-D Gaussian filters [48]. First, the 8-bit grayscale input image I is divided into N regular blocks, N = 1, 2, by a column-wise partitioning and the blocks are distributed to a group of threads. Each thread convolves its own block data with 1-D filter, Gy , in y direction. Upon completing convolution with every pixel, I(x, y), from its block, each thread writes its result into a another placeholder image J at J(y, x). This redistribution, similar to a parallel transposition of the entire image, divides the image into blocks with row-wise partitioning. Now, J is partitioned column-wise into N number of regular blocks, just as I was, with one thread assigned per block. Next, each thread convolves its corresponding column-wise block data from J with 1-D filter, Gx , in x direction (Fig. 5.1). Lastly, the data blocks of the threads are merged together to give the final result.
29
There are 144 instructions in the NetBurst’s Streaming SIMD Extensions 2 (SSE2) for extending SIMD computations to operate on operands that contain two packed double-precision floating-point data elements, 16 packed bytes, 8 packed words, 4 doublewords, and 128-bit packed integers. The operands can be either in memory or in a set of eight 128-bit registers called the XMM registers. Each XMM register can accommodate up to eight 16-bit integers. Using SSE2, the convolution operation between the smoothing kernel and a data pixel is performed in parallel. First, the smoothing kernel, of length 5, needs to be loaded from memory into an XMM register. As each of the five values of the kernel is float, under singleprecision a float is of size 32 bits. However, XMM registers can accommodate at most four single-precision floats, leaving no room for the fifth kernel element. Therefore, each 32-bit single-precision floating-point kernel element is converted into 16-bit half-precision floatingpoint element. These half-precision elements are then packed, zero-padded to 128 bits and stored in global memory. Since the kernel value remains unchanged throughout the smoothing operation, storing it in the global memory eliminates repeated half-precision conversion and packing operations. Access to this memory location is allowed through thread synchronization as only one thread is able to read at any instant of time into shared memory region. The kernel value is then loaded from memory into one of the XMM registers acting as source. The 8-bit value of the data pixel I(x, y) and its four consecutive column-wise neighbors (till I(x, y + 4)) are loaded into another XMM register that is the destination. To avoid exceeding image boundary, the neighbors are substituted with 0. The two XMM registers are then multiplied in parallel. The result of a 16-bit by 8-bit multiplication is 24-bit float which is first converted to converted to 16-bit integer using SSE3’s F IST T P instruction [21]. Each of its five components of the multiplication result are summed up, the 16-bit result is converted to 8-bit integer by using Convert.T oByte() function of Visual C++ compiler, and stored in memory location for J(y, x). The process is repeated till every pixel within a block for a given thread is convolved. 30
5.1.2 Intel Core Microarchitecture Most of the algorithm’s implementation remains similar to the method described in 5.1.1, in addition to some SSE4.1 instructions to help optimize Gaussian smoothing on the Core microarchitecture [40]. The 8-bit grayscale input image I is divided into N regular blocks, but for a larger range N = 1, 2, 4. The most notable of these is instruction ROU N DP S rounds the scalar and packed single precision operands to integer, and replaces F IST T P of SSE3. On an average, ROU N DP S takes a minimum of 1 clock cycle, although cache misses and exceptions may increase the clock counts considerably, compared to F IST T P ’s 2 clock cycles [21][20]. The use of SSE2/SSE3/SSE4 limits the number of threads, and therefore blocks, to four as each thread needs two XMM registers for SIMD multiplication and there are at most eight XMM registers available.
5.1.3 Cell B.E. Architecture The input image is a JPEG file, first its header is read and copied to the output file. An array is initialized to hold the corresponding value for each pixel of the image. The PowerPC supports the Big endian format and JPEG supports both big and little endian byte orders, therefore no conversion is neccessary. In order to have maximum parallel processing, computationally demanding processes are split amongst the six SPEs. Initialization of the SPE is done at the PPE by the creation of threads. Operations that require higher computational resources and that are independent with respect to other parts of the image except its immediate neighborhood are processed in the SPE. The amount of data storage on the SPE local store is limited to 256 KB, so the image to be processed in our case, is divided into N parts, varying N over 1, 2, 4, 6 and send to each of the B SPEs for processing. The data transfer from PPE to SPE is done by direct memory access. Each DMA transfer instruction can transfer up to 16 KB. Multiple
31
DMA transfers can be initialized and grouping is also possible by the use of tags. In this implementation, the image to each SPE is transferred by six DMA transfers. The processing of image is done by use of SIMD (single instruction multiple data) instructions to increase efficiency. The computed data is transferred back to the PPE by DMA transfers again.
5.1.4 Graphics Processor Unit We have used a separable filter algorithm, similar to the one supplied with the CUDA toolkit to implement the Gaussian smoothing [38]. The GPU used is the NVIDIA GeForce 8 Series, which has 128 SIMD stream processors working together in groups of 8 to form 16 multiprocessors. A simple way to implement Gaussian smoothing in CUDA is to load a block of the image I into a shared memory array, perform a point-wise multiplication of a filter-size portion of the block, and then write this sum into the output image in device memory. Each thread block processes one block in the image, and each thread generates a single output pixel. Our implementation has two components: host processing and a GPU. The host component performs fast retrieval and decompression of image into accessible arrays for kernel processing. We used CImg, a third party image processing library, for data retrieval. The data array’s format is in 8-bit row major order. The data then gets loaded into GPU global memory. The GPU component performs the necessary steps of Gaussian smoothing. Although most of the implementation is optimized for CUDA architecture, not all aspects are as efficient as we would prefer. The source image data is accessed through threads that load a corresponding pixel into the blocks shared memory space. For a thread block of N × N , the non-separated M × M filter needs each thread block to load an additional border pixels of border width ⌊ M2 ⌋, or 4 ∗ N ⌊ M2 ⌋ + 4 ∗ 2⌊ M2 ⌋ border pixels. For a separated M × M filter, each filter would only need 32
Figure 5.2: Border and image pixels during Gaussian smoothing. a) First pass: When Gx is convolved with I. b) Second pass: When Gy is convolved with J. pixels along a single dimension, making the total number of pixels loaded to be 4 ∗ N ⌊ M2 ⌋. Border pixels are necessary as convolutions near the edge of a thread block will have to access pixels normally loaded by adjacent thread blocks. Since shared memory is local to individual thread blocks, before processing, each block loads its own set of border pixels. We use two functions to convolve the source image I with separable Gaussian filters of size 5, and compute the gradients Gx and Gy for each pixel I(x, y). The first convolution is between the horizontal kernel Gx and the source image, I, across the columns, to store the obtained result in placeholder image J. In this function, not all border pixels are memory coalesced from global memory, this is because they do not belong to the same half-warp base address as the non-border pixels. The second convolution convolves the vertical kernel Gy with J down the columns. In this routine, the border pixels are memory coalesced since their are contiguous addresses are correctly aligned around the non-border pixels (see Fig. 5.2).
33
5.2
Canny Edge Detection
Our implementation is is designed to process 8-bit or higher depth grayscale images, while satisfying Cannys criteria for optimal edge finding. The performance of the Canny algorithm depends heavily on the adjustable parameters σ, and the threshold values in edge-linking. The input grayscale image, I, is in a linear, 8-bit per pixel format.
5.2.1 Intel NetBurst Microarchitecture To find the gradient magnitude, the 8-bit grayscale input image, I, is convolved with separable Gaussian kernel of size five and its derivatives, to find the image’s gradients in x and y directions. Thread, t1 and t2 are created to calculate gradients in x direction, gx (x, y), and y direction, gy (x, y), respectively. Both t1 and t2 are executed concurrently. To find the image the gradient in x direction, the entire image I is first convolved with 1-D filter, Gy , in y direction. The result of this convolution, J, is then convolved with the derivative of Gaussian in x direction, G′x (x, y). The result, gx , is stored as a positive packed 24-bit float, in global memory to which thread t1 has exclusive read/write access. The convolution using SSE2 is similar to that described in subsection 5.1.1, but with blocksize N = 1 and no unpacking and type-conversion operations performed at the end of computation. Similarly, the gradient in y-direction is found by first convolving I with a 1-D Gaussian kernel in x direction, Gx (x, y), whose result is then convolved with a 1-D derivative of Gaussian kernel in y direction, G′y (x, y). The obtaned gradient, gy , is stored as a positive packed 24-bit float, in global memory to which thread t2 has exclusive read/write access. When both the threads t1 and t2 finish executing, gx and gy are added row-wise, five pixels at a time. The result of each SIMD addition is unpacked and stored in a f loat image g using CImg functions. The threads are then terminated.
34
During nonmaximal-suppression, we need to determine the direction, θ =
Gy , Gx
of local
maxima which is an edge. This is done by computing the arc tangent of gradient in y- over gradient in x-direction. For non-SSE case, computing inverse trigonometric functions is very slow. The C function atan() usually takes between 250 and 350 instruction cycles [34]. Evaluating inverse trigonometric function is performed once per image dimension, slowing down the entire process. Thus, this is the most prominent function to optimize. Even the instruction F P AT AN has high latency and stalls the FPU for many (150-300) clock cycles. Notice that the angles need not be computed exactly since they are used only for interpolation [30]. Therefore, it is feasible to use an approximation for inverse trigonometric functions [25]. Approximations to the arctangent function can be obtained using second and thirdorder polynomials and simple rational functions. Lagrange interpolation-based and minimax criterion-based approaches are used to obtain the polynomial coefficients. As elaborated in [39], a second-order approximation for arctan(θ), with a maximum absolute error of 0.0038 radians, is thus written as
arctan(θ) ≈
π θ + 0.273θ(1 − |θ|), 4
−1 ≤ θ ≤ +1
The approximation operation can be computed in three (two multiplies, one add) cycle in most processors. Still, the difficulty in speeding-up and parallelizing 2-D non maximal suppression is due to its non-separability. In [32], Neubec et al. discuss a few optimizations for 2-D non maximal suppression, but we have not attempted it yet. In the hysteresis step, the image is divided into two blocks. Two thread are created, one for each block. Each thread performs edge-linking through hysteresis on its corresponding block. The higher threshold value is calculated as 10%, and lower threshold value as 75% of maximum pixel intesity of the image. The two threshold values, upper and lower, are precomputed and stored in registers before starting hysteresis. We use SSE’s CM P P S instruction
35
to compare four packed single-precision floating-point values of the image pixels, first with higher threshold value, and later with the lower threshold value. For Thread# 1, we load four consecutive pixel values into XMM2 and first perform SIMD comparison with values in XMM0 that has high threshold values, until all pixels are compared. This comparison yields a high-thresholded image which is stored in an image, J, for later use in edge linking. We then compare all image pixels, packed and loaded in XMM2, with values in XMM1 that has lower threshold value, to yield a low thresholded image K. However, both images J and K are not complete, until Thread# 2 concurrently thresholds pixel values from its image block. For Thread# 2, we load four consecutive pixel values into XMM5 and first perform SIMD comparison with values in XMM3 that has high threshold values, until all pixels are compared and yields a high-thresholded image stored in J. We then compare all image pixels, packed and loaded in XMM5, with values in XMM4 that has lower threshold value, to yield a partially complete low thresholded image K. When both Thread# 1 and Thread# 2 finish executing, they are joined and terminated. The resulting images J and K are now doubly thresholded through edge linking to produce the final result.
5.2.2 Intel Core Microarchitecture Most of the algorithm’s implementation remains similar to the method described in 5.1.1, in addition to SSE4.1 instructions to help optimize floating point operations on the Core microarchitecture [40].
5.2.3 Cell B.E. Architecture The process of finding gradient is described in Section 3.2. The convolution of the given image with a Gaussian filter and its derivative, to smoothen the image, is identical to the method as described in 5.1.3. The parallel implementation is based on the pthread library which creates
36
separate threads and allocates those threads to the context of every SPE, thus every thread is associated with a SPE and can completely run simultaneously. The magnitude of gradient value for each pixel is computed and stored in another different array also the direction associated with this gradient value is stored in a array. The gradient and its direction are passed onto the function for performing non maximal suppression. After the non maximal suppression the values are sent to thresholding function. In thresholding function all the values are first arranged in ascending order and the 10 percent of the initial values is taken as higher threshold and 75 percent is taken as lower threshold value. Then depending in which range the value of pixels lie the decision is made whether a pixel is a edge pixel or not. If a pixel value is between high threshold and low threshold, its eight neighbors are checked if any one of them is having value greater than high threshold than this pixel is also treated as edge pixel. The final edges are written back to the output file.
5.2.4 Graphics Processor Unit A GPU’s hardware capabilities allow for fast performance of pixel-level operations required for implementing Canny algorithm. Many steps, including finding image gradient and nonmaximum suppression, can be performed in parallel on a pixel-level. The primary goal is to get an optimized parallel algorithm that utilizes the NVIDIA N80 (GTX8800) SIMD architecture model and processing power of the GPU. The approach used is similar to that of [29], but has 8-bit grayscale than 24-bit color images as input, without noticeable loss in edge details. The image width and height are a multiple of 16 pixels to fit global memory access alignment properties of the GPU. All of the kernel threads belong to groups of 256, that is 16 × 16, threads per block. Generally, every thread correlates to a single pixel for processing since the Canny algorithm works on pixel-level.
37
We first find the gradient of the image using the same procedure as described in section 5.1.4. Once the gradient magnitude and gradient direction have been found, another function checks each pixel for the edge criteria and suppresses all non-edge pixels. Edge pixels have gradient magnitudes greater than both of its adjacent pixels in the gradient direction. The non-edge pixels are suppressed by setting their gradient magnitude to 0. The process of hysteresis and connected components begins by marking all pixels that have gradient magnitudes over the high threshold, which is 10% of highest present intensity value, as a definite edge. These pixels are placed into a queue and become starting points for a generalized breadth first search (BFS) algorithm that adheres to the specific constraints of the CUDA architecture. Each thread block processes a separate set of BFS on a group of pixels from the image. A group of pixels is defined as the set of pixels aligned with its corresponding thread block plus a one pixel border around the blocks perimeter. The main issue of connected components through hysteresis in CUDA is the necessity for inter-thread block communication. Although threads within a thread block can be synchronized, threads in different blocks are not. This is problematic for a connected components algorithm when adjacent pixels belonging to adjacent thread blocks should be connected but cannot because of the locality of threads. As a result, a multi-pass approach is taken, where we call the function four times per iteration.
5.3
KLT Tracker
In KLT, the algorithm works at sub-pixel precision, where image areas are examined using several matrix operations and error estimations with integrals. Feature windows in frames are never be identical because of image noise and intensity changes. Thus, translation estimation cannot be absolutely accurate, and as the errors accumulate, the feature windows drift from their actual positions. This algorithm excessively uses floating point operations causing high 38
resource costs. Also, only small displacements can be estimated (see 3.3), thus requiring slow moving objects in the observed scene or high frame rates of the incoming video stream, which also results in high resource consumption. Tracking in the Kanade-Lucas-Tomasi algorithm is accomplished by finding the parameters that minimize a dissimilarity measurement between feature windows that are related by a pure translation motion model. This is a source of potential parallelism, because each calculation of these parameters is independent. In feature selection, the feature quality evaluation process is similarly an independent calculation that only involves matched feature windows, and contains potential parallelism.
5.3.1 Intel NetBurst and Core Microarchitectures Every image frame is read from memory, which is smoothed and its multi-resolution pyramid of image intensity and gradients is constructed. The tracking is done on every frame using the image pyramids corresponding to the current and previous frames. Feature re-selection is performed once in every k frames for an approximately constant feature count in the tracker. The value of k was set to 10, but this generally depends on camera motion and the number of lost features. The multi-resolution pyramid of the image intensity and its gradients are computed by a series of two-pass separable Gaussian convolutions Gx and Gy . These convolutions are implemented in MMX/SSE3 in chunks of 128 pixels and interleaved manually to avoid stalls. After the corner response is computed, non-maximal suppression is used to define the actual feature points. A feature point is declared at each pixel where the response is stronger than at all other pixels in a 3×3 neighborhood. No sub-pixel precision is used. KLT tracking performs a fixed number of tracking iterations at each image resolution starting with the coarsest pyra-
39
mid level. Each tracking iteration constructs a linear system of equations in two unknowns for each interest point and directly solves them to update the estimated displacement (see 3.3). The first thread bilinearly interpolates intensity and gradient magnitudes in 3 × 3 patches around each KLT feature in the two images frames, and stores them in a temporary datastructure. This interpolation is performed as a vector operation, where three consecutive rowpixel data is packed in an XMM register. Various quantities evaluated at 3 × 3 image blocks are added first in computing partial row sums followed by a single column sum. Thread# 2 and Thread# 3 evaluates all the six elements of the matrix A and the vector b and write them into a different placeholder image for use of Thread# 4 in the the next step. Thread# 4 which writes the currently tracked position into the next row in the feature table. The invocation of these four threads corresponds to a single tracking iteration in the original algorithm. At the end of tracking iterations, the final feature positions along with ∆d and the SSD residual between each initial and tracked image patch is loaded. An inaccurate feature track is rejected when its ∆d and residual SSD exceeds the thresholds. During feature re-selection, a corner-ness map with sparse entries is read back and non-maximal suppression is done on it to find new additional features to track.
5.3.2 Cell B.E. Architecture The tracking algorithm was first implemented on the simple single PPE architecture model and then recoded for the parallelized PPE-SPE architecture model. In the parallelized model, the PPE is responsible for SPE thread creation and I/O functions and SPEs perform the video processing computation. The computational part is uniformly distributed on all enabled SPEs. The number of SPEs therefore determines the number of times the SPE module gets replicated and executed.
40
The data is grouped and kept ready for distribution to at most 6 SPEs. Each SPE can directly access only its local store memory of 256 KB. The SPEs process the retrieved data from the main memory through DMA transfer and once finished, write back the data to the same memory location again via DMA transfer. The input is two consecutive image frames in JPEG format. Once the data from both the input images was retrieved, we store it into multi-dimensional arrays. We then apply the tracking algorithm, described in section 3.3, using 3 window. Computationally demanding processes are split amongst the six SPEs. Initialization of the SPE is done at the PPE by the creation of threads. Operations that require higher computational resources and that are independent with respect to other parts of the image except its immediate neighborhood are processed in the SPE. The amount of data storage on the SPE local store is limited to 256 KB, so current image and the previous image of the sequence are loaded into SPE 1 and 2 for processing. The data transfer from PPE to SPE is done by direct memory access. Each DMA transfer instruction can transfer up to 16 KB. Multiple DMA transfers can be initialized and grouping is also possible by the use of tags. The third and fourth SPE bilinearly interpolates intensity and gradient magnitudes in 3 × 3 patches around each KLT feature in the current and previous image frames respectively, and store them in a temporary data-structure. The fourth SPE computes the A matrix while fifth SPE determines vector b. The currently tracked feature position, and feature table is also maintained by SPE# 5. The the final feature positions along with ∆d and the SSD residual between each initial and tracked image patch is loaded by SPE# 6, which performs feature re-selections and determines new, ”good” features to track..The processing of image is done by use of SIMD (single instruction multiple data) instructions to increase efficiency. The computed data is transferred back to the PPE by DMA transfers again.
41
5.3.3 Graphics Processor Unit Like implementation on other architectures, the GPU implementation consists of three main modules, namely image pyramid generation, corner detection and the feature position update. The creation of the respective image pyramid for the grayscale input frames uses essentially a straightforward implementation. As a preprocessing step the current frame is smoothed with a Gaussian kernel before constructing the entire image pyramid. The first horizontal pass convolves the source image with the 5 Gaussian kernel and its derivative, yielding the smoothed image and its horizontal derivative as two 32-bit floats packed in four 16-bit channels. The subsequent vertical pass generates three 16-bit float channels, the smoothed intensity image and its x- and y-derivatives. The remaining levels of the image pyramid are obtained by recursive filtering with a Gaussian kernel. In terms of memory bandwidth it appears to be more efficient not to generate the image derivatives while building the pyramid and to compute the derivatives on demand in the tracking step. Image pyramids using 16-bit floats store the smoothed original image without loss in accuracy (since we employ a small Gaussian kernel). The reduction in precision in coarser pyramid levels is not a major concern, but increases the overall performance by approximately 30 percent. The generation of the image pyramid already provides us with the (smoothed) image gradients required for the structure tensor computation, and suitable box filtering exploiting the separability yields the complete structure tensor. The smaller eigenvalue, i.e. the corner-ness, of a 3 × 3 matrix can be easily computed by a fragment shader, which additionally performs a thresholding operation and discards potential corners very close to the image border. The result of this operation is a floating point texture (encoded in an 8-bit grayscale image using a packed representation), which has positive values at potential corner pixels and zeros otherwise.
42
In order to avoid concentration of extracted features at few highly textured image regions, a non-maximum suppression procedure is subsequently applied. We employ a modified columnwise and row-wise max-convolution procedure, where after each of the two passes, a positive value in the resulting image buffer indicates that the respective position is a local maximum, whereas negative values depict pixels, where the maximum was propagated from the corresponding neighborhood. Thus, each pass of the convolution assigns the value largest in magnitude within the support window to the current position. Keeping already detected and successfully tracked features during a re-detection step is very simple: rendering points for the still valid features using a negative color with large magnitude precedes the non-maximum suppression step, hence those features are retained. It turns out that rendering of such small point sets does not affect the overall performance. At this stage the GPU has efficiently determined a binary mask for the full image indicating additional corner points suitable for further tracking. Generating a compact list representation of the respective feature positions used in the subsequent tracking steps is known to be a nontrivial task for data-parallel devices and usually referred as stream compaction [17]. Essentially, stream compaction using histogram pyramids first computes a full MIPMap pyramid by successive parallel summation of 2×2 pixels similar to sum reduction by recursive doubling. Thus, the total number of relevant pixels, i.e. newly detected feature points, can be reported immediately from the coarsest level of the pyramid (which consists of a single pixel). In a second phase the compact list of positions is generated by a hierarchical search using the previously generated histogram pyramid. Finally, the minimal number of feature positions is transferred to the host (main) memory for further processing. The output of the fragment shader is a vector of floats consisting of the refined positions. Note, that there are several conditions resulting in invalidating features: the updated position may be outside the image region, the image residual is too large or the KLT iterations did not converge. In all these cases the feature track is signaled as invalid by using particular 43
values. In order to avoid weak local minima, the position and gain ratio updates are embedded into a coarse-to-fine scheme using the image pyramids. Unlike in Sinha [42], and Zach [49] GPU-KLT implementation, we use the third, second and zeroth level of the pyramid and skip intermediate ones.
44
Chapter 6 Experimental Results This section presents results of three image processing algorithms discussed in 3 were optimized for execution on four multiprocessor architectures (see 4. Each algorithm type was debugged to produce same results on all the architectures. For Gaussian smoothing and Canny edge detection, we compared an algorithm’s four outputs, from four corresponding architectures, with each other through correlation. For KLT, the four feature tables, one table each from each architecture, were compared frame-by-frame. The optimized algorithms that produced matching results were then selected and compared for execution times and throughput.
6.1
2-D Gaussian Smoothing
To evaluate the performance of Gaussian smoothing, tests were performed on various multicore architectures. These tests showed an improvement of at most one order of magnitude in speed over a the Intel Core 2 Duo implementation. Table 6.1 shows the execution time of Gaussian smoothing algorithm for all four architectures. The left-hand column shows execution time for Lena.jpg and Mandrill.jpg, both standard test images, of dimensions 1024×1024 pixels and 1024×992 pixels respectively. Results from “Lena” and “Mandrill” indicate that
Figure 6.1: The results of 2-D Gaussian smoothing on standard input images. L EFT: Input “Lena” sized 1024×1024 pixels. σ=1.0, kernel size = 5. R IGHT: Input “Mandrill” sized 1024×992 pixels. σ=2.4, kernel size = 5 absolute runtime of the algorithm across all architectures increases proportionally with image dimension. All timings are the best optimized values obtained, for certain parameters, within each architecture’s class. Execution time (in msec) Lena.jpg (1024 × 1024pixels) Mandrill.jpg (1024 × 992pixels) Intel NetBurst 19.193 24.011 Intel Core 44.660 60.346 PS3 3.274 4.565 Nvidia GPU 0.380 0.722 Table 6.1: Gaussian smoothing: Results The performance measurements are shown in Fig. 6.2. The evaluation shows that Nvidia GPU outperforms other the tested multi-core processors, including the PlayStation 3. This is due to the amount of vectorization and concurrent data execution handled by the GPU. The
46
Figure 6.2: A comparison of Gaussian smoothing timings on various multi-core architectures, for “Lena.jpg” and “Mandrill.jpg”. Sony PlayStation 3, although slower than the GPU, shows smaller variation in timings for the two images even when “Mandrill” is many pixels larger than “Lena”.
6.2
Canny Edge Detection
The results for Canny edge detection are seen in Table 6.2. For testing, we compared PS3, GPU and and assembly optimized CPU implementation for the two Intel microarchitectures with each other. Once again, the GPU performed at least 3.3X times faster than the second best performer, which is the PS3. The performance measurements are shown in Fig. 6.4. Execution time (in msec) Lena.jpg (1024 × 1024pixels) Mandrill.jpg (1024 × 992pixels) Intel NetBurst 195.880 159.354 Intel Core 207. 703 181.020 PS3 28.364 32.958 Nvidia GPU 8.089 9.724 Table 6.2: Canny edge detection: Timing results
47
Figure 6.3: Typical inputs to and results of Canny edge detection. L EFT: Input “Lena” sized 1024×1024 pixels. σ=1.0, kernel size=5. R IGHT: Input “Mandrill” sized 1024×992 pixels. σ=1.2, kernel size=5.
Figure 6.4: Comparing execution times of Canny edge detection, for “Lena.jpg” and “Mandrill.jpg”.
48
Nvidia’s CUDA profiler results in Fig 6.5 for Canny edge detection shows in decreasing order, the percentage of GPU occupation of all kernels. One can notice that the non maximal suppression, being the most arithmetic intensive operation, takes a significant percentage of the time. The cannyEdgeHysteresis is the more demanding kernel, since it takes a multi-pass approach to connect edges between thread block.
Figure 6.5: CUDA profiler output of Canny, for “Lena.jpg”
6.2.1 Comparing Canny results Execution time (in msec) Lena.jpg (1024 × 1024pixels) Mandrill.jpg (1024 × 992pixels) Our implementation 28.364 32.958 Gupta et al. [15] 49.400 53.661 Table 6.3: Comparing execution time for Canny edge detection on PS3
Execution time (in msec) Lena.jpg (1024 × 1024 pixels) Mandrill.jpg (1024 × 992 pixels) Our implementation 8.089 9.724 Luo et al. [29] 10.92 12.93 Table 6.4: Comparing execution time for Canny edge detection on Nvidia CUDA On comparing our CUDA-KLT implementation with that of Luo et al. (Table. 6.4), we see the speedup achieved in our work is primarily due to working with grayscale instead of RGB 49
images. This speedup compensated for the additional time taken by edge linking step that uses five passes per iteration, unlike four passes in [29]. This possibly explains why the reduction from three intensity channels to one does not translate into decrease in execution time by a factor 3X. There was no noticeable improvement in quality of edge detection between color Canny and classic Canny. The same can be said for Gupta et al. [15], but in our PS3 implementation we also optimized data transfer and computation through vectorization and even load distribution between the PPEs.
6.3
KLT Tracker
Figure 6.6: Typical results of KLT tracking 600 features for input frame size (720 × 526) pixels. T OP L EFT: Determining good features for Frame 0. T OP R IGHT: Features tracked over Frame 11. B ELOW L EFT: Frame 37. B ELOW R IGHT: Frame 44. Table 6.5 lists the timings of KLT algorithm, for 600 tracked features, for a test sequence having frame image size of 720 × 526 pixels. The reason for selecting 600 features over 1000 was because of the inability of PS3 to maintain more than said number of features over the duration of the sequence. This was due to the lack of enough local memory (256 KB) to maintain 50
a larger feature list. Hence by keeping the number of features constant at 600, we are able to compare and evaluate the results better. As seen so far, the GPU outperforms all processors in terms of speed. One unexpected result, however, is that the Core microarchitecture performs marginally better than NetBurst. This is probably due to SSE4.1’s better SIMD support, which becomes apparent for computationally intensive algorithms like KLT. The PS3 results can be improved through double buffering and loop unrolling. Throughput (in fps) Sequence 1 (720 × 526pixels), 600 features Intel NetBurst 3 Intel Core 4.4 PS3 81 Nvidia GPU 453 Table 6.5: Comparison of throughput in KLT Tracking
Figure 6.7: Comparing throughput for KLT tracking, for 720× 526 image frame and 600 features. CUDA profiler results in Fig 6.8 show a functional breakdown of runtimes of our implementation. This data set determines which portions of the implementation benefited the most from the CUDA design. (Fig ) for CUDA-KLT shows in decreasing order, the percentage of GPU occupation of all kernels. One can notice that the pseudo random numbers generation, being the most arithmetic intensive operation, takes a significant percentage of the time.
51
Figure 6.8: CUDA profiler output of KLT tracking, for 720× 526 image frame and 600 features.
6.3.1 Comparing KLT results
Our implementation Zach et al. [49] Sinha et al. [43]
Execution time (in fps) Sequence1, Sequence2, 720 × 526pixels, 800 × 600pixels, 1000 features 1000 features 272 183 260 25
Table 6.6: Comparing execution time for KLT tracking on Nvidia CUDA: Table 6.6 lists the execution time of our implementation against that of [49] and [43]. There was no previous available data for PS3, to compare our work with. Our results are at least 7X times faster than [43] possibly due to a newer, and faster GPU used and also because of usage of CUDA than GLSL. The marginal improvement of our runtime over Zach et al. is because of the way we used GPU memory through optimized threading, to avoid wastage and alignment issues. As mentioned in 5.3.3, Sinha [42], and Zach [49] GPU-KLT implementations only include the first and zeroth level of image pyramids to avoid weak local minima, where as we use the third, second and zeroth level of the image pyramid. Including more levels gives better results, but at the cost of speed, which is compensated for by our use of grayscale images than RGB images. Hence tracking grayscale images does not cause throughput to increase threefold, when compared to using RGB images. We also refrained from using resource-hungry 52
mathematical operations either through their minimal use or through substitution with their faster variants.
53
Chapter 7 Conclusion and Future Work We have demonstrated four versions of three image processing algorithms of varying complexities, namely, Gaussian smoothing, Canny edge detecting and KLT tracking. We found both Intel processors were not best suited for real-time image processing involving larger image size and faster frame rate. The older Prescott microarchitecture (Pentium 4 HT) consistently outperformed the multicore Core microarchitecture (Core 2 Duo), which may be attributed to Prescott’s extremely long pipeline and twin double speed ALUs higher clock speed. However Core did better in KLT tracking tests, even when Core’s results were marginally better than Prescott’s. Core’s ability to handle computationally complex tasks much better than simpler ones. Also, we are possibly among the first to pit the GPU against the PS3/Cell BE and compare their image processing capabilities. Our GPU implementations, which exploited the parallelism and incredible raw processing power provided by todays commodity graphics hardware, are considerably faster than optimized CPU and PS3 versions. We should emphasize that the algorithms here can be made more efficient, and further speedups should be possible using more sophisticated data-parallel algorithms. Our experience shows that by using CUDA, one may implement complex image processing algorithms requiring accuracy and real-time execution. Besides arithmetic instruc-
tion optimization and coalesced memory access by finding optimum block and grid size, our work could be extended to include staging coefficients, streams. Currently, our KLT implementation on PS3 is unable to track more than 600 features without experiencing loss of features after a couple of frames. We hope to see this addressed without sacrificing quality and speed of tracking. We would like to parallelized Gaussian smoothing, optimized for PS3 and CUDA, to include adaptive Gaussian smoothing. Also, our PS3 optimization was mainly through to vectorization, even though double buffering was used in Gaussian smoothing and for finding gradient magnitude in Canny edge detection. Due to the complexity of implementing KLT on PS3, we avoided optimizations such as double buffering, loop unrolling etc, except vectorization. Other parallelization techniques could be applied to see their effect on execution time.
55
Bibliography [1] J. Ahn, W. J. Dally, and M. Erez. Tradeoff between data-, instruction-, and thread-level parallelism in stream processors. In In Proceedings of the 21 st ACM International Conference on Supercomputing, 2007. [2] S. Birchfield. Derivation of Kanade-Lucas-Tomasi Tracking Equation, 1997. [3] S. Birchfield. KLT: An implementation of the Kanade-Lucas-Tomasi feature tracker, 1998. [4] G.R. Bradski and V.Pisarevsky. Intel’s computer vision library: Applications in calibration, stereo, segmentation, tracking, gesture, face and object recognition. In IEEE Computer Society Conference on Computer Vision and Pattern Recognition (CVPR), volume 2, 2000. [5] J.F. Canny. A computational approach to edge detection. IEEE Transactions on Pattern Analysis and Machine Intelligence (PAMI), 8(6):679–698, 1986. [6] S. Che, J. Meng, J. W. Sheaffer, and K. Skadron. A performance study of general purpose applications on graphics processors. In First Workshop on General Purpose Processing on Graphics Processing Units, 2007. [7] T. Chen, R. Raghavan, J. N. Dale, and E. Iwata. Cell Broadband Engine Architecture and its first implementation: A performance view. IBM J. Res. Dev., 51(5):559–572, 2007. [8] P. Colantoni, N. Boukala, and J. Da Rugna. Fast and accurate color image processing using 3d graphics cards. In Proceedings Vision, Modeling and Visualization 2003, volume 133, 2003. [9] E.R. Davies. Machine vision: theory, algorithms, practicalities. Academic Press, London, 1990. [10] G. Deng and L.W. Cahill. An adaptive Gaussian filter for noise reduction and edge detection. In Nuclear Science Symposium and Medical Imaging Conference, 1993 IEEE Conference Record., pages 1615–1619, 1993. [11] J. Doweck. Smart Memory Access and the Energy-Efficient Performance of the Intel Core Microarchitecture. Intel Technology Journal, 2008.
[12] J. Fung and S. Mann. OpenVIDIA: Parallel GPU Computer Vision. In Proceedings of the 13th annual ACM international conference on Multimedia, pages 849–852. ACM New York, NY, USA, 2005. [13] J. Fung and S. Mann. Openvidia: Parallel gpu computer vision. In Proc. 13th annual ACM international conference on Multimedia, 2005, pages 849–852. ACM Press, 2005. [14] R.C. Gonzalez, R.E. Woods, and S.L. Eddins. Digital image processing using MATLAB. Prentice Hall, Inc. Upper Saddle River, NJ, USA, 2003. [15] C. Gupta and S. Mohan. Implementation of Canny Edge Detector of color images on CELL/B.E. Architecture, 2007. [16] G. Hinton, D. Sager, M. Upton, D. Boggs, D. Carmean, A. Kyker, and P. Roussel. The microarchitecture of the Pentium 4 processor. Intel Technology Journal, (1):200–1, 2001. [17] D. Horn. Stream reduction operations for GPGPU applications. GPU Gems, 2:573–589, 2005. [18] IBM. Cell broadband engine programming handbook, version 1.0, 2006. [19] Intel. A detailed look inside the Intel NetBurst micro-architecture of the Intel Pentium 4 processor. Intel Technology Journal, 2000. R sse4 programming reference. 2007. [20] Intel. Intel R 64 and IA-32 Architectures Software Developers Manual. 2007. [21] Intel. Intel
[22] J. A. Kahle, M. N. Day, H. P. Hofstee, C. R. Johns, T. R. Maeurer, and D. Shippy. Introduction to the Cell multiprocessor. IBM Journal of Research and Development, 49(4/5), 2005. [23] S. J. Kim, D Gallup, J-M Frahm, A. Akbarzadeh, Q. Yang, R. Yang, D. Nistr, and M Pollefeys. Gain adaptive real-time stereo streaming. In In Int. Conf. on Vision Systems, 2007. [24] E.R. Komen. Low-level image processing architectures, 1990. [25] G.A. Korn and T.M. Korn. Mathematical handbook for scientists and engineers: Definitions. Theorems, and Formulas for Reference and Review, pages 881–884, 1968. [26] D. Koufaty and D. T. Marr. Hyperthreading Technology in the Netburst Microarchitecture. IEEE Micro, 23(2):56–65, 2003. [27] E. Lindholm, J. Nickolls, S. Oberman, and J. Montrym. NVIDIA Tesla: A unified graphics and computing architecture. IEEE Micro, 28(2):39–55, 2008.
57
[28] B. D. Lucas and T. Kanade. An iterative image registration technique with an application to stereo vision. In Proceedings of the 7th International Joint Conference on Artificial Intelligence, pages 674–679, 1981. [29] Y. Luo and R. Duraiswami. Canny edge detection on NVIDIA CUDA. In IEEE Computer Society Conference on Computer Vision and Pattern Recognition Workshops (CVPR Workshops), 2008. [30] H.A. Medina. A Sequence of Polynomials for Approximating Arctangent. American Mathematical Monthly, 113(2):156, 2006. [31] H.S. Neoh and A. Hazanchuk. Adaptive edge detection for real-time video processing using FPGAs. Global Signal Processing, 2004. [32] A. Neubeck and L. Van Gool. Efficient non-maximum suppression, 2006. [33] C. Nicolescu and P. Jonker. A data and task parallel image processing environment. Parallel Computing, 28(7-8):945–965, 2002. [34] L. Nyland and M. Snyder. Fast Trigonometric Functions Using Intels SSE2 Instructions. Technical report, Intel Tech. Rep., 2003. [35] S. Persa and P. P. Jonker. Real time image processing architecture for robot vision. In Intelligent Robots and Computer Vision XX: Algorithms, Techniques, and Active Vision (Proc. Conf. Boston, USA, 28 October - 2 November 2001), Proc. SPIE, pages 0–8194, 2001. [36] S. Persa, C. Nicolescu, and P. Jonker. Evaluation of Two Real Time Low Level Image Processing Architectures. In Proceedings of IAPR Workshop on Machine Vision Applications, pages 295–298, 2000. [37] M. Pharr and R. Fernando. GPU Gems 2: Programming Techniques for HighPerformance Graphics and General-Purpose Computation, 2005. [38] V. Podlozhnyuk. Image convolution with CUDA. NVIDIA Corporation white paper, June, 2097(3), 2007. [39] S. Rajan, S. Wang, R. Inkol, and A. Joyal. Efficient approximations for the arctangent function. IEEE Signal Processing Magazine, 23(3):108–111, 2006. [40] RM Ramanathan, P. Contributors, R. Curry, S. Chennupaty, R.L. Cross, S. Kuo, and M.J. Buxton. Extending the worlds most popular processor architecture. Intel Technology Journal, 2006. [41] J. Shi and C. Tomasi. Good features to track. In IEEE Computer Society Conference on Computer Vision and Pattern Recognition, pages 593–600, 1994. 58
[42] S. Sinha, J-M. Frahm, and M. Pollefeys. GPU-based Video Feature Tracking and Matching. Technical report, In Workshop on Edge Computing Using New Commodity Architectures, 2006. [43] S.N. Sinha, J.M. Frahm, M. Pollefeys, and Y. Genc. Feature tracking and matching in video using programmable graphics hardware. Machine Vision and Applications, pages 1–11, 2007. [44] K. Sugita, T. Naemura, and H. Harashima. Performance evaluation of programmable graphics hardware for image filtering and stereo matching. In Proceedings of the ACM symposium on Virtual reality software and technology, pages 176–183. ACM New York, NY, USA, 2003. [45] C. Tomasi and T. Kanade. Detection and tracking of point features. Technical report, Technical Report CMU-CS-91-132, Carnegie Mellon University, 1991. [46] O. Wechsler. Inside Intel Core Microarchitecture: Setting New Standards for Energyefficient Performance. Intel Technology Journal, 2006. [47] R. Yang and G. Welch. Fast image segmentation and smoothing using commodity graphics hardware. Journal of Graphics Tools, 7(4):91–100, 2002. [48] H.M. Yip, I. Ahmad, and T.C. Pong. An Efficient Parallel Algorithm for Computing the Gaussian Convolution of Multi-dimensional Image Data. The Journal of Supercomputing, 14(3):233–255, 1999. [49] C. Zach, D. Gallup, and J.M. Frahm. Fast gain-adaptive KLT tracking on the GPU. In IEEE Computer Society Conference on Computer Vision and Pattern Recognition Workshops (CVPR Workshops), pages 1–7, 2008.
59