International Journal of Applied Engineering Research, ISSN 0973-4562 Vol. 10 No.85 (2015) © Research India Publications; http/www.ripublication.com/ijaer.htm
EVALUATION OF NUMERICAL MODEL OF PERFORMANCE AND EMISSION ON BIOFUELLED INTERNAL COMBUSTION ENGINE M.Vijayakumar1.1, Assiatant professor/Mechanical engineering, M.Kumarasamy college of Engg, Karur. Email:
[email protected]
P.C.Mukesh Kumar1.2, Assistant professor/Mechanical Engg, University College of Engg, Dindugul.
E. Sankaranarayanan2.1, Undergraduate Student/Mechanical Engg M.Kumarasamy college of Engg, Karur.
B.Babuji2.2. Undergraduate Student/Mechanical Engg M.Kumarasamy college of Engg, Karur.
Abstract:- International energy agency has announced that energy usage increase more than 53% of existing usage by 2030 and another association united state energy information administration (EIA) stated that the fuel consumption in the world increased from 86.1 million barrels /day to 110.6 million barrels/day by 2035. Above mentioned two statements clearly announced future decade’s energy demands. Bio diesel is one of the major sources to prevent this future fuel demand. In this biodiesel experimental investigation is not possible for many blends and many loads due to time and fuel availability. So mathematical model is considered to be an effective alternative solution for biodiesel research. This work mainly talks about comparison of experimental and mathematical investigation. Various mathematical models have been developed in performance analysis (brake thermal efficiency and SFC) and emission analysis (oxides of nitrogen and smoke). The outcome of work states that the error is minimum and variation is seen mainly in 40% and 80% loads, it is verified by using two criteria sum of deviation squared (SDS) and Average percent absolute deviation (APD) and it has been proved.
biomass sources. Neither of the fuels is well suited for use in diesel engines, and the use of high compression ratios and ignition improve and the ignition assistance devices is very common [2,3]. Normally, three types of catalysts, such as a strong alkali, a strong acid or an enzyme, can be used in the manufacturing process of the transesterification method. Almost all biodiesel fuels are produced by using base catalyzed transesterification process, as it is a simple process requiring only a low temperature [4], shorter reaction time and less amount of required catalyst [5]. Hence, the strong alkali catalyst is widely used in the transesterification process to produce biodiesel. NaOH, due to its low cost, is widely used in a large scale transesterification [6]. Methanol is used mostly in this chemical reaction due to its superior advantages of high solubility in oil, fast reaction rate, good physical and chemical properties, and low cost [79]. Two step process of producing biodiesel from pungamia pinnata oil was studied and the effect of FFA level on the production of biodiesel was also studied. Ester content of pungamia methyl esters was determined by high performance liquid chromatography [10]. The another important Transesterification method studied from waste fryer grease (WFG) containing 5–6 wt.% free fatty acid (FFA) which was carried out with methanol, ethanol and the mixtures of methanol or ethanol maintained the oil to alcohol molar ratio of 1:6 and initially with KOH as a catalyst. Transesterification of vegetable oil to biodiesel fuel using alkaline catalyst was also referred [11,12].The biodiesel blending ratio was decided from an experimental study with olive oil in
Keywords: Biodiesel, Oxides of nitrogen, Mathematical model, Experimental analysis
I.INTRODUCTION: Producing and using bio fuels for transportation offer an alternative to fossil fuels and they can help provide solutions to many environmental problems. The recent commitment of many countries to increase bio energy has added an impetus to the search for viable bio fuels [1]. Methanol and ethanol are two viable alternative fuels which possess the potential to be produced from
454
International Journal of Applied Engineering Research, ISSN 0973-4562 Vol. 10 No.85 (2015) © Research India Publications; http/www.ripublication.com/ijaer.htm
histories. The measured data can be analyzed online or stored for post – processing.
DI and IDI engines. They have used 25:75 and 50:50 blends of transesterified olive oil and diesel fuel and observed slightly increased SFC [13] and another Bioblends used soyabean and sunflower oil in a 25% blend with petroleum diesel fuel [14]. Engine performance evaluation of DI and IDI engines with JME [15] and calculated the heat release rate for rapeseed methyl ester (RME) and higher biodiesel combustion rate was observed [16]. The combustion characteristics of neat animal fat, animal fat emulsion with ethanol and water are compared with diesel fuel [17]. The performance of jatropha curcas oil-diesel blends in CI engine was observed and reduced the raw oil viscosity by blending with diesel. The biodiesel – diesel blends properties are varied from edible and non-edible oil feedstock [18] and an investigation of milkweed (asclepias) seed oil as an alternative feedstock for the production of a biodiesel fuel was also studied. The authors concluded that conversion of this highly unsaturated oil into methyl ester is an easier process than its conversion into its ethyl ester [19].
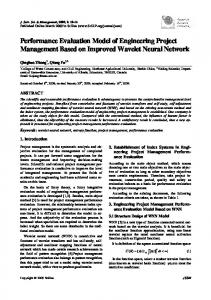
Figure 1 Experimental setup III.MATHEMATICAL INVESTIGATION A necessary preliminary step before a simulation or optimization of a thermal system can begin is almost invariably that of modeling some characteristics of the equipment or processes. The simulation and optimization operations almost always use data in equation form, and the conversion of data to equation form is called mathematical modeling. Engineers may have a variety of reasons for wanting to develop equations, but the crucial ones in the design of thermal systems are,
II. EXPERIMENTAL INVESTIGATION 2.1. Experimental Setup The test engine was Kirloskar made, fourstroke, single cylinder, direct-injection, water-cooled, constant speed (1500 rpm), and naturally aspirated VCR engine. Which has a bore of 87 mm and stroke of 110 mm; the compression ratio of 15:1 to 18:1 and the manufacturer’s recommended injection timing and injection pressure of 23ocrank angle before TDC and 210 bar, respectively. The combustion chamber is direct injection type with a bowl-in piston design. This work has been done with single compression ratio of 17:1. Figure 1 shows the engine setup.
i. ii.
To facilitate the process of system simulation To develop a mathematical statement for optimization.
3.1. Criteria for Fidelity of Representation There needs to be some measure of the effectiveness of mathematical model fitting the data in order to have some basis for selecting the constants and co-efficient in a given form of equation and choosing between available forms of equations. There are numerous criteria in use, but I am limiting to three, they are
2.2. Data Acquisition System The cylinder pressure at each crank angle was measured and stored by a digital data acquisition system. It consisted of a Kistler water-cooled flush mounted piezoelectric pressure transducer in conjunction with Kistler charge amplifier for converting the electric charge into voltage. It could measure and store up to 200 cycles engine pressure
• Sum of deviations squared (SDS). • Average Percent Absolute Deviation (APD). • Goodness of Fit (GOF).
455
International Journal of Applied Engineering Research, ISSN 0973-4562 Vol. 10 No.85 (2015) © Research India Publications; http/www.ripublication.com/ijaer.htm
SDS criteria is estimated by the following equation 𝑆𝐷𝑆 =
𝑛 𝑖=1 (𝑦𝑖
− 𝑌𝑖 )2
SFC
1
APD criteria is estimated by the following equation 𝑛
𝐴𝑃𝐷 = 100
𝑛 𝑖=1
3.4. Mathematical Model for Oxides of nitrogen:
𝑌𝑖 −𝑦 𝑖 2
2
𝑌𝑖
NOx
The third criterion GOF is estimated by the following equation GOF, % = 100 1 −
𝑛 𝑖=1 (𝑦𝑖
3
G
HSU
− 𝑌𝑚𝑒𝑎𝑛 )2
Using the above stated mathematical models, comparison of experimental and mathematical investigation of engine performance and emission analysis at different biodiesel blends (B0, B25, B50, B75 and B100) and different load (20%, 40%, 60%, 80% and 100%) has been done. In this discussion mainly consider only 40% and 80% load. Average Percent Absolute Deviation (APD) chart clearly mention the maximum deviation found only on 40 % and 80 % loads in all the biodiesel blends.
There are various types of equations are available they are, – Polynomials, – Polynomials with negative exponents, – Exponential Equations, – Gompretz Equation. – Combination Forms. Two methods of solving the equations they are, – Method Of Least Squares, – Lagrange Interpolation Mathematical modeling has been developed using “method of least squares”. Model
for
Brake
= -6.875+0.85L-2.8125L2*10-3+0.175D8.5LD*10-3 + 8.75L2D*10-5-D2*103 2 -5 2 2 -7 +6D L*10 -5D L *10 . 8 IV.RESULT AND DISCUSSION
4
Various Mathematical Models:
3.2. Mathematical Efficiency:
= 111.65+6.4*L+0.01094L2-0.9925D + 0.112DL -1.11875 L2 D*10-3+8.5D2*10-31.12 L D2 *10-3 +1.075D2L2*10-5. 7
3.5. Mathematical Model for smoke intensity:
SDS 0.5
Where G= sum of the squares of the deviations of Yi from the mean value of Y. 𝐺=
= 2.457-1.1636*10-2D+8.48*10-5*D23.7569*L*10-2 + D *L*2.91816*10-4D2L*2.52288*10-6+ 2.1255L2 * 10-4 DL2*1.9211*10-6+1.70704*L2D2*10-8. 6
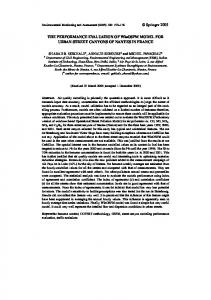
4.1Brake thermal efficiency: Fig 4 the average percent absolute deviation clearly shows that maximum variation in brake thermal efficiency between mathematical model and experimental model at 40% and 80% loads. The 40% and 80% brake thermal efficiency comparison between MM and EM shown in fig 2 & 3. The APD of brake thermal efficiency at 40% load is 0.020099% and 80% load APD is 0.015876%. The variation in APD values is very minimal.
thermal
The mathematical model for brake thermal efficiency is given below. Mathematical model has been developed using cubical polynomial equation with two independent variables. First independent variable is concentration of diesel in fuel blend (D) and another is percentage of load acting on engine (L).
4.2Specific fuel consumption: The average percent absolute deviation of specific fuel consumption fig 7 clearly shows that maximum variation also in 40% and 80% load. The 40% and 80% specific fuel consumption comparison between MM and EM has shown in fig 5 & 6. The APD of SFC at 40% load is 0.045548% and 80% load APD is 0.018585%. This MM error of APD values is
BTE = 3.1004+ 0.6681L - 0.0037L2 + 0.2288D0.01259LD + 0.0001*L2D-0.0027D2+ 0.00016 L D2 - 0.0000013 L2 D2. 5 3.3. Mathematical Model for specific fuel consumption:
456
International Journal of Applied Engineering Research, ISSN 0973-4562 Vol. 10 No.85 (2015) © Research India Publications; http/www.ripublication.com/ijaer.htm
very minimum. A SFC value of experimental is very closer to MM values.
Figure 4 Average percent absolute deviations for brake thermal efficiency
4.3Oxides of nitrogen:
Produced maximum difference in between MM and EM. The values of APD for 40% and 80% are 0.006887% and 0.006814% this values also very closer tolerance limit.
Fig 10 notified APD values of oxides of nitrogen. In this emission analysis also 40% and 80%
SFC in Kg/kws
BRAKE THERMAL EFFICIENCY IN %
LOAD 40% 40 30 20
MM
10
EM
0
40% LOAD
3 2 1
MM
0
EM B0
B25 B50 B75 B100 BLEND
B0 B25 B50 B75 B100 BLEND
Figure 5 Comparison of specific fuel consumption at 40% load between MM and EM
Figure 2 Comparison of Brake thermal efficiency at 40% load between MM and EM
SFC in Kg/Kws
BRAKE THERMAL EFFICIENCY IN %
LOAD 80% 40 30 20
1 0.5
MM EM
0
The
10
80% LOAD
B0 B25 B50 B75 B100 BLEND
Ac
0
Figure 6 Comparison of specific fuel consumption at 80% load between MM and EM
B0 B25 B50 B75 B100
BLEND
APD in %
Figure 3 Comparison of Brake thermal efficiency at 80% load between MM and EM
APD
0.03
APD
0.06 0.04 0.02 0 20
0.02
40
60
80 100
APD
LOAD in %
0.01
APD Figure 7 Average percent absolute deviations for specific fuel consumption
0 20
40
60
80
100
457
International Journal of Applied Engineering Research, ISSN 0973-4562 Vol. 10 No.85 (2015) © Research India Publications; http/www.ripublication.com/ijaer.htm
4.4Smoke Intensity:
EM
50 MM EM B0 B25 B50 B75 B100 BLEND
80% LOAD
Figure 12 Comparison of smoke at 80% load between MM and EM MM EM APD in %
Nox in ppm
80% LOAD
0
BLEND Figure 9 Comparison of oxides of nitrogen at 80% load between MM and EM
APD in %
EM
100
Figure 8 Comparison of oxides of nitrogen at 40% load between MM and EM
0.01
MM
Figure 11 Comparison of smoke at 40% load between MM and EM
BLEND
800 600 400 200 0
10
BLEND
The B0 B25 B50 B75 B100
20
B0 B25 B50 B75 B100
40% LOAD
0
40 % Load
30
0
SMOKE in %
Nox in ppm
500
Smoke in %
Fig 13 shows the APD values of smoke Intensity. In this smoke analysis of MM methods produced 20% and 40% maximum difference in between MM and EM. The values of APD for 20% and 40% are 0.023284% and 0.051823% this values also very closer tolerance limit. In this MM methods suitable to determine the smoke limit.
0.1
APD
0.05 APD
0 20 40 60 80 100 LOAD
Figure 13 Average percent absolute deviations for smoke
APD
V. CONCLUSION
0.005
Form above discussions we came to a conclusion that mathematical models can be used as an alternate method to predict the performance and emission parameters of a biodiesel blend in various loads. In actual practice it may take a day for transesterification process and running the engine for performance and emission analysis for one blend. After a day’s effort only we will come to know that blend is not effective. But by this mathematical model it is only a matter of minute. In industries they don’t
APD 0 20 40 60 80 100 LOAD
Figure 10 Average percent absolute deviations for oxides of nitrogen
458
International Journal of Applied Engineering Research, ISSN 0973-4562 Vol. 10 No.85 (2015) © Research India Publications; http/www.ripublication.com/ijaer.htm
have enough time and man power for this work. This can be used for training the optimization tool. 9. NOMENCLATURE D L BTE SFC NOx yi Yi n MM EM
1.
2.
3.
4.
5.
6.
7.
8.
Percentage of diesel Percentage of load Brake thermal efficiency Specific fuel consumption Oxides of nitrogen value of the dependent variable computed from the equation. value of the dependent variable computed from simulated. total number of data points. Mathematical model Experimental model
10.
11.
12.
REFERENCES Demirbas A. Biofuels sources, biofuel policy, biofuel economy and global biofuel projections. Energy Conversion Management 2008; 49: 2106-16. McCormick RL, and Parish R. Technical barriers to the use of ethanol in diesel fuel. Milestone report to NREL/MP 540-32674; 2001. Hansen AC, Lyne PWL, Zhang Q. Ethanol – diesel blends; A. step towards a bio-based fuel for diesel engines. SAE paper 2001-016048; 2001. Ma MA, Hanna. Biodiesel Production: A Review. Bio resource Technology 1999; 70:1-15. Lin CY, Lin HA. Diesel engine performance and emission characteristics of biodiesel produced by the peroxidation process. Fuel 2006; 85: 298-305. Agarwal D, Agarwal AK. Performance and emissions characteristics of jatropha oil (preheated and blends) in a direct injection compression ignition engine. Applied Thermal Engineering 2007; 27:2314-23. Korbitz W. Biodiesel production in Europe and North America, an encouraging prospect. Renewable Energy 2000; 16:107883. Nagaraja AM, Kumar GP. Characterization and optimization of rice bran oil methyl ester
13.
14.
15.
16.
17.
18.
19.
459
for CI engines at different injection pressures. SAE paper 2004-28-0048; 2004. Sinha S, Agarwal AK. Performance evaluation of a biodiesel (rice bran oil methyl ester) fuelled transport diesel engine. SAE paper 2005-01-1730; 2005. Malaya Naik, Meher LC, Naik SN, Das LM. Production of biodiesel from high free fatty acid Karanja (Pongamia Pinnata) oil. Biomass and Bioenergy 2008; 32:354-57. Pramanik K. Properties and uses of Jatropha curcas oil and diesel fuel blends in compression ignition engine. Renewable energy 2003; 28: 239-48. Keera ST, El Sabagh SM, Taman AR. Transesterification of vegetable oil to biodiesel fuel using alkaline catalyst. Fuel 2011;90: 42–7. Rakopoulos CD, Hountalas DT, Rakopoulos DC, Giakoumis EG. Experimental heat release rate analysis in both chambers of an indirect injection turbocharged diesel engine at various load and speed conditions SAE paper 2005-01-0926; 2005. Schlick ML, Hanna MA, Schinstock JL. Soybean and sunflower oil performance in a diesel engine. ASAE paper 1986-86-3068; 1986. Rao GAP, Mohan PR. Performance evaluation of DI and IDI engines with Jatropha oil based biodiesel. Journal of Institute of Engineers (India) 2005; 86:72-76. Grimaldi CN, Lucio Postrioti, Michele Battistoni Federico Millo. Common rail HSDI diesel engine combustion and emissions with fossil/Bio-derived fuel blend. SAE paper 2002-01-0865; 2002. Senthil kumar M, Karihuel A, Bellettre J, Tazerout M. Ethanol animal fat emulsion as a diesel engine fuel- Part 2: Engine test analyses. Fuel 2006; 85: 2646-52. Silitonga AS, Masjuki HH, Mahlia TMI, Ong HC, Chong WT. Overview properties of biodiesel diesel blends from edible and nonedible feedstock. Renew Sust Energy Rev 2013; 22: 346–6. Holser RA, Kuru RH. (2006) Transesterified Milkweed (asclepias) seed oil as a biodiesel fuel. Fuel 2006; 85:2016-2110.4.