e-Learning’09
Computer Based Testing for E-learning: Evaluation of Question Classification for Computer Adaptive Testing Dilek Karahoca, Adem Karahoca, Betul Erdogdu, Huseyin Uzunboylu, Ali Güngör Abstract: The objective of this study is to determine the item difficulties of tests that are going to be used on a Computer Adaptive Testing (CAT). According to the student responses, item difficulties have been found using different approaches. Consequently, best approach to find item difficulty has been determined by a simple classification tool. By using this classification tool, the best method to find item difficulties is determined and items have been classified using Rapidly-exploring Random Tree (RRT) algorithm. This classification ended up with two different results that define the future work of this study. First one tries to reveal which algorithm is the best method for classifying the questions for CAT software and the second one has determined whether the size of item pool is important for question classification. Key words: Item Analysis, Computer Based Testing, Computer Adaptive Testing, RRT.
INTRODUCTION In education, computers can be used to deliver the course content and to measure the achievement in courses. This thesis dwells upon the assessment techniques in education via computers. The British Standards Institution estimates that approximately 1000 computer-assisted assessments are performed each day in the United Kingdom [1]. Computer delivered assessments focuses on two specific delivery methods: computer-based test (CBT) and computer-adaptive test (CAT). It have been reported numerous benefits of the CBT approach over the standard paper-and-pencil one [2-4]. These benefits ranged from the automation of marking and subsequent reduction in marking workload to the opportunity to provide students with immediate feedback on their performance [5]. Due to the limitations of traditional success measuring rates, the contribution for the understanding of students’ knowledge about a subject is little. The use of CBT is an attempt to overcome these limitations and go some way to make course and assessments more interesting and useful processes for both teachers and students. Notwithstanding these benefits, previous works by researchers suggested that CBTs have being viewed as unsatisfactory in terms of efficiency. The reason for this inefficiency is that the questions administered during a given CBT session are not tailored for the specific ability of an individual student. In a typical CBT, the same predefined set of questions is presented to all students participating in the assessment session, regardless of their ability [5]. The questions within this fixed set are typically selected in such a way that a broad range of ability levels, from low to advanced, is catered for [4]. In this scenario, it is accepted that high-performance students are presented with one or more questions that are below their level of ability. Similarly, lowperformance students are presented with questions that are above their level of ability [4]. The underlying idea of a CAT is to offer each student a set of questions that is appropriate to their level of ability [4]. Generally, a CAT initiates with a random question with an average difficulty. A more difficult question follows if the student answers the question correctly. Conversely, if the response provided is incorrect, an easier question that is suitable for this new lower estimate is presented next [6-7]. The use of CAT has been increasing and indeed replacing traditional CBTs in some areas of education and training [5]. Usually this replacement is associated with the need for higher efficiency when assessing large numbers, for example, in online training. The study presented here focuses on the evaluation of determining item difficulties for CAT software. DATA GATHERING AND PREPROCESSING The dataset introduced here consists of a midterm and a final exam taken by 368 students during the first semester of History of Civilization course. In the midterm exam, there were 13 multiple choice questions with 4 choices and there were 30 multiple - 251 -
e-Learning’09 choice questions with 4 choices in the final exam. Questions were delivered via a CBT system to the students using separate computers. CBT system was a web application running on Intranet backbone. Questions delivered during the midterm and final exams were taken into consideration for classification purpose. The reason for classifying these questions is to convert the CBT system to a Computer Adaptive Testing (CAT) system. In CAT, items are drawn from the item pool by a simple item selection algorithm so for each individual examinee, appropriate items are delivered. All items in the CAT item pool range in difficulty values. If an examinee gets an item right, an item having a greater difficulty is selected from the item pool and delivered to the examinee as the next question of the test. If he/she gets it wrong, then an item having a smaller difficulty is selected from the item pool and delivered to the examinee as the next question of the test. Table:1 Nominal question levels Question Level Very Easy Easy Middle Hard Very Hard
Numerical Representation -1 -0,5 0 0,5 1
METHODS TO FIND ITEM DIFFICULTY P value In many educational and psychological measurement situations, the easiest way is to determine the item difficulty from the proportion of the total group selecting the correct answer to that question. The following formula may be used to calculate the item difficulty factor (called the p-value): p = c / n Where c is the number of students who selected the correct answer and n is the total number of respondents. Table 2. c, n, p and nominal question levels for the Midterm exam using p-value method Item ID
c
n
p
1 2 3 4 5 6 7 8 9 10 11 12 13
194 193 235 186 202 219 168 150 207 172 194 156 137
368 368 368 368 368 368 368 368 368 368 368 368 368
0,527 0,524 0,639 0,505 0,549 0,595 0,457 0,408 0,563 0,467 0,527 0,424 0,372
Nominal Question Levels 0 0 -1 0 -0,5 -0,5 0,5 0,5 -0,5 0 0 0,5 1
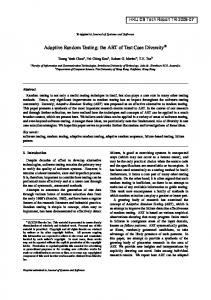
As seen from Table 2 and Table 4, p-value is indirectly proportional to the item difficulty. For instance, the 13th question of the midterm exam is answered by 137 test takers among 368 test takers. The p-value of this question is 0,372, which shows that the probability of getting this question is about 37%. With this probability 13th question is the most difficult among the midterm exam questions. For the items in Table2, the mean and standard deviation is calculated using p values as shown in Table3. According to these mean and standard deviation values, a scale, shown in Figure 1 is - 252 -
e-Learning’09 designed for placing items into nominal question levels. And all items are placed into related nominal question level as shown in below table. Table 3. Mean and Standard Deviation of Item Difficulties found by p-value Method Mean Standard Deviation
0,389 -1
MIDTERM
0,504
0,076
FINAL
0,487
0,116
0,466 -0,5
0,542 0
0,619 0,5
1
Fig.1. Midterm Exam Nominal Question Level vs. Item Difficulty Scale Same procedure is also applied to the final exam items and nominal distributions found after the completing the procedure. Table 4. c, n, p and Nominal Question Levels for the Final Exam using p-value Method FINAL
Item ID 1 2 3 4 5 6 7 8 9 10 11 12 13 14 15
c 179 146 132 111 163 117 142 153 142 161 179 196 102 206 191
n 356 356 356 356 356 356 356 356 356 356 356 356 356 356 356
p 0,503 0,410 0,371 0,312 0,458 0,329 0,399 0,430 0,399 0,452 0,503 0,551 0,287 0,579 0,537
Nominal Question Levels 0 0,5 0,5 1 0 0,5 0,5 0 0,5 0 0 -0,5 1 -0,5 0
Item ID 16 17 18 19 20 21 22 23 24 25 26 27 28 29 30
c 190 175 209 154 197 207 266 217 177 211 137 245 201 203 91
n 356 356 356 356 356 356 356 356 356 356 356 356 356 356 356
p 0,534 0,492 0,587 0,433 0,553 0,581 0,747 0,610 0,497 0,593 0,385 0,688 0,565 0,570 0,256
Nominal Question Levels 0 0 -0,5 0 -0,5 -0,5 -1 -0,5 0 -0,5 0,5 -1 -0,5 -0,5 1
NORM-REFERENCED ITEM ANALYSIS A norm-referenced test (NRT) is a type of test, assessment, or evaluation in which the tested individual is compared to a sample of his or her peers. The term “normative assessment” refers to the process of comparing one test-taker to his or her peers. In NRT, the goal is to rank the entire set of individuals in order to make comparisons of their performances relative to one another. In this paper, students’ performances will be analyzed on multiple-choice tests. Well-constructed multiple-choice items can be used to diagnose student difficulties if the incorrect options are designed to reveal common misconceptions, and they can provide a more comprehensive sampling of the subject material because more questions can be asked. In addition, they are often more valid and reliable than essay tests because; (a) They sample material more broadly; (b) discrimination between performance levels is easier to determine; and (c) scoring consistency is virtually guaranteed when carried out by machine. The validity of multiple-choice tests depends upon a systematic selection of items with regard to both - 253 -
e-Learning’09 content and level of learning. Although most teachers try to select items that sample the range of content covered in class, they often fail to consider the level of discrimination and level of difficulty of the items they use. Item discrimination and item difficulty can be calculated by evaluating the test takers as in norm-referenced item analysis [8]. Item difficulty is a measure of overall difficulty (p) of the test item. The lower the p, the more difficult a particular item is. Whereas, item discrimination tells us how good a question is for separating high and low performers. It is more important for an item to be discriminable than it is to be difficult. For norm-referenced item analysis, test takers should be sorted in descending order first. Then two things must be specified: number of people in high and low groups and number of people in high and low groups who get a particular answer right. Using these two groups, item discrimination index and item difficulty index can be calculated using the below formulas: Item Discrimination Index: a = (Up / U) – (Lp / L) Item Difficulty Index: p = (Up + Lp) / (U + L) Where, Up = Number of high performers who got question right Lp = Number of low performers who got question right U = Number of high performers L = Number of Low performers Table 5. Lp, Up, a and p and Nominal Question Levels MIDTERM
Item ID Lp Up a p 1 40 91 0,42 0,539 2 39 86 0,38 0,514 3 46 108 0,51 0,634 4 35 83 0,39 0,486 5 51 74 0,19 0,514 6 50 100 0,41 0,617 7 28 94 0,54 0,502 8 29 71 0,34 0,412 9 41 98 0,46 0,572 10 23 93 0,57 0,477 11 30 99 0,56 0,531 12 22 98 0,62 0,494 13 28 65 0,30 0,383
Nominal Question Levels 0 0 -1 0,5 0 -0,5 0 0,5 -0,5 0,5 0 0 1
In Table 5 and Table 6, the a and p values for 13 midterm and 30 final questions calculated by the formulas respectively. Nominal question levels are found using the same scaling technique in p-value section. Table 6. Mean and Std. Dev. of Item Difficulties found by Norm-Referenced Item Analysis Method Mean Standard Deviation MIDTERM
0,513 0,070
FINAL
0,507 0,116
The higher value of a (up to 1), the better the item is capable of separating high and low performance. If a = 1, this means the entire high performance group and none in the lower performance group get a particular question right. Since this is not a frequently seen situation, a rarely (if ever) = 1. An item has an acceptable level of discrimination if a >= 0,30 p and a are not independent probabilities. Discrimination indexes less than 0,30 are sometimes acceptable if we have a very high p value. From Table 5 and Table 7, it is observed that 100% of midterm questions and 93,33% of final - 254 -
e-Learning’09 questions have acceptable level of discrimination. However, none of them are close to the optimum difficulty level. Table 7. Lp, Up, a and p and Nominal Question Levels for the Final Exam using FINAL Item
Lp
Up
a
p
ID
Nominal
Item
Question
ID
Lp
Up
a
p
Nominal Question
Levels
Levels
1
36
83
0,40 0,515
0
16
40
90
0,43
0,563
0
2
39
60
0,18 0,429
0,5
17
46
72
0,22
0,511
0
3
26
69
0,37 0,411
0,5
18
60
92
0,27
0,658
-0,5
4
16
62
0,40 0,338
0,5
19
29
79
0,43
0,468
0
5
42
73
0,26 0,498
0
20
52
79
0,23
0,567
-0,5
6
35
45
0,08 0,346
0,5
21
59
61
0,01
0,519
0
7
36
66
0,26 0,442
0,5
22
77
99
0,18
0,762
-1
8
27
85
0,50 0,485
0
23
59
84
0,21
0,619
-0,5
9
37
62
0,21 0,429
0,5
24
35
84
0,42
0,515
0
10
27
73
0,39 0,433
0,5
25
50
83
0,28
0,576
-0,5
11
35
88
0,45 0,532
0
26
41
48
0,06
0,385
0,5
12
46
81
0,30 0,550
0
27
54
101
0,40
0,671
-0,5
13
26
40
0,12 0,286
1
28
55
86
0,26
0,610
-0,5
14
61
94
0,28 0,671
-0,5
29
49
79
0,25
0,554
0
15
53
79
0,22 0,571
-0,5
30
29
36
0,06
0,281
1
Considering the optimum difficulty index for multiple choice questions with 4 options from Table 8, both tests can be termed as easy. But yet, taking student success into consideration yields presented nominal question levels. Table 8. Recommended Difficulty Index for Various Test Items Number of Options (k) 2 (True-False) 4 Open-Ended
Optimum Difficulty Index 0,85 0,74 0,50
Selecting the Best Algorithm for Determining Item Difficulties Since item difficulties of both tests are calculated in three different ways, now a classification algorithm called RandomTree is going to be used to determine which of the methods above the best for determining the item difficulty is.
- 255 -
e-Learning’09 Table 9. Classification Results Correctly Classified Instances
Incorrectly Classified Instances
Total Number of Instances
Percentage of Correctly Classified Instances
Percentage of Incorrectly Classified Instances
p – value
6490
4190
10680
60.77 %
39.23 %
Norm Referenced Item Analysis
7052
3628
10680
66.03 %
33.97 %
For this purpose, final exam data will be used since it has more samples. A Rapidlyexploring Random Tree (RRT) is a data structure and algorithm designed for efficiently searching non-convex, high-dimensional search spaces. Simply put, the tree is constructed in such a way that any sample in the space is added by connecting it to the closest sample already in the tree [9]. According to RRT, classification results for pvalue, norm-referenced item analysis are shown in Table 9. As seen from the results the questions are not classified perfectly, to correct this problem data is made nominal and RRT is applied to the data again. Using the nominal data, the results are fairer. According to RRT, classification results for p-value, norm-referenced item analysis on nominal data are shown below in Table 10. Table 10. Classification Results Correctly Classified Instances
Incorrectly Classified Instances
Total Number of Instances
Percentage of Correctly Classified Instances
Percentage of Incorrectly Classified Instances
p – value
9635
1045
10680
90.22 %
9.78 %
Norm Referenced Item Analysis
10252
428
10680
95.99 %
4.01 %
Best method to determine the item difficulties is obtained as Norm-Referenced Item Analysis as a consequence of taking both item discrimination and item difficulty into consideration. Another important thing is to make data nominal before trying to run any classification method on it. CONCLUSIONS AND FUTURE WORK There is a great need in the education area to have tools to monitor test results on a large scale as well as more precise tools to identify questions that are most likely to be benefited by students according to the knowledge level of the student. The applications of item response theory(IRT) modeling can help to create these tools. Item and scale analysis within the framework of IRT will ensure reliable, valid, and accurate measurement of respondent trait levels. Identification of items that are informative or problematic help investigators to understand the domains they are measuring as well as the populations they measure. Furthermore, there is a need in the education area to standardize the concepts and metrics of knowledge measurement to allow comparisons of results across assessment tools and across diverse populations. Item banking is one method that will place multiple measures on a common metric to allow cross-walking of scores. From the item bank, any number of instruments can be tailor-made to measure the population of interest without the worry of score comparability with other groups that may be taking an alternative assessment developed from the same item bank. On top of that, item banking allows for the development of computerized adaptive tests that reduce respondent burden and increases reliable measurement by using a methodology - 256 -
e-Learning’09 that targets in on a respondent’s true score. So, why are the methodologies of item response theory slow to be adopted into the health care measurement field? Item response theory was developed within the framework of educational testing and so most of the literature and terminology is oriented towards that discipline [9]. A limitation of the modern measurement theory is the complexities of the mathematical IRT models. Most researchers have been trained in classical test theory and are comfortable with reporting statistics such as summed scale scores, proportions correct, and Cronbach’s alpha. Beyond the mathematical formulas, there are the complexities of the numerous IRT models themselves as to what circumstances are appropriate to use IRT and which model to use. There is not even a consensus among educators as to the definition of measurement and which IRT models fit that definition. Adding to the burden of confusion, the numerous available IRT software in the market are not user-friendly and often yield different results (parameter and trait estimates) because of the different estimation processes used by the software. Despite these limitations, the practical applications of IRT cannot be ignored. Knowledge of IRT is spreading as more and more classes are being taught within the university disciplines of psychology, education, and public health, and at seminars and conferences throughout the world. Along with this, more books and tutorials are being written on the subject as well as more userfriendly software is being developed. Research applying IRT models are appearing more frequently in health care journals, and much of their concluding comments are directed towards discussing the benefits and limitations of using the methodology in this field. Together, a better understanding of the models and applications of IRT will emerge and IRT will be as commonly used as the methodology of classical test theory. This effort will result in instruments that are shorter, reliable, and targeted towards the population of interest. One further note is that item response theory is only one step towards the goal of the creation of reliable and valid education measures. Hambleton states quite well that IRT is not “the solution to all of our instrument and measurement problems [10]. It is a mathematical model only, and when it can be demonstrated that (1) the model fits the data of interest, (2) model parameters are properly estimated, and (3) the model is used correctly, the model has many useful features. But, none of the IRT models [paraphrased] are magic wands to wave over vague instrument specifications and poorly constructed items to make reliable and valid measurements. Hard and thoughtful work is still required in defining constructs and related domains of content, drafting items to measure the constructs, field testing, test norming, and conducting reliability and validity studies…If these steps are not handled well, bad measurements will follow”. However in the sample of this study, best method to determine the item difficulties is obtained as Norm-Referenced Item Analysis as a consequence of taking both item discrimination and item difficulty into consideration. Another important thing is to make data nominal before trying to run any classification method on it. The further work to done on this research starts with questioning the size of item pool. Since the best method to find item difficulties is determined, both midterm and final exam data is going to be classified since they all differ in number of items. These items will be classified and the importance of the size of item pool will be tried to be determined by comparing the classification of items in different pools. REFERENCES [1] British Standards Institution (2001). New exam guidelines to stop the cybercheats [online]. Available: www.bsiglobal.com/Corporate/News+Room/exams.xalter [Accessed August 8, 2003]. [2] Mason, B. J., Patry, M., Bernstein, D. J. (2001). An examination of the equivalence between non adaptive computer based and traditional testing. Journal of Educational Computing Research, 24(1), 29–39. - 257 -
e-Learning’09 [3] De Angelis, S. (2000). Equivalency of computer-based and paper-and-pencil testing. Journal of Allied Health, 29(3), 161–164. [4] Pritchett, N. (1999). Effective question design. In S. Brown, P. Race, & J. Bull (Eds.), Computer-assisted assessment in higher education. London: Kogan Page. [5] Lilley, M., Barker, T., Britton, C., (2004). The development and evaluation of a software prototype for computer-adaptive testing. Computers & Education, 43, 109 – 123. [6] Lilley, M., Barker, T. (2002). The development and evaluation of a computeradaptive testing application for English language. In Proceedings of the 6th computerassisted assessment conference. Loughborough University, United Kingdom. [7] Lilley, M., Barker, T. (2003). An evaluation of a computer-adaptive test in a UK University context. In Proceedings of the 7th computer-assisted assessment conference. Loughborough University, United Kingdom. [8] Brown, J. D. (1995). Developing norm-referenced language tests for programlevel decision making. In J. D. Brown & S.O. Yamashita (Eds.). Language Testing in Japan (pp. 40-47). Tokyo: Japan Association for Language Teaching. [9] Hambleton, R. K., Swaminathan, H. (1985). Item response theory: Principles and applications. Boston: Kluwer-Nijhoff. [10] Hambleton, R. K. (2000). Emergence of item response modelling in instrument development and data analysis. Medical Care, 38 (9 Supplement), 60-65. ABOUT THE AUTHORS Dr. Dilek Karahoca, Department of Software Engineering, University of Bahcesehir, Phone: +90212 381 0567, Е-mail:
[email protected]. Assoc.Prof. Adem Karahoca, PhD, Department of Software Engineering, University of Bahcesehir, Phone: +90212 381 0560, Е-mail:
[email protected]. Betül Erdoğdu, Vocational School, Bahcesehir University Assoc.Prof.Dr. Hüseyin Uzunboylu, Department of Computer Education and Instructional Technologies, Near East University, Lefkosa, Northern Cyprus. Prof. Ali Güngör, PhD, Department of Computer Engineering, University of Bahcesehir, Phone: +90212 381 0555, Е-mail:
[email protected].
- 258 -