of adaptive systems, CAT systems analyze the behaviour of the user to build a .... Each node, Xi, is assigned a probability that represents an examinee's chances.
Computer Adaptive Testing: Comparison of a probabilistic network approach with Item Response Theory Michel C. Desmarais and Xiaoming Pu ´ Ecole Polytechnique de Montr´eal, Montr´eal, QC, Canada
Preliminary version. Accepted to User Modeling Conference, 2005. Abstract. Bayesian and probabilistic networks are claimed to offer powerful approaches to inferring an individual’s knowledge state from evidence of mastery of concepts or skills. A typical application where such tools can be useful is Computer Adaptive Testing (CAT). Bayesian networks have been proposed as an alternative to the traditional Item Response Theory (IRT), which has been the prevalent CAT approach for the last three decades. We review different Bayesian and probabilistic network approaches to modeling student ability assessment and compare the performance of one such approach, a probabilistic network approach named POKS, to the IRT two parameter logistic model. Experimental results over a 34 items UNIX test and a 160 items French language test show that both approaches can classify examinees as master or non master effectively and efficiently. Implications of these results for adaptive testing and student modeling are discussed. Keywords: CAT, IRT, Probabilistic networks, Bayesian networks, adaptive testing, student models, knowledge assessment
1
Introduction
Computer Adaptive Testing applications, or CAT, are possibly the earliest examples of adaptive interfaces. The principle behind CAT is to adjust the test items presented to the user’s knowledge, or, using CAT terminology, to adjust the items characteristics to the examinee’s ability level. Akin to the architectures of adaptive systems, CAT systems analyze the behaviour of the user to build a dynamic model of his/her knowledge state and choose the next item that is most appropriate for this state. In the specific context of CAT, the most appropriate items are the ones that will allow the system to determine, with the least number of test items administered, if the examinee is a “master” or a “non-master” with respect to the measured ability. We compare two approaches to CAT, namely the Item Response Theory framework (IRT), more specifically the two-parameter logistic model, and a “na¨ıve Bayes” framework named POKS [Desmarais et al., 1995]. The label “na¨ıve Bayes” stems from the assumption of local independence of network nodes relations. The POKS framework is particularly well suited for a comparison with
other CAT techniques, because, akin to the IRT framework, it does not require any knowledge engineering effort to build the network. Instead, it uses a small sample of test data to build automatically the links among the items themselves. We review the basis of each approach before describing the experimental procedure and results of their comparison.
2
Item Response theory
The prevalent means of conducting Computer Adaptive Testing (CAT) is based on the Item Response Theory (IRT), a framework introduced by [Birnbaum, 1968] and [Lord and Novick, 1968], and refined by a number of other researchers since its introduction (see [van der Linden and Hambleton, 1997]). For the current study, we adopted the two parameter logistic” model (IRT2PL) which is one of the common IRT models. The two parameters in question are item difficulty and discrimination, two parameters used in assessing the link between an examinee’s ability and his/her chances of mastering a test item. The 2PL model has two alternative models: the “1PL” model which drops the discrimination factor, and thus assumes equal discrimination across all items, and the “3PL” model which adds the additional “chance factor” parameter that accounts for lucky guesses. We chose the 2PL model because it generally brings significant improvements over the 1PL model, whereas the 3PL generally brings little improvement, especially since the chance factor is relatively low in our data. In the logistic IRT-2PL model, the probability of an examinee of ability level θ to answer item i correctly is: P (Xi | θ) =
1 1 + e−ai (θ−bi )
(1)
where Xi represents a correct response to item i (a shorthand for Xi = 1), bi is the item’s difficulty parameter, and ai is its discrimination parameter. This function defines what is known as the Item Characteristic Curve (ICC). Typically, the difficulty and discrimination parameters are estimated from empirical data by a maximum likelihood approach or by a least square fit. Estimating an examinee’s Q level of ability, θ, is based on maximizing the likek lihood function P (Xk | θ) = i=1 P (Xi |θ) where Xk is the vector of previous response values X1 , X2 , . . . , Xi , . . . , Xk . See [Baker, 1992] for a review of the different algorithms that are used for this estimation procedure.
3
Bayesian networks
Whereas IRT models are almost exclusively used for CAT, Bayesian Networks (BN) serve a wide range of applications and have received a wealth of attention in the research community in the last decade. BN are seen as a very promising field for practical applications [Na¨ım et al., 1992]. In the User Modeling community,
the application of BN to student modeling and CAT is much more recent than IRT, but it has generated significant interest. The Bayesian Networks framework allows the modeling of only the relevant conditional probabilities in a graphical form, namely a directed acyclic graph, and to propagate evidence using a sound mathematical scheme to update the probabilities upon the occurrence of an event in the network [Heckerman, 1995], albeit some assumptions are made to avoid the complexity of unconstrained BN which are NP-hard. For CAT and student modeling, the application of BN consists in modeling the conditional probabilities between test items themselves, or any other evidence of mastery, and/or between higher level concepts. One of the major advantages of BN over IRT is that the assessment of the probability of mastery to a test item does not rely on a single trait: the examinee’s ability level. It either relies on relationships among test items themselves, or, when the network includes concepts nodes, it relies on relations among them and among test items. High level concepts embedded in a BN constitute a powerful means of representing a variety of ability dimensions.
4
The POKS Bayesian network approach
The POKS approach is part of the “na¨ıve Bayes” family of BN: the induction of the BN and the probability updating scheme both assume the local independence of test items relations, that is, given the relations Xa → Xc and Xb → Xc , then P (Xa |Xc , Xb ) = P (Xa |Xc ) (see [Domingos and Pazzani, 1997]). This assumption has the major advantage of allowing the induction of the network from a very small number of data cases. In the current experiment, less than fifty data cases were used to build the two BNs. Whether local independence is a reasonable assumption is an empirical question that will be assessed and discussed further1 . 4.1
POKS network induction
A mentioned above, the POKS technique derives the BN structure from empirical data. The network content and induction technique is briefly reviewed here. Nodes For the purpose of comparing IRT and POKS, the nodes are limited to representing test items and no knowledge engineering is involved. There are no other types of node, and each node is a test item. This is not a limitation of the POKS approach itself, but a constraint imposed for this study in order to compare POKS on the same footing as IRT. Each node, Xi , is assigned a probability that represents an examinee’s chances of mastery of that item, P (Xi ). Contrary to the IRT model, P (Xi ) is not a function of θ, the ability level. It is a direct function of the probability of other items from which it is linked with, (see section 4.2). 1
Note that the local independence assumption is also an issue for IRT based CAT in general [Mislevy and Chang, 2000].
Network structure In accordance with the assumption of local independence, the network construction process consists in comparing items pairwise to look for a relation. Let Xa and Xb be two items in the item bank N . Then, to determine if there is a directed link, Xa → Xb , the three following conditions must hold: P ([P (Xb |Xa ) ≥ pc ] | D) > (1 − αc ) P ([P (¬Xa |¬Xb ) ≥ pc ] | D) > (1 − αc ) P (Xb |Xa ) 6= p(Xb )
(2) (3) (4)
where: pc is the minimal conditional probability for P (Xb |Xa ) and P (¬Xa |¬Xb ); a single value is chosen for the test of all relations in the network, generally 0.5; αc is the alpha error of the conditional probability tests (2 and 3); it determines the proportions of relations that can erroneously fall below pc ; common values range from 0.2 and 0.5. D is the joint frequency distribution of Xa and Xb in the model calibration sample. The first condition (inequality 2) states that the conditional probability of a success for Xb given a success for Xa must be above a minimal value, pc , and that we can derive such conclusion from a sample distribution, D, with an error rate no greater than αc . The second condition (inequality 3) is analogous to the first and states that the probability of failure for Xa given a failure for Xb must be greater than pc , with an error rate of αc given distribution D. These first two conditions are conditional probabilities that can be computed from a Binomial distribution. For example, in inequality 2, P ([P (Xb |Xa )]|D) is obtained by: P ([P (Xb |Xa )]|D) =
N a¬b X i=0
� � Na¬b [(Nab +Na¬b )−i] pc (1 − pic ) i
(5)
where Nab represents the frequency of combined success for Xa and Xb , for example. The third condition (inequality 4) is an independence test and it is verified by a χ2 distribution test on the 2 × 2 contingency table of distribution D. 4.2
Item probability update
When an item’s probability of mastery in the network changes, either through observation or through a change in the probability of a neighboring node, evidence is propagated through the connected items in the BN. If the probability increases, the update will follow links forward, whereas if the probability decreases, the update will follow links backward. Note that this is a departure from the standard Bayesian framework which would allow propagation in both directions and further investigation is required to verify if such strategy would improve performance.
When a node is observed, the neighboring nodes’ probability are updated through the standard Bayes posterior probability procedure. For propagating further, Giarratano’s algorithm is used ([Giarratano and Riley, 1998]), which corresponds to a proportional update of the originating node’s probability change. We refer the reader to [Desmarais et al., 1995] for the details.
5
Item selection and the Fisher information
Common to both the IRT and the BN approaches is the problem of choosing the next question to ask in order to minimize the number of questions asked. The Fisher information is the most common measure for this purpose [Birnbaum, 1968]. For the two parameter IRT model, it corresponds to: Ii (θ) = eai (θ−bi ) where a and b are respectively the item discrimination and difa2i [1+e ai (θ−bi ) ]2 ficulty parameters. In P POKS, θ is computed from the average probability of k
Pr (Xi )
i , where Pr (Xi ) is the estimated probability of success of all k items, k success of item i after r responses. For the IRT model, the value of θ is computed by a log-likelihood maximization procedure.
6
Experimental evaluation of the approaches
This section reports on the comparison of the IRT-2PL and POKS approaches to CAT. 6.1
Methodology
The performance comparison rests on the simulation of the adaptive question answering process. The answers given by the examinee during the simulation are based on the actual answers collected in the test data. An examinee is classified as master if his/her estimated ability, θ, above a given cutting score, θc , and non master otherwise. The classification by the IRT-2PL and POKS approaches after each item response given is then compared to the actual examinee score in the test data. Test data The simulations are made on two sets of data: (1) a 34 items test of the knowledge of UNIX shell commands administered to 48 examinee, and (2) a 160 items test of French language administered to 41 examinees. The first test was designed by the first author and it assesses a wide range of knowledge of the UNIX commands, from the simple knowledge of ‘cd’ to change directory, to the knowledge of specialized maintenance commands and data processing (eg. ‘awk’, ‘sed’). The second was provided by Formation Linguistique Canada. It is designed by professionals and covers many aspects of language and a wide range of language skills. Mean scores for the UNIX and French language tests are respectively 53% and 57%, and standard deviation is about 0.5 for both.
To avoid over-calibration, all of the models’ parameters are calibrated on N − 1 data cases: we remove from the data set the examinee for which we conduct the simulation. Parameters estimation The discrimination and difficulty (respectively parameters a and b in equation 1) were estimated with a maximum log-likelihood estimator package of the R general purpose statistical analysis software [Venables et al., 2004] over the two data sets. These same parameters are also for computing the Fisher information (section 5) for both the POKS and the IRT-2PL approaches. BN structures and statistics Statistics on the network structures inferred are given in table 1. Note that a number of symmetric relations (within parenthesis) occur when two test items are similar to one another, in which case we obtain P (Xa |Xb ) ≈ P (Xb |Xa ) ≈ 1 and which results in a → b and b → a. The propagation algorithm deals with symmetric relations by stopping propagation once a node has already been updated with a given evidence. Table 1. BN networks statistics averaged over all N − 1 structures.
Number of nodes Number of relations (symmetric relations) αc pc
Unix
French language
34 587 (126) 0.25 0.5
160 1160 (65) 0.05 0.5
Performance metrics Measuring the performance of each approach is based on a simple metric: the proportion of correctly classified examinees after each number of responses to test items. Classification of a single examinee is determined by comparing the examinee’s estimated score, S (equation 6 below), with the passing score, θc . The examinee’s estimated score is computed from the following equation: Pn Pr Xi ∈Tg P (Xi ) + Xj ∈Tr P (Xj ) S= (6) n where Tg is the set of given item responses (items already answered), and Tr are the remaining items for which an estimation of the chances of success is calculated. P (Xi ) is 1 if the corresponding response to item i is a success and 0
otherwise, and P (Xj ) is the estimated probability of success with the respective method used, BN-POKS or IRT-2PL. The estimated score is thus a weighted sum of the items already observed and the estimated score for the remaining items. Once all items are observed, Tr will be empty and the result will always be 100% correct since observed items correspond to the “true” ability in this framework. Recall that in the IRT 2PL model, the probability of success to an item is given by equation 1, whereas in POKS it is computed through the propagation of evidence as explained in section 4.2. 6.2
Results
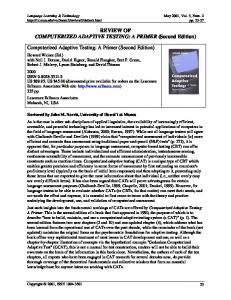
The simulation results for the cutting score θc = 60% are summarized in figure 1. They show the number of correctly classified examinees as a function of the number of items asked.
Fig. 1. Results from the Unix (left) and French language (right) tests comprised respectively of 48 and 160 items. The percentage of correctly classified examinees, averaged over 48 simulation cases for the Unix test and 41 for the French language one (Flc), are plotted as a function of the number of item responses. Passing score is 60%.
The simulation shows that the POKS approach performs sightly better than the IRT-2PL approach and that the gain is more important for the FLC test than the UNIX one. In general, both BN-POKS and IRT-2PL approaches yield relatively good classification after only a few item responses, especially considering the low number of data cases used for calibration. In the UNIX test, all approaches reach more than 90% correctly classified between 5 and 10 item responses. However, for the French language test, only the POKS approach stays
above 90% correct classification after less than 10 items, whereas the IRT approach requires about half of the 160 test items to reach and stay above the 90% score.
7
Related Work
Vanlenh, Martin and Conati have been amongst the most early and active users of BN for student assessment. In the latest of a series of three tutors embedding a BN, the Andes tutor [Conati et al., 2002] incorporates a BN composed of a number of different types of nodes (rules, context-rules, fact, goal nodes). Each node can take a value of “mastered” or “non-mastered” with a given probability. Probabilities can be computed from Bayes posterior probability rule, or in a deterministic binary form (eg. P (X = 1) ⇒ P (Y = 1)), or using leaky-or and noisy-and relations with an arbitrary amount of a noise factor that makes these relations non deterministic [Neapolitan, 1998]. Most conditional probabilities in the network are subjectively assessed. In Hydrive, [Mislevy and Gitomer, 1995] used a BN for assessing a student’s competence at troubleshooting an aircraft hydrolics system. The BN is also engineered through careful modeling of the domain knowledge in a hierarchy of abilities. Node categories are not binary, as each node has its own set of values such as {expert,good,ok,weak}. Conditional probabilities are first posited by expert judgment and further refined with a data set of 40 subjects. The work of [Collins et al., 1996] is among the first to specifically create a CAT with a Bayesian network. They use the notion of granularity hierarchies to define the BN. Granularity hierarchies are essentially aggregations of concepts or skills into a hierarchy, akin to [Mislevy and Gitomer, 1995], where the leaves are test items and the root represents the whole subject domain. The BN tested are knowledge engineered from expert knowledge and different topologies are compared. Since the system is a CAT, the choice of the next item is adapted to optimize ability assessment. It is based on a utility measure that yields the item with highest discrimination factor, that is, the item for which the difference in ability estimate, P (θ|Xi ), is the highest between a correct and an incorrect answer. In a more recent CAT system, [Mill´an and P´erez-de-la-Cruz, 2002] defined a hierarchical BN with three layers: concepts, topics, and subjects. A fourth layer links test items to concepts. They used different means of computing the updated probabilities according to the layer. The higher layers use a summative formula to yield an updated probability. New probabilities are a function of weights assigned to evidence nodes according to their importance, which can be a factor of time devoted to a certain topic in a course, for example. At the lower level, the probabilities that a concept is mastered is a function of test items. That probability is computed with an adapted ICC function such as the one in equation 1. They tested the accuracy of their approach with simulated students and a test of 60 questions and found a relatively good performance for assessing each of 17 different concepts with error rates varying from 3% to 10%.
In contrast with the previous approaches, [Vomlel, 2004] has conducted experiments with empirically derived BN. This work is, to our knowledge and besides our own investigation, the only one using empirical data to construct the BN’s topology, although it does involve some knowledge engineering effort for categorizing concepts and test items into a hierarchy. Vomlel used HUGIN’s PC algorithm [Jensen et al., 2002] to calibrate a number of network topologies from 149 data cases for a 20 questions arithmetic tests administered to high school students. The basic topology of the network was constrained based on a knowledge engineering of the domain with experts, but HUGIN was used to refine or define parts of the BN’s structure. The BN was composed of a few skills and student misconceptions. Conditional probabilities were all calibrated from empirical data. The results show that an adaptive test with such BN can correctly identify the skills with an accuracy of approximately 90% after the 9th question and performs significantly better than a fixed question order test.
8
Discussion
The comparison of the BN-POKS approach with the IRT-2PL one shows that they both can perform correct classification of examinees and that the POKS approach enjoys a slight advantage over IRT. This comparison is interesting for its strong equivalence conditions. Indeed, the specific POKS approach uses the same data as the IRT-2PL approach and requires no knowledge engineering step, akin to the IRT technique. It shows that a BN can be induced from the same data as an IRT model and can yield comparable results. Moreover, the approaches were tested with very few data cases, and yet, their performance is quite valuable. This is an important feature from a practical perspective since it makes them beneficial to a large number of application contexts. The POKS and BN approaches are still in their infancy compared to the IRT techniques developed since the 1960’s, and their potential benefit remains relatively unexplored. One of their advantages lies in allowing better performance over multidimensional tests. Moreover, although this study emphasized the advantage of using the POKS approach, which does not require human intervention, a knowledge engineered BN can have its advantages. The possibility of structuring a BN with concepts, misconceptions, or any other cognitively relevant element is an advantage that stems from the high representational flexibility of BN. Combining POKS with such features could offer interesting possibilities. An example application where the advantages of a CAT system based such a combination of knowledge engineered BN and POKS would prove useful is for a Study Guide application which we are currently investigating The purpose of the Guide is to quickly determine, with very few questions, what topics the student should spend time on, and which topics can be considered mastered. It is essential that few questions be asked in order to recommend study topics, since a long test session would be annoying, particularly given that we want the student to regularly check his progress. In addition to usability issues, short tests are essential to avoid building a large item pool.
References [Baker, 1992] Baker, F. B. (1992). Item Response Theory Parameter Estimation Techniques. Marcel Dekker Inc., New York, NY. [Birnbaum, 1968] Birnbaum, A. (1968). Some latent trait models and their use in infering an examinee’s ability. In Lord, F. and Novick, M., editors, Statistical Theories of Mental Test Scores, pages 397–472. Addison-Wesley, Reading, MA. [Collins et al., 1996] Collins, J. A., Greer, J. E., and Huang, S. X. (1996). Adaptive assessment using granularity hierarchies and bayesian nets. In Intelligent Tutoring Systems, pages 569–577. [Conati et al., 2002] Conati, C., Gertner, A., and VanLehn, K. (2002). Using bayesian networks to manage uncertainty in student modeling. User Modeling and UserAdapted Interaction, 12(4):371–417. [Desmarais et al., 1995] Desmarais, M. C., Maluf, A., and Liu, J. (1995). Userexpertise modeling with empirically derived probabilistic implication networks. User Modeling and User-Adapted Interaction, 5(3-4):283–315. [Domingos and Pazzani, 1997] Domingos, P. and Pazzani, M. (1997). On the optimality of the simple bayesian classifier under zero-one loss. Machine Learning, 29:103– 130. [Giarratano and Riley, 1998] Giarratano, J. and Riley, G. (1998). Expert Systems: Principles and Programming (3rd edition). PWS-KENT Publishing, Boston, MA. [Heckerman, 1995] Heckerman, D. (1995). A tutorial on learning with bayesian networks. Technical Report MSR-TR-95-06, Microsoft Research (MSR). [Jensen et al., 2002] Jensen, F., Kjærul, U. B., Lang, M., and Madsen, A. L. (2002). Hugin - the tool for bayesian networks and influence diagrams. In G´ amez, J. A. and Salmeron, A., editors, Proceedings of the First European Workshop on Probabilistic Graphical Models, PGM 2002, pages 211–221. [Lord and Novick, 1968] Lord, F. M. and Novick, M. R., editors (1968). Statistical Theories of Mental Test Scores. Addison-Weslay, Reading, MA. [Mill´ an and P´erez-de-la-Cruz, 2002] Mill´ an, E. and P´erez-de-la-Cruz, J. L. (2002). A bayesian diagnostic algorithm for student modeling and its evaluation. User Modeling and User-Adapted Interaction, 12(2–3):281–330,. [Mislevy and Chang, 2000] Mislevy, R. and Chang, H. (2000). Does adaptive testing violate local independence? Psychometrika, 65:149–156. [Mislevy and Gitomer, 1995] Mislevy, R. J. and Gitomer, D. (1995). The role of probability-based inference in an intelligent tutoring system. User Modeling and User-Adapted Interaction, 42(5):253–282. [Na¨ım et al., 1992] Na¨ım, P., Wuillemin, P.-H., Leray, P., Pourret, O., and Becker, A. (1992). R´eseaux bay´esiens. Eyrolles, Paris. [Neapolitan, 1998] Neapolitan, R. E. (1998). Probabilistic Reasoning in Expert Systems: Theory and Algorithms. John Wiley & Sons, Inc., New York. [van der Linden and Hambleton, 1997] van der Linden, W. J. and Hambleton, R. K., editors (1997). Handbook of Modern Item Response Theory. Springer-Verlag. [Venables et al., 2004] Venables, W. N., Smith, D. M., and the R Development Core Team (2004). An introduction to r, notes on r: A programming environment for data analysis and graphics. Technical report, R Project. [Vomlel, 2004] Vomlel, J. (2004). Bayesian networks in educational testing. International Journal of Uncertainty, Fuzziness and Knowledge Based Systems, 12(Supplementary Issue 1):83–100.