Subjective image quality data for 9 image processing pipes and 8 image contents (taken with mobile phone camera, 72 natural scene test images altogether) ...
Evaluation of the visual performance of image processing pipes: information value of subjective image attributes G Nymana, J Häkkinena,b,c, E-M Koivistoa, T Leistia, P Lindroosa, O Orenius,a T Virtanena, T Vuorib a
Department of Psychology, University of Helsinki, P.O. Box 9, 00014 Helsinki, Finland; b Nokia Research Center, P.O.Box 407, 00045 Nokia Group, Finland; c Laboratory of Media Technology, Helsinki University of Technology, P.O Box 500 02015 TKK, Finland ABSTRACT Subjective image quality data for 9 image processing pipes and 8 image contents (taken with mobile phone camera, 72 natural scene test images altogether) from 14 test subjects were collected. A triplet comparison setup and a hybrid qualitative/quantitative methodology1 were applied. MOS data and spontaneous, subjective image quality attributes to each test image were recorded. The use of positive and negative image quality attributes by the experimental subjects suggested a significant difference between the subjective spaces of low and high image quality. The robustness of the attribute data was shown by correlating DMOS data of the test images against their corresponding, average subjective attribute vector length data. The findings demonstrate the information value of spontaneous, subjective image quality attributes in evaluating image quality at variable quality levels. We discuss the implications of these findings for the development of sensitive performance measures and methods in profiling image processing systems and their components, especially at high image quality levels. Keywords: Image processing pipes, mobile phone camera, subjective image quality, experience, decision making
1. INTRODUCTION Image quality of mobile devices improves fast and it is necessary to optimize the performance of digital image processing components that critically affect camera performance2. Standard methods have been developed 3,4 but at the moment, there is no unique objective and automatic measurement methodology that would match the visual performance of the end-user. In fact, this remains a distant aim, especially in the case of high-quality imaging, that is already an essential aspect of mobile imaging. Because of this, subjective evaluation methods are needed for measuring the image quality contribution of image processing components. Very little help can be expected from the present visual system theory since it does not, as of yet, match the needs of high quality imaging1. Hence, we have chosen to study how human observers spontaneously evaluate high image quality, how this could best be measured and in the end, how to support the building of models for the purpose of automatic and “objective” image quality measurements. 1.1 The process of quality perception Here we consider image quality evaluation by the end-user as a spontaneous decision making process3 that is based on a complex perceptual, cognitive, and emotional analysis of the image and its content. It is a multidimensional and inherently private process in nature, and it is not possible to define a fixed set of image quality scales that would cover all relevant aspects of subjective quality that an observer might experience when viewing high-quality test images.
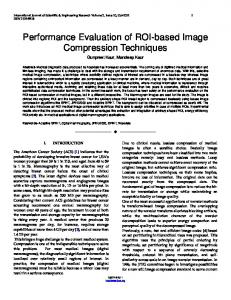
Figure 1. Main components of the subjective image quality decision process.
The image quality experience process can be characterized as follows: 1.
2. 3.
Each perceived image (content) becomes perceptually, cognitively, and emotionally interpreted somehow (e.g. visual segregation of image element and objects; memory-based object recognition; multi-level subjective meanings and implications, a compound of bottom-up/top-down processing)1. This is a private process. When faced with an image quality evaluation task, the subject undergoes an internal quality decision process (QD) that has multiple decision criteria that are dependent both on the image content and its quality level. This involves both bottom-up and top-down processing. It is not possible to observe QD directly and even the subjects themselves cannot analyze this internal process accurately. However, valuable and systematic, but indirect information can be obtained: knowledge of these multiple decision criteria (and the underlying individual decision space) can be gained when the subjects explain, why they have given a specific image quality score to a test image. This information is represented, in the subjects’ own language, and in the form of subjective image attributes that they can spontaneously express (e.g. sharp, warm, natural, pale) to the experimenter. In a sense, the subjects participating in an image quality evaluation task must compress their internal perceptual and experiential space into a dimensionally sparse and transformed decision space that is cognitively economical to use when discussing and rating the quality of test images. When a subject
4.
describes his/her quality score, by using a spontaneous attribute like “natural”, he/she reveals something of the decision dimensions and the criteria that he/she has applied in his/her personal decision space. All subjective image quality attributes, even those that appear most direct and physical in nature (e.g. sharp, good contrast, bright pure colors), have this cognitive property. By analyzing the attribute set obtained from the test subjects, in controlled conditions, it is possible to reveal and perhaps model these complex subjective decision phenomena.
Figure 1 summarizes the nature of this complex, interactive and multi-level subjective process. Accordingly, we have here conducted experiments where the subjects were asked to rate the image quality of images that have been processed through different image pipes, and to express their arguments (in the form of spontaneous, subjective quality attributes) for giving a specific quality score to each image. By looking at the relationship between image quality scores and the attribute distributions we hope to gain information of the performance of the image processing pipes and also of how the subjects arrive at the decisions concerning the image quality. We have earlier reported applications of this method (IBQ, Interpretation based quality) to image quality analysis of digital and printed images1,2,6,7,8 .
2. METHODS 2.1 Materials Natural image contents were used as stimuli. They were taken with a 5 megapixel mobile phone camera and they represent a wide range of everyday photographic situations. I3A standards were used as guidelines in selecting the test materials. In the experiments, the test images were presented as triplets that were shown in a random order. Altogether 96 triplets were shown on the three Eizo ColorEdge CG241W display set-up. The picture dimensions were 1920x1200, and the viewing angle from a viewing distance of about 1 meter was approximately 40 deg x 25 deg. The room illumination was set to approximately 20 lx on the desk surface and the environment was covered with medium gray curtains. In order to test the Image Signal Processor pipes (ISPs), the RAW image database was collected. The natural image contents were captured with a commercial 5 megapixel mobile phone camera with LED flash. Only addition to the commercial version was the RAW image output to get the raw image database. The RAW image database was used to run the Image Signal Processor pipes afterwards to obtain each set of images for each processor pipe. Only the automatic exposure algorithm was the same in all test pictures. Altogether 9 different pipes were applied. Most of the pipes were mobile compatible, so they needed to fulfill the mobile requirements of processing power and time etc. There were both software (SW) and hardware (HW) pipes included, and also pipes of both SW and HW. The test image content types could be classified as follows: 3 dark images: Bar (faces), Cathedral, Person (“Pena”); 3 light images: Children, Cherry tree, Cars; 2 Gray images: Beach, Restaurant. Of the test images, 6 were taken outdoors (Person, Cars, Cherry tree, Cathedral, Children, Beach) and two inside (Bar, Restaurant). 2.2. Image quality evaluation procedure Subjective image quality data for 9 image processing pipes and 8 contents (72 images altogether) were measured using qualitative/quantitative methodology1,2,6,10 . Triplet comparison was applied (ISO 20462-2) in which the subject gave to each image in the triplet comparison situation, a quality score on the scale 0-100, and then also expressed his/her reasons for giving this score by writing down the relevant attributes for each triplet image. The subjects were instructed to use their own, spontaneous words and expressions to describe the test images. They used plus and minus signs to indicate whether they used the expressions in a positive or negative sense. Each picture was viewed 4 times in this process, and each time, according to the randomizing, in a different triplet. The subjects were instructed to use the scale value “50” as the criteria for acceptable quality. Data from 14 observers are presented. 2.3 Observers Observers were invited from a panel of students who had participated in an introduction session, where the image quality of everyday photographs (not the actual test stimuli) were discussed. This was done in order to facilitate the use of subjective concepts and language related to such stimuli. No direct suggestions were offered
to them, and the panelists were free to discuss openly the quality impressions of the material that was presented. The observers were required not to be professionals on image quality estimation and not doing image quality estimation or image processing as a professional-like hobby. The observers had to be Finnish speaking. Their vision was controlled for the near visual acuity, near contrast vision (near F.A.C.T.) and color vision (Farnsworth D15) before the participation.
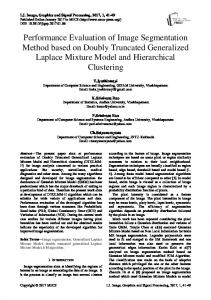
3. RESULTS 3.1 MOS data and overall performance of the pipes Figure 2 shows the distribution of MOS data calculated over all subjects, test images and pipes. The subjects used the scale rather well, peaking close at “50” which they were instructed to use as the threshold value for subjectively acceptable image quality.
Figure 2. Distribution of image quality scores in the whole material. The distribution is close to normal although it did not pass the Shapiro-Wilk’s test of normality.
Figure 3 shows the average image quality data (MOS) for all nine pipes (numbered from 1 to 9) studied. There were rather large differences between the best and worst performing pipes, having the average MOS scores of 59,3 and 41,8, respectively. When arranged in the order of average performance score from worst to best, it was noticed that of the adjoining pipes, only pipes 1 and 9 were statistically significantly different (p