Proceedings of the World Congress on Engineering 2008 Vol II WCE 2008, July 2 - 4, 2008, London, U.K.
Evolutionary Methods for Multi-Objective Portfolio Optimization I. Radziukynienė, A. Žilinskas
Abstract—Four multi-objective evolutionary optimization algorithms are discussed with respect to their efficiency in portfolio optimization problems. The assessment of the advantages and disadvantages of the considered algorithms is based on experimental study where two and three criteria portfolio optimization problems were used as tests. The performance of considered algorithms are presented and compared in different metrics. Index Terms—heuristic algorithms, optimization, portfolio selection.
multi-objective
I. INTRODUCTION Optimization methods have a long history in many financial domains, because optimization models play an increasingly important role in financial decisions. Many computational finance problems ranging from asset allocation to risk management, from option pricing to model calibration can be solved efficiently using modern optimization techniques. The question of optimal portfolio allocation has been of long-standing interest for academics and practitioners in finance. In 1950s Harry Markowitz published his pioneering work where he has proposed a simple quadratic program for selecting a diversified portfolio of securities [1]. His model for portfolio selection can be formulated mathematically either as a problem of maximization of expected return where risk, defined as variance of return, is (upper) bounded or as a problem of minimization of risk where expected return is (lower) bounded. The classical approach to portfolio selection reduces the problem of two criteria optimization to a one criterion optimization where the second criterion is converted to a constraint. Reduction of a multi-criteria problem to one criterion problem not always is the best method to solve multi-criteria problems, especially in the case when number of criteria is larger than two. In this paper we investigate efficiency of evolutionary multi-criteria optimization algorithms in problems of portfolio selection. For experimental comparison we have chosen four algorithms well assessed in recent publications. We were especially interested whether rankings of algorithms are different for problems with two and three criteria. This paper is organized as follows. In section 2 the multi-objective portfolio optimization problem is outlined, section 3 describes the selected optimization methods and their characteristics. In Manuscript received March 21, 2008. I. Radziukynienė is with the Faculty of Informatics, Vytautas Magnus University, Kaunas, Lithuania (e-mail:
[email protected]). A. Žilinskas is with the Optimization Sector at Systems Analysis Department, Institute of Mathematics and Informatics, Vilnius, Lithuania (e-mail:
[email protected]).
ISBN:978-988-17012-3-7
section 4 and 5 we discuss used performance metrics and obtained results. Section 6 draws conclusions. II. MULTI-OBJECTIVE PORTFOLIO OPTIMIZATION PROBLEM Many real world decision making problems have several, often conflicting, objectives, and can be reduced to multi-criteria optimization. There are many methods to attack multi-criteria optimization problems. In most cases the aimed result is a set of Pareto optimal solutions. However, the theoretical problem to find the whole Pareto set normally (e.g. in case of continuum cardinality of Pareto set) can not be solved algorithmically, thus the problem is reformulated to algorithmic construction of an appropriate approximation of Pareto sets. Over the past decades evolutionary algorithms have received much attention owing to its intrinsic ability to handle optimization problems with both single and multiple objectives including problems of financial optimization [2-6]. An alternative, known as simulated annealing, was discussed in [3]. Tabu search approaches [7] compose the third major class of heuristic procedures for multi-objective optimization problems. Comparisons of the performance of different heuristic techniques applied to solve one criterion portfolio choice problems are given by Chang et al. [3]. However, to the best knowledge of the authors’ similar comparative analysis of performance of recently proposed evolutionary multi-criteria algorithms has not been yet reported. Risk plays an important role in modern finance, including risk management, capital asset pricing and portfolio optimization. The purpose of portfolio selection is to find an optimal strategy for allocating wealth among a number of securities (investment) and to obtain an optimal risk-return trade-off. The portfolio optimization problem may be formulated in various ways depending on the selection of the objective functions, the definition of the decision variables, and the particular constraints underlying the specific situation. Beyond the expected return and variance of return, like in Markowitz portfolio model [1], the additional objective function can include number of securities in a portfolio, turnover, amount of short selling, dividend, liquidity, excess return over of a benchmark random variable and other [8]. In the bank portfolio management, the additional criteria such as the prime rate, processing cost, expected default rate, probability of unexpected losses, quantity of the long-term and short-term can be considered [9]. For example, the multi-objective portfolio selection problem can include the following objectives [10]: (to be maximized) portfolio return, dividend, growth in sales, liquidity, portfolio return over that of a benchmark, and (to be minimized) deviations from asset allocation percentages,
WCE 2008
Proceedings of the World Congress on Engineering 2008 Vol II WCE 2008, July 2 - 4, 2008, London, U.K. number of securities in portfolio, turnover (i.e., costs of adjustment), maximum investment proportion weight, amount of short selling. We considered two multi-objective portfolio problems. The first problem was based on a simple two objectives portfolio model including the standard deviation of the returns and mean of the returns, where the return Ri is one month return of stock i; return means percentage change in value. The second problem included three objectives; where annual dividend yield is added to two above mentioned objectives.hen you submit your final version, after your paper has been accepted, prepare it in two-column format, including figures and tables.
III. JUSTIFICATION OF SELECTION OF ALGORITHM A. FastPGA Eskandari and Geiger [11] have proposed framework named fast Pareto genetic algorithm that incorporates a new fitness assignment and solution ranking strategy for multi-objective optimization problems where each solution evaluation is relatively computationally expensive. The new ranking strategy is based on the classification of solution into two different categories according to dominance. The fitness of non-dominated solutions in the first rank is calculated by comparing each non-dominated solution with one another and assigning a fitness value computed using crowding distance. Each dominated solution in the second rank is assigned a fitness value taking into account the number of both dominating and dominated solutions. New search operators are introduced to improve the proposed algorithm’s convergence behaviour and to reduce the required computational effort. A population regulation operator is introduced to dynamically adapt the population size as needed up to a user-specified maximum population size, which is the size of the set of non-dominated solutions. FastPGA is capable of saving a significant number of solution evaluations early in the search and utilizes exploitation in a more efficient manner at later generations. Characteristics: • The regulation operator employed in FastPGA improves its performance for fast convergence, proximity to the Pareto optimal front, and solution diversity maintenance. B. MOCeLL Nebro et al [12] presented MOCeLL, a multi-objective algorithm based on cellular model of GAs, where the concept of small neighborhood is intensively used, i.e., population member may only interact with its nearby neighbors in the breeding loop. MOCell uses an external archive to store the non-dominated solutions found during the execution of the algorithm, however, the main feature characterizing MOCell is that a number of solutions are moved back into the population from the archive, replacing randomly selected existing population members. This is carried out with the hope of taking advantage of the search experience in order to find a Pareto front with good convergence and spread. MOCell starts by creating an empty Pareto front. The Pareto front is just an additional population (the external archive) composed of a number of the non-dominated
ISBN:978-988-17012-3-7
solutions found. Population members are arranged in a 2-dimensional toroidal grid, and the genetic operators are successively applied to them until the termination condition is met. Hence, for each population member, the algorithm consists of selecting two parents from its neighbourhood, recombining them in order to obtain an offspring, mutating it, evaluating the resulting population member, and inserting it in both the auxiliary population (if it is not dominated by the current population member) and the Pareto front. Finally, after each generation, the old population is replaced by the auxiliary one, and a feedback procedure is invoked to replace a fixed number of randomly chosen population members of the population by solutions from the archive. In order to manage the insertion of solutions in the Pareto front with the goal to obtain a diverse set, a density estimator based on the crowding distance has been used. This measure is also used to remove solutions from the archive when this becomes full. Characteristics: • The algorithm uses an external archive to store the non-dominated population members found during the search. • The most salient feature of MOCeLL with respect to the other cellular approaches for multi-objective optimization is the feedback of members from archive to population. C. AbYSS AbYSS was introduced by Nebro et al [13]. It is based on the scatter search using a small population, known as the reference set, whose population members are combined to construct new solutions. Furthermore, these new population members can be improved by applying a local search method. For local search the authors proposed to use a simple (1+1) Evolution Strategy which is based on a mutation operator and a Pareto dominance test. The reference set is initialized from an initial population composed of disperse solutions, and it is updated by taking into account the solutions resulting from the local search improvement. AbYSS combines ideas of three state-of-the-art evolutionary algorithms for multi criteria optimization. On the one hand, an external archive is used to store the non-dominated solutions found during the search, following the scheme applied by Pareto-archived Evolutionary Strategy (PAES) [14], but using the crowding distance of NSGA-II [15] as a niching measure instead of the adaptive grid used by PAES; on the other hand, the selection of solutions from the initial set to build the reference set applies the density estimation used by Strength Pareto Evolutionary Algorithm 2 (SPEA2) [13]. Characteristics: • It uses an external archive to store the non-dominated population members found during the search. • Salient features of AbYSS are the feedback of population members from the archive to the initial set in the restart phase of the scatter search, as well
WCE 2008
Proceedings of the World Congress on Engineering 2008 Vol II WCE 2008, July 2 - 4, 2008, London, U.K.
as the combination of two different density
estimators in different parts of the search.
D. NSGA-II The evolutionary algorithm for multi-criteria optimization NGSA-II contains three main operators: a non-dominated sorting, density estimation, and a crowded comparison [15]. Starting from a random population the mentioned operators govern evolution whose aim is uniform covering of Pareto set. Non-dominated sorting maintains a population of non dominated members: if a descendant is dominated, it immediately dies, otherwise it becomes a member of population; all members of parent generation who are dominated by descendants die. The density at the particular point is measured as the average distance between the considered point and two points representing the neighbour (left and right) population members. The crowded comparison operator ( p n ) defines selection for crossover oriented to increase the spread of current approximation of Pareto front. Population members are ranked taking into account “seniority” (generation number) and local crowding distance. The worst-case complexity of NSGA-II algorithm is O(mN2), where N is the population size and m is the number of objectives [15]. Characteristics: • Non-dominated sorting algorithm is of the lower computational complexity than that of its predecessor NSGA. • Elitism is maintained. • No sharing parameter needs to be chosen because sharing is replaced by crowded-comparison to reduce computations. IV. DESIGN OF EXPERIMENT For assessing of the considered algorithms several different performance measures can be taken into account: the distance between the approximated Pareto front generated by the considered algorithm and the true Pareto front, the spread of the solutions, and computational time. To determine the first measure the true Pareto front should be known. In this investigation we didn’t know true Pareto fronts. Therefore, the best approximation found by means of combining results of all considered algorithms was used instead of true Pareto front. We compared algorithms according to five performance measures: 1) Generational distance (GD) shows how far the approximation is from the true Pareto front [13]. A value of GD equal zero indicates that all the generated elements are on the true Pareto front.
ISBN:978-988-17012-3-7
2) Inverted generational distance (IGD) [16]. This quality indicator is used to measure how far the elements are in the Pareto optimal set from those in the set of non-dominated vectors found. A value of IGD equal zero indicates that all the generated elements are in the Pareto front and they cover all the extension of the Pareto front. 3) Hypervolume (HV) [13]. This quality indicator calculates the volume (in the objective space) covered by members of a non-dominated set of solutions for problems where all objectives are to be minimized. Algorithms with larger values of HV are desirable. 4) Spread [13]. The Spread indicator is a diversity metric that measures the extent of spread achieved among the obtained solutions. This metric takes a zero value for an ideal distribution, pointing out a perfect spread out of the solutions in the Pareto front. 5) Computational time. For the experiment we used a dataset of 10 Lithuanian companies’ stock data from Lithuanian market. Before evaluating the fitness function, the proportions of stocks in the portfolio were normalized as in reference [9]. FastPGA, MOCELL, AbYSS, and NSGAII were run with different parameters that were recommended by the authors [11]–[13], [15]. They are given in Table I. TABLE I
ALGORITHM PARAMETERS Algorithm FastPGA MOCeLL AbYSS NSGAII
Parameters Maximum population = 100, initial population = 100, crossover probability = 1.0 Population = 100, archive = 100, crossover probability = 0.9 Population = 20, archive = 100, crossover probability = 1.0, setref1=10, setref2=10 Population = 100, crossover probability = 0.9
V. DISCUSSION OF EXPERIMENTAL RESULTS To evaluate each algorithm, while solving two objectives portfolio optimization problem we performed three series of experiments. First, we ran all the approaches for 15000 function evaluations, and then repeated them with the execution of 25000 and 35000 function evaluations as the stopping condition. In the case of three objectives portfolio, two series of experiments with 25000 and 50000 function evaluations have been performed. For each problem we have executed 50 independent runs. The experimental results of two objectives problem, i.e. the averages and standard deviations of all metrics, are given in Table II. The results of two objectives portfolio optimization problem reveals that MOCeLL outperforms other algorithms considering when using 15000 and 25000 function evaluations according to Spread metric, and it obtains competitive fronts concerning both Generational Distance and Hypervolume metrics. In the case of 35000 function evaluations, there is not one best performer, because according to Generational Distance, Inverted Generational Distance, and Hypervolume indicators the best optimizer is MOCeLL; according Spread metric and consumed time for solving the problem the best optimizer is AbYSS. It can be
WCE 2008
Proceedings of the World Congress on Engineering 2008 Vol II WCE 2008, July 2 - 4, 2008, London, U.K.
noticed that the differences in average and standard deviation
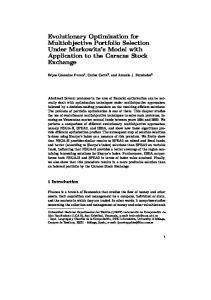
values of both the generational distance and inverted generational distance are in general noticeable compared to the rest of algorithms. In all cases, AbYSS requires less time then other algorithms. The Pareto frontier that was formed by using all obtained frontiers of bi-objective problem and efficient frontiers of each algorithm when using 25000 function evaluations are presented in Fig. 1-4. The results of three objectives problem are given in Table III. The obtained results show that the best performer
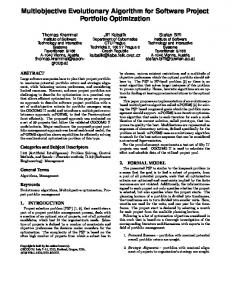
according all metrics excluding the computational time is MOCeLL. NSGAII is the best algorithm in respect with time consumed for computation. It can be noted that in all performed experiments FastPGA requires significantly more computational time than other algorithms. From these results it can be seen that quality of MOCeLL efficient frontier is comparably higher than ones of FastPGA and NSGAII. The efficient front obtained by MOCeLL with 50000 function evaluations is presented in Fig. 5.
TABLE II
PERFORMANCE METRICS OF TWO OBJECTIVES PORTFOLIO PROBLEM Algorithm
GD Avg.
Std.
AbYSS FastPGA MOCeLL NSGAII
5.452E-4 4.107E-4 3.084E-4 4.156E-4
4.09E-4 2.81E-4 2.32E-4 2.76E-4
AbYSS FastPGA MOCeLL NSGAII
2.035E-4 2.241E-4 9.02E-5 2.334E-4
5.96E-5 7.06E-5 1.9E-5 2.88E-5
AbYSS FastPGA MOCeLL NSGAII
1.609E-4 2.087E-4 6.06E-5 2.396E-4
3.58E-5 2.74E-5 9E-6 3.02E-5
IGD HV Avg. Std. Avg. Std. Maximum number of evaluations is 15000 1.794E-3 2.067E-3 0.8552 0.0331 2.197E-3 1.579E-3 0.8563 0.0238 1.595E-3 0.0212 1.181E-3 0.8696 1.347E-3 0.001192 0.8694 0.0141 Maximum number of evaluations is 25000 1.55E-4 5.386E-4 0.882 0.0055 4.70E-4 9.419E-4 0.8786 0.0126 1.08E-4 2.802E-4 0.0019 0.8836 1.2E-5 0.8823 0.0003 9.7E-5 Maximum number of evaluations is 35000 7.1E-5 2.4E-6 0.8834 3.2-E4 1.02E-4 1.106E-4 0.8827 4.7-E4 8E-7 8.5-E5 6.6E-5 0.8843 9.5E-5 4E-6 0.8824 1.8-E4
Spread Avg. Std.
Time, ms Avg. Std.
0.470 0.597 0.439 0.560
0.182 0.112 0.140 0.107
1414.9 6321.5 2326.9 1898.2
90.51 145.37 77.965 105.04
0.2553 0.4291 0.2501 0.4366
0.064 0.0832 0.0379 0.0286
2490.3 10390 3900.1 2965.6
140.7 42.48 61.06 34.22
0.2283 0.3804 0.2407 0.4344
0.0171 0.0354 0.0168 0.0297
3698.1 15959 5505 4493.9
187.48 1418.5 65.78 247.17
TABLE III
PERFORMANCE METRICS OF THREE OBJECTIVES PORTFOLIO PROBLEM Algorithm
GD Avg.
Std.
AbYSS FastPGA MOCeLL NSGAII
1.091E-3 1.052E-3 8.466E-4 1.031E-3
3.76E-4 2.79E-4 3.52E-4 2.20E-4
AbYSS FastPGA MOCeLL NSGAII
8.476E-4 9.265E-4 8.069E-4 1.2E-3
3E-4 2.1E-4 1.64E-4 3.57E-4
IGD HV Avg. Std. Avg. Std. Maximum number of evaluations is 25000 3.24E-4 3.7E-4 0.7148 6.3E-3 2.56E-4 1.8E-5 0.7161 2.1E-3 1.5E-5 1.3E-3 2.43E-4 0.7181 2.65E-4 2E-5 0.7154 1.9E-3 Maximum number of evaluations is 50000 2.46E-4 1.3E-5 0.7188 1.5E-3 2.46E-4 1.8E-5 0.7177 1.4E-3 1.7E-5 1.2E-3 2.39E-4 0.7194 2.64E-4 2.9E-5 0.7163 1.5E-3
2.5
Avg.
Spread Std.
Time, ms Avg. Std.
0.9116 0.9123 0.8824 0.9118
0.0546 0.0638 0.0547 0.0610
5336.9 19153.98 7881.74 4720.98
480.4 920.1 414.0 323.9
0.9291 0.9089 0.9045 0.9201
0.0548 0.0703 0.0574 0.0698
11187.28 38005.38 15407.92 9805.3
691.9 2138 682.7 556.4
2.5 Best efficient front AbYSS
Best efficient front FastPGA
2
2
% nr ut e R
% nr ut e R 1.5
1
1.5
1
2
3
4 Risk %
5
6
Fig. 1. Efficient front of AbYSS.
ISBN:978-988-17012-3-7
7
1
1
2
3
4 Risk %
5
6
7
Fig. 2. Efficient front of FastPGA.
WCE 2008
Proceedings of the World Congress on Engineering 2008 Vol II WCE 2008, July 2 - 4, 2008, London, U.K. Pareto fronts, and it also outperforms AbYSS, FastPGA, and NSGAII in terms of diversity, although the quality of obtained fronts is not very outstanding. In this case the fastest algorithm was NSGAII.
2.5 Best efficient front MOCeLL
2
REFERENCES
% nr ut e R
[1] 1.5
[2]
[3] 1
1
2
3
4 Risk %
5
6
7
[4]
Fig. 3. Efficient front of MOCeLL 2.5 Best efficient front NSGAII
[5] [6]
2
% nr ut e R
[7] 1.5
[8]
1
1
2
3
4 Risk %
5
6
7
[9]
Fig. 4. Efficient front of NSGAII [10]
[11] [12] [13]
[14]
Fig. 5. Efficient front of MOCell. VI. CONCLUSIONS From the results of three sets of experiments with four evolutionary algorithms for two criteria portfolio optimization it follows that MOCeLL is the best with respect to four of five performance criteria where maximal number of function evaluations was set to 15000 and 25000, and is the best with respect to three of five performance criteria where maximal number of function evaluations was set to 35000. In all cases AbYSS was the fastest, and in the one case it has slightly outperformed MOCeLL with respect to the spread criterion. The results of two sets of experiments with these algorithms for three criteria portfolio optimization reveal that MOCeLL provides the best results in convergence to the true
ISBN:978-988-17012-3-7
[15] [16]
H. Markowitz, “Portfolio selection,” Journal of Finance, vol. 7, 1952, pp. 77-91. J. Li, S. Taiwo, “Enhancing Financial Decision Making Using Multi-Objective Financial Genetic Programming,” Proceedings of IEEE Congress on Evolutionary Computation, 16-21 July 2006, pp. 2171- 2178. T.-J. Chang, N. Meade, J. E. Beasley, Y. M. Sharaiha. (2000). Heuristics for cardinality constrained portfolio optimisation. Computers and Operations Research, 27, pp. 1271-1302. S.-M. Wang, J.-C. Chen, H. M. Wee, K. J. Wang. (2006). Non-linear Stochastic Optimization Using Genetic Algorithm for Portfolio Selection. International Journal of Operations Research, 3(1) pp. 16-22. M. Ehrgott, K. Klamroth, C. Schwehm. (2004). Decision aiding an MCDM approach to portfolio optimization. European Journal of Operational Research, 155, pp.752-770. Y. Xia, S. Wang, X. Deng. (2001). Theory and methodology: a compromise solution to mutual funds portfolio selection with transaction costs. European Journal of Operation Research, 134, pp. 564-581. C. Stummer, M. Sun. (2005). New Multiobjective Metaheuristic Solution Procedures for Capital Investment Planning. Journal of Heuristics, 11, pp. 183–199. Ehrgott, M., C. Waters, R. N. Gasimov, O. Ustun. (2006) Multiobjective Programming and Multiattribute Utility Functions in Portfolio Optimization. Available: http://www.esc.auckland.ac.nz/research/tech/esc-tr-639.pdf A. Mukerjee, R. Biswas, K. Deb, and A. P. Mathur. (2002) Multi-objective evolutionary algorithm for the risk-return trade-off in bank loan management. International Transactions in Operational research. 9, pp. 583-597. R. E. Steuer, Y. Qi, and M. Hirschberger, “Portfolio Selection in the Presence of Multiple Criteria,” in Handbook of Financial Engineering, C. Zopounidis, M. Doumpos, P. M. Pardalos Ed. Springer, 2008, pp. 3-25. H. Eskandari, C.D. Geiger. (2008, June). A Fast Pareto Genetic Algorithm Approach for Solving Expensive Multiobjective Optimization Problems. Journal of Heuristics,14 (3), pp. 203-241. A.J. Nebro, J.J. Durillo, F. Luna, B. Dorronsoro, E. Alba, “A Cellular Genetic Algorithm for Multiobjective Optimization,” Proceedings of NICSO 2006, pp. 25-36. Granada, Spain, June 2006. A.J. Nebro, F. Luna, E. Alba, A. Beham, B. Dorronsoro, “AbYSS: Adapting Scatter Search for Multiobjective Optimization,” Tech Rep. ITI-2006-2, Departamento de Lenguajes y Ciencias de la Computación, University of Málaga, 2006. J.D. Knowles, D.W. Corne. (2000). Approximating the nondominated front using the Pareto Archived Evolution Strategy. Evolutionary Computation, 8(2), pp. 149-172. Deb, K., Pratap, A., Agarwal, S., Meyarivan, T. (2002). A Fast and Elitist Multiobjective Genetic Algorithm: NSGA–II. IEEE Transactions on Evolutionary Computation. 6 (2), pp. 182–197. D. A. Van Veldhuizen and G. B. Lamont, “Multiobjective Evolutionary Algorithm Research: A History and Analysis,” Dept. Elec. Comput. Eng., Graduate School of Eng., Air Force Inst. Technol., Wright-Patterson, AFB, OH, Tech. Rep. TR-98-03, 1998.
WCE 2008