Evolutionary Multiobjective Feature Selection in Multiresolution Analysis for BCI Julio Ortega1, Javier Asensio-Cubero2, John Q. Gan2, and Andrés Ortiz3 1
Dept. of Computer Architecture and Technology, CITIC, University of Granada, Spain School of Computer Science and Electronic Eng., University of Essex, United Kingdom 3 Dept. of Communications Engineering, University of Malaga, Spain
[email protected], {jasens,jqgan}@essex.ac.uk,
[email protected] 2
Abstract. Although multiresolution analysis (MRA) may not be considered as the best approach for brain-computer interface (BCI) applications despite its useful properties for signal analysis in the temporal and spectral domains, some previous studies have shown that MRA based frameworks for BCI can provide very good performance. Moreover, there is much room for improving the performance of the MRA based BCI by feature selection or feature dimensionality reduction. This paper investigates feature selection in the MRAbased frameworks for BCI, proposes and evaluates several wrapper approaches to evolutionary multiobjective feature selection. In comparison with the baseline MRA approach used in previous studies, the proposed evolutionary multiobjective feature selection procedures provide similar or better classification performance, with significant reduction in the number of features that need to be computed. Keywords: Brain-computer interfaces (BCI), Feature selection, Multiobjective optimization, Multiresolution analysis (MRA).
1
Introduction
Many high-dimensional pattern classification or modeling tasks require feature selection techniques in order to remove redundant, noisy-dominated, or irrelevant inputs. In particular, dimensionality reduction is very important to improve the accuracy and interpretability of the classifiers when the number of features is too large compared to the number of available training patterns, which is known as the curse of dimensionality. Brain-computer interfacing (BCI) applications based on the classification of EEG signals pose the high-dimensional pattern classification problem [1], due to (1) the presence of noise or outliers (as EEG signals have a low signal-to-noise ratio); (2) the need to represent time information in the features (as brain signal patterns are related to changes in time); (3) the non-stationarity of EEG signals, which may change quickly over time or within experiments. Moreover, the curse of dimensionality is usually present in the classification of EEGs as the number of patterns (EEGs)
F. Ortuño and I. Rojas (Eds.): IWBBIO 2015, Part I, LNCS 9043, pp. 347–359, 2015. © Springer International Publishing Switzerland 2015
348
J. Ortega et al.
available for training is usually small and the number of features is usually much larger than the number of available patterns. Feature selection is mandatory for BCI applications as it reduces the dimension of the input patterns making it possible to (1) decrease the computational complexity, (2) remove irrelevant/redundant features that would make it more difficult to train the classifier, and (3) avoid the curse of dimensionality [2]. Nevertheless, as the size of the search space depends exponentially on the number of possible features, an exhaustive search for the best feature set is almost impossible when the feature dimension is too high. Even for a modest number of features, feature selection procedures based on branch-and-bound, simulated annealing, and evolutionary algorithms have been proposed. Moreover, parallel processing could also be considered as an interesting alternative to take the advantage of high performance computer architectures for feature selection [3]. This paper describes several approaches for multi-objective feature selection in an MRA system for BCI [4]. An MRA system applies a sequence of successive approximation spaces that satisfy a series of constraints to reach a description as close as possible to the target signal [5], and thus it is useful whenever the target signal presents different characteristics in the successive approximation spaces. A specific example of MRA systems, the discrete wavelet transform (DWT), has been applied in [4] to characterize EEGs from motor imagery (MI). MI is a BCI paradigm that uses the series of amplifications and attenuations of short duration occasioned by limb movement imagination, the so called event related desynchronization (ERD) and event related synchronization (ERS). The task of ERD/ERS analysis is complex because they are weak and noisy and occur at different locations of the cortex, at different instants within a trial, and in different frequency bands. Moreover, there is no consistency in the patterns among subjects, and the patterns can even change within a session for the same subject, which may lead to high-dimensional patterns making the number of available patterns to conduct ERD/ERS analysis significantly less than the number of features. This constitutes a good scenario for evaluating the multiobjective feature selection approaches proposed in this paper. This paper is organized as follows. Section 2 describes feature selection as a multiobjective optimization problem. Section 3 describes the MRA framework for BCI and the characteristics of the corresponding features. Section 4 describes several alternatives proposed for evolutionary multiobjective feature selection in MRA for BCI. Experimental results are presented and discussed in Section 5. Finally, the conclusions are given in Section 6.
2
Multiobjective Optimization in Supervised Feature Selection
In this paper we implement feature selection through a wrapper approach. A wrapper approach can be regarded as a search for the best feature set, which optimizes a cost function that evaluates the utility of the selected features for a given classification problem. In our case the cost function takes into account the classification performance obtained with the selected features. As the performance of a classifier is usually expressed not only by its accuracy for a given set of patterns, but also by other
Evolutionary Multiobjective Feature Selection in Multiresolution Analysis for BCI
349
measures that quantify properties such as the generalization capability and computational efficiency. Using a multiobjective formulation for the feature selection problem, our method could be considered a powerful approach to feature selection. A multiobjective optimization problem can be defined as finding a vector of decision variables x=[x1,x2,...,xn]∈Rn that satisfies a restriction set, e.g., g(x)≤0, h(x)=0, and optimizes a function vector f(x), whose scalar values (f1(x), f2(x),…, fm(x)) represent the objectives of the optimization. As these objectives are usually in conflict, instead of providing only one optimal solution, the procedures applied to multiobjective optimization should obtain a set of non-dominated solutions, known as Pareto optimal solutions, from which a decision agent will choose the most convenient solution in specific circumstances. These Pareto optimal solutions are optimal in the sense that in the corresponding hyper-area known as Pareto front, no solution is worse than the others when all the objectives are taken into account. Feature selection as a multiobjective optimization problem can be for either supervised or unsupervised classifiers. A deep review on this topic is given by J. Handl and J. Knowles [6]. With respect to supervised classifiers, multiobjective feature selection procedures often take into account the number of features and the performance of the classifier [7, 8]. There are a lot of studies focusing on feature selection for unsupervised classification [6, 9, 10]. As the labels for the training and testing patterns are available in our BCI datasets, this paper deals with supervised multiobjective feature selection.
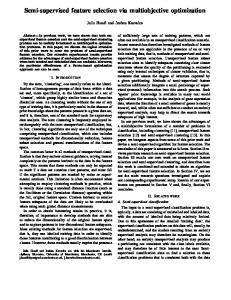
Fig. 1. Wrapper approach to feature selection by evolutionary multiobjective optimization
Figure 1 provides a scheme of multiobjective optimization for feature selection in a classification procedure. This scheme corresponds to the wrapper approach for feature selection implemented in our study. Each individual of the population encodes the features of the input patterns that are taken into account during the classifier training. An individual evaluation implies to train the classifier with the given input patterns and to determine the classifier performance by using several cost functions, as a multiobjective optimization procedure has been considered. From Figure 1 the usefulness of a multiobjective approach for feature selection is apparent as the classifier’s behavior is not usually characterized by only one parameter. Besides the
350
J. Ortega et al.
accuracy, there are other measures that quantify its performance. Among them we have measures to evaluate its generalization capabilities or the possible amount of overfitting the classifier could present.
3
Multiresolution Analysis of EEG for BCI
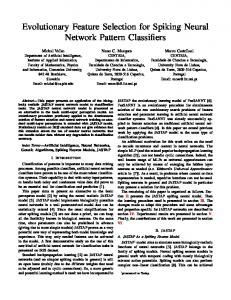
In this paper the dataset used to evaluate the proposed multiobjective feature selection procedures was recorded in the BCI Laboratory at the University of Essex. The dataset includes patterns that correspond to three different classes of imagined movements (right hand, left hand, and feet) from 10 subjects with ages from 24 to 50 (58% female, 50% naïve to BCI) and was recorded with a sampling frequency of 256 Hz during four different runs. There are a total of 120 trials for each class for each subject. More details about this dataset can be found in [4]. Each pattern was obtained from an EEG trial by the feature extraction procedure based on the MRA described in [4]. Thus, each signal obtained from each electrode contains several segments to which a set of wavelets detail and approximation coefficients are assigned. If there are S segments, E electrodes, and L levels of wavelets, each pattern is characterized by 2×S×E×L sets of coefficients (the number of coefficients in each level set depends on the level). In the Essex BCI dataset, S=20 segments, E=15 electrodes, and L=6 levels, therefore 3600 sets, with from 4 to 128 coefficients in each set are used to characterize each pattern (a total of 151200 coefficients). Figure 2 shows how the pattern features are generated. Taking into account that the number of training patterns for each subject is approximately 180, it is clear that an efficient procedure for feature selection is required. Pattern (v) levels segments
electrodes electrode k level j segment i
Wavelet coefficients of level j, for segment i and electrode k in pattern v
Normalized variance of the approximation and details wavelets coefficients xa(i,j,k) xd(i,j,k)
Label of the Class where pattern v is included
Fig. 2. Characterization of an EEG signal (pattern) in [4]
In [4] a simple approach to reduce the number of coefficients is applied, in which only one coefficient is assigned to each electrode and each level of approximation and detail. This coefficient is obtained by computing the second moment of the coefficient distribution (variance) and normalising the value between 0 and 1. This way, the number of coefficients for a given pattern is 2×S×E×L. Another approach to reduce the number of features used in [4] is, instead of using only one classifier as shown in Figure 3, a set of LDA (linear discriminant analysis) classifiers are used, and the majority voting of all the LDA outputs is adopted as the final classification output. This way, a set of 2×S×L LDA classifiers with the number of inputs equaling the number of electrodes are adopted, as shown in Figure 4.
Evolutionary Multiobjective Feature Selection in Multiresolution Analysis for BCI
351
Fig. 3. EEG classification with only one LDA classifier
…...
Xa/d(s,l,1)
Number of LDA: segments x levels x 2 (a component from each electrode in each LDA)
LDA (s,l,a/d)
Xa/d(s,l,elect)
Voting module
LDA (s,l,a/d)
…………..
…...
Xa/d(s,l,1)
…...
Xa/d(s,l,elect)
…...
Xa/d(s,l,1)
LDA (s,l,a/d)
Xa/d(s,l,elect)
Fig. 4. EEG classification with multiple LDA classifiers based on majority voting, with one LDA classifier per segment per level [4]
In this paper we present several feature selection approaches for the classification framework shown in Figure 4. It is clear that it is possible to consider the selection of the LDAs in Figure 4, but there are also other possible arrangements of LDAs as the one shown in Figure 5. The feature searching space in the classifier structure of Figure 4 has a dimension of 2×S×L, while the classifier of Figure 5 has the same number of features as in the case of Figure 3, i.e., 2×E×L.
…...
X(1,1)
LDA (1)
Number of LDA: number of segments (selected features for each LDA) Voting module
(s2)
…………..
LDA …...
…...
X(2,1)
…...
X(s,1)
LDA (segments)
Fig. 5. EEG classification with multiple LDA classifiers based on majority voting, with one LDA classifier per segment
352
4
J. Ortega et al.
Evolutionary Multiobjective MRA Feature Selection
Figure 1 outlines the main elements of our wrapper approach to evolutionary multiobjective feature selection. The classifier for assigning the fitness to each individual is the one in the different approaches shown in Figures 3 to 5. In this section we provide the relevant characteristics of the multiobjective evolutionary algorithm proposed, which is briefly described in Figure 6. The main steps of the multiobjective evolutionary algorithm correspond to those of NSGA-II [11], including the specific individual codification and genetic operators implemented for the application at hand. Input: N number of solutions in the population P0 population of solutions (subsets of selected features) M number of objectives D set of training patterns L labels of the classes for training patterns Output: Pf set of nondominantsolutions (selected subsets of features) (1)
P0=initialize_population(P0);
(2)
(P0,f1..M(P0))=evaluate_population(P0,D,L);
(3)
(P,f1..M(P)) =NSGAII_nondomination_sort(P0,f1..M(P0));
(4)
repeat
(5)
(P’,f1..M(P’)) =NSGAII_tournament_selection(P,f1..M(P));
(6)
P” =genetic_operators(P’);
(7)
(P”,f1..M(P”)) =evaluate_population(P”,D,L);
(8)
(P*,f1..M(P*))=NSGAII_nondomination_sort(P”,f1..M(P”),P,f1..M(P));
(9)
(P,f1..M(P)) =NSGAII_replace_chromosome(P*,f1..M(P*));
(10)
until end_condition
(11)
Pf = P
Fig. 6. Pseudocode for evolutionary multiobjective feature selection based on NSGA-II
In NSGA-II the fitness values of the individuals in the population are sorted accordingly to the different fronts of nondominated individuals (nondomination levels) where they belong, while the diversity among individuals in the same nondominated front is also preserved. This way, NSGA-II uses a fast procedure of O(MN2) complexity (M is the number of objectives and N the number of individuals in the population), and the storage requirements grow as O(N2) in order to sort the population according to the different levels of nondominance. This procedure is implemented by the function NSGAII_nondomination_sort() in lines (3) and (8) of the pseudocode of Figure 6, thus being applied once the evaluation of the individuals by evaluate_population() is done, either after the population is initialized by initialize_population()in line (1) or after new individuals appear due to the action of genetic_operators()in line (6). To maintain the diversity among solutions with the same nondominance level, NSGA-II estimates the density of solutions surrounding a given solution through the average distance of the nearest neighbour solutions on either side of the considered solution for each dimension (objective) of the front. The density of solutions or crowding distance can be computed with complexity O(MNlogN) as it implies to sort, at most, N individuals along the dimensions corresponding to m objectives.
Evolutionary Multiobjective Feature Selection in Multiresolution Analysis for BCI
353
This crowding distance avoids the need of setting a sharing parameter. Once each individual in the population has a nondomination rank and a crowding distance, a selection process chooses solutions with lower nondomination ranks and solutions with higher crowding distances (less crowded regions) in case of similar nondomination ranks. Thus, the complexity of NSGA-II is determined by the population sorting step, i.e., O(mN2). This task has been implemented, respectively in lines (5) and (9) of the pseudocode of Figure 6, through the functions NSGAII_tournament_ selection()and NSGAII_replace_chromosome(). To configure NSGA-II for our wrapper procedure for feature selection, the fitness evaluation is done by a function that implements the learning procedure for the corresponding classifier (Figures 3 to 5) by using a set of labelled patterns. The corresponding procedure is implemented through evaluate_population() in lines (2) and (7). Thus, three main issues should be considered for a whole specification of the evolutionary multiobjective search procedure: the codification of the individuals in the population, the genetic operators, and the cost functions. Codification of the Individuals. If the number of features is very high, it is not useful to codify an individual with binary components, with each component corresponding to a possible feature. In our approach, each individual is codified by a set of vectors, with each vector corresponding to one of the features included in the selection codified by the individual. The components of the vector correspond to the dimensions that characterize each input pattern. For example, in the case described in Figure 2, each feature is codified by a vector with four components: segment, level, electrode, analysis/detail wavelet component. Each component will have an integer value between 1 and S for the segment component, between 1 and L for the level component, between 1 and E for the electrode component, and 0 or 1 for the analysis/detail component. This strategy provides efficient codification and allows to extract information about the characteristics of the feature selection (segments, levels, electrodes, or coefficients more frequently selected, etc.). Genetic Operators. Two different operators can be applied to the individuals. The first one is a crossover operator that randomly selects two parents and a subset (also randomly selected) of features for each parent. These subsets are interchanged by the parents. The mutation operator applies changes to a subset of features randomly chosen among the features codified by the individual to be mutated, which is also randomly selected. The changes in the values of the components of the feature to be mutated are normally distributed with means and deviations that change with generations. Cost Functions. To characterize the performance of the classifier while it has been trained or adjusted for a given set of features (an individual of the population), it is important not only to take into account the accuracy obtained for the training set but also to its behaviour for unseen instances, i.e., its generalization capabilities. Thus, two cost functions are considered to evaluate the feature selection. The first one is the kappa index [12], which provides an accurate description of the classifier performance. It can be considered even better than the classification ratio as it takes into account the per class error distribution. The other cost function evaluates aspects such as the generalization capability or the classifier overfitting. In our case, 10-fold crossvalidation analysis to the training patterns was applied to obtain the cost function values.
354
5
J. Ortega et al.
Experimental Results
This section presents the experimental results obtained by the evolutionary multiobjective feature selection approaches described in Section 4. The experiments have been performed by using the dataset recorded in the BCI Laboratory at the University of Essex. For each subject, there is one data file named x1## with data recorded in two runs for training and another data file named xe1## with data recorded in two runs for evaluation. Each data file contains about 180 labelled patterns with data from 20 segments (S=20), six levels (L=6) of approximation or detail coefficients (a/d=2), and 15 electrodes (E=15). The labels correspond to three imagined movements of right hand, left hand, and feet. The baseline method for comparison (OPT0) corresponds to the MRA framework depicted in Figure 4, where all the possible S×L×2 LDAs are considered for voting the class to which the corresponding pattern belongs. The number of inputs to each LDA is the same as the number of electrodes. The input from a given electrode is the normalized second moment of the wavelet coefficients of the signal in this electrode for the s-th segment, the l-th level, and approximation/detail type of the corresponding LDA. In OPT0 there is no feature selection. The three alternative methods proposed in this paper (OPT1, OPT2, and OPT3) use different multiobjective feature selection approaches. OPT1 is based on the classification scheme shown in Figure 3 and the multiobjective feature selection procedure is applied on S×L×E×2 features corresponding to the possible segments, levels, variances of the approximation and detail coefficients, and electrodes. With the BCI dataset of the University of Essex there are 20×6×15×2=3600 possible features for selection. OPT2 is based on the classifier structure shown in Figure 4. In this case, the feature selection problem is to select among the S×L×2 possible LDAs used for voting in the OPT0 method. This means the dimension of the search space is 20×6×2=240. OPT3 is based on the classification scheme shown in Figure 5. In this case, the number of LDAs used for voting is equal to the number of segments, and each LDA can have up to 2×L×E different features as inputs. With the BCI dataset, there are 20 LDAs, each with up to 2×6×15=180 inputs. There are 2×S×L×E features, but they are structured and no more than 2×E×L features are available for selection for a given LDA. The evolutionary multiobjective feature selection procedures have been executed with populations of 20, 30, and 50 individuals respectively, and with 20, 30, and 50 generations respectively to determine the minimum number of individuals and generations that provide competitive results compared with OPT0. OPT1, OPT2, and OPT3 have been executed by using 50 individuals and 50 generations so that the amount of searching work in all the approaches is similar. Executions with different number of iterations and individuals would provide a fairer comparison among the different approaches. We will consider this at the end of this section. We have used simulated binary crossover with a crossover probability of 0.5, a mutation probability of 0.5, and distribution index of 20 for crossover and mutation operators. It is worth mentioning that no work on tuning the parameters of the evolutionary multiobjective feature selection options to optimize their behavior has
Evolutionary Multiobjective Feature Selection in Multiresolution Analysis for BCI
355
been considered, as our aim here is to analyze whether multiobjective optimization is able to provide some improvements on MRA approaches for BCI. Tables 1 and 2 compare the Kappa indexes obtained by the 4 approaches (OPT0 to OPT3). The columns labeled as “Kappa index (x#)” in Table 1 correspond to the Kappa index values obtained by the trained classifier when it was evaluated by using the same training patterns. The columns labeled as “Kappa index (xe#)” in Table 2 provide the Kappa index values obtained by the 4 approaches when the testing patterns were used to evaluate the classifier performance for each subject. Table 1. Comparison of different feature selection and classification methods for the University of Essex BCI data files (Kappa values evaluated with the training patterns) Subject 101 102 103 104 105 106 107 108 109 110
OPT0 Kappa index (x#) 0.790 0.857 0.757 0.899 0.757 0.774 0.857 0.774 0.790 0.883
OPT1 Kappa index (x# mean,std) 0.738+0.022* 0.747+0.017* 0.665+0.012* 0.819+0.013* 0.646+0.023* 0.604+0.023* 0.816+0.018* 0.508+0.021* 0.597+0.021* 0.821+0.016*
OPT2 Kappa index (x# mean,std) 0.828+0.011^ 0.855+0.011 0.747+0.013 0.902+0.010 0.751+0.013 0.776+0.014 0.880+0.011^ 0.745+0.023* 0.770+0.015* 0.877+0.026
OPT3 Kappa index (x# mean,std) 0.797+0.023 0.853+0.022 0.695+0.024* 0.882+0.022* 0.695+0.031* 0.754+0.024* 0.845+0.022 0.683+0.032* 0.730+0.030* 0.897+0.015^
Table 2. Comparison of different feature selection and classification methods for the University of Essex BCI data files (Kappa values evaluated with the test patterns) Subject 101 102 103 104 105 106 107 108 109 110
OPT0 Kappa index (xe#) 0.438 0.455 0.279 0.564 0.287 0.321 0.631 0.254 0.388 0.648
OPT1 Kappa index (xe# mean,std) 0.393+0.046* 0.302+0.074* 0.249+0.046 0.510+0.056 0.191+0.040* 0.193+0.070* 0.560+0.041* 0.088+0.036* 0.207+0.071* 0.450+0.036*
OPT2 Kappa index (xe# mean,std) 0.437+0.033 0.429+0.023 0.325+0.017^ 0.545+0.035 0.240+0.031 0.319+0.028 0.634+0.019 0.184+0.027* 0.333+0.026* 0.605+0.041*
OPT3 Kappa index (xe# mean,std) 0.367+0.032* 0.382+0.044* 0.356+0.024^ 0.563+0.034 0.227+0.023* 0.246+0.036* 0.603+0.027* 0.184+0.028* 0.321+0.037* 0.578+0.027*
The results shown in Table 1 and Table 2 for OPT1, OPT2, and OPT3 are the average (mean and standard deviation) over 15 executions of each approach for each subject. The statistical analysis has been conducted by applying a KolmogorovSmirnov test first to determine whether the obtained values of the Kappa index follow a normal distribution or not. If the experimental results do not have normal distribution, a non-parametric Kruskal-Wallis test has been used to compare the means of the different algorithms. A confidence level of 95% has been considered in the statistical tests. If the mean values of the Kappa index in OPT1, OPT2, and OPT3
356
J. Ortega et al.
are statistically significantly different from those in OPT0 according to the KruskalWallis test, they are marked with either ^ or *, with ^ indicating performance improvement and * indicating performance loss. Tables 3 and 4 show the best values of the Kappa index achieved by each approach over 15 executions. Compared to OPT0, feature selection (OPT1, OPT2, and OPT3) is able to provide competitive results, with the advantage that they require a smaller number of features. In some cases, OPT2 provides even better classification performance than OPT0. According to the statistical tests, except for subjects x108, x109, and x110, OPT2 is able to obtain the same or even better results than OPT0, with fewer features, which is highly valuable when designing online BCI systems. Table 3. Comparison of different feature selection and classification methods for the University of Essex BCI data files: maxima Kappa values evaluated with the training patterns Subject 101 102 103 104 105 106 107 108 109 110
OPT0 Kappa index (x#) 0.790 0.857 0.757 0.899 0.757 0.774 0.857 0.774 0.790 0.883
OPT1 Kappa index (x# max) 0.782 0.782 0.690 0.849 0.673 0.648 0.849 0.539 0.623 0.841
OPT2 Kappa index (x# max) 0.849 0.883 0.765 0.925 0.774 0.799 0.899 0.782 0.799 0.899
OPT3 Kappa index (x# max) 0.832 0.883 0.723 0.933 0.740 0.799 0.874 0.732 0.799 0.920
Table 4. Comparison of different feature selection and classification methods for the University of Essex BCI data files: maxima Kappa values evaluated with the test patterns Subject 101 102 103 104 105 106 107 108 109 110
OPT0 Kappa index (xe#) 0.438 0.455 0.279 0.564 0.287 0.321 0.631 0.254 0.388 0.648
OPT1 Kappa index (xe# max) 0.472 0.405 0.329 0.589 0.287 0.338 0.631 0.170 0.346 0.530
OPT2 Kappa index (xe# max) 0.489 0.463 0.354 0.614 0.287 0.381 0.665 0.245 0.371 0.673
OPT3 Kappa index (xe# max) 0.430 0.447 0.413 0.606 0.287 0.292 0.656 0.237 0.388 0.639
With respect to the execution time required by each approach, the mean execution time is 4533+45s for OPT1, 13353+1031s for OPT2, and 1159+56s for OPT3. Taking into account these differences in the running time, it is possible to argue that the comparison among different approaches may not be fair as OPT1 and OPT3 could probably achieve better results when more generations (with more individuals) are adopted with execution time similar to that required by OPT2. Table 5 shows the results obtained, for two subjects only (x104 and x107), with OPT1 using a
Evolutionary Multiobjective Feature Selection in Multiresolution Analysis for BCI
357
population of 100 individuals and 60 generations and OPT3 using 200 individuals and 90 generations. When 100 individuals and 60 generations are used, OPT1 requires a mean execution time of 11042+162s, which is in a similar order as the one required by OPT2. In the case of OPT3, 200 individuals and 90 generations still consume less execution time (8408+144s) than OPT2 with 50 individuals and 50 generations. The results in Table 5 show improvements on the performance of OPT1 and OPT3 as the number of individuals in the population and generations are increased. In the values of the Kappa index obtained by using the training patterns (x# columns), the KruskalWallis test shows that the differences are statistically significant for OPT1 (p=0.00 and p=0.005 for x104 and x107, respectively). However, when the evaluation was done by using the test patterns (xe# columns), these differences among OPT1 with 100 and 50 individuals are not significant (p=0.75 and p=0.25 for x104 and x107, respectively). In the case of OPT3, the situation is similar for the values of Kappa index obtained by using the training patterns (p=0.04 and 0.014 for x104 and x107, respectively). With respect to the values of Kappa index obtained by using the testing patterns, the results are not statistically significant for x104 (p=0.63) but are statistically significant for x107 (p=0.005). It can be seen that OPT3 with a population of 200 individuals and 90 iterations achieved better performance than OPT2 (evaluation with the test patterns, i.e., xe# columns). Nevertheless, the Kruskal-Wallis test only shows statistical significance for x107 (p=0.005 for x107, and p=0.0997 for x104). Table 5. Comparison of Kappa indexes for OPT1 with 100 individuals and 60 generations, and OPT3 with 200 individuals and 90 generations, with respect to OPT1, OPT2, and OPT3 with 50 individuals and 50 generations (x#: evaluation was done with training patterns; xe#: evaluation was done with test patterns) Subject x104 x107 Subject x104 x107
6
OPT1 (100,60) Kappa index (x# mean,std) 0.841+0.018 0.836+0.016 Kappa index (xe# mean,std) 0.515+0.047 0.580+0.052
OPT1 (50,50) Kappa index (x# mean,std) 0.819+0.013 0.816+0.018 Kappa index (xe# mean,std) 0.510+0.056 0.560+0.041
OPT2 (50, 50) Kappa index (x# mean,std) 0.902+0.010 0.880+0.011 Kappa index (xe# mean,std) 0.545+0.035 0.634+0.019
OPT3 (200,90) Kappa index (x# mean,std) 0.897+0.019 0.865+0.018 Kappa index (xe# mean,std) 0.573+0.032 0.644+0.022
OPT3 (50,50) Kappa index (x# mean,std) 0.882+0.022 0.845+0.022 Kappa index (xe# mean,std) 0.563+0.034 0.603+0.027
Conclusions
Procedures such as the one described in [4] provide approaches to cope with the curse of dimensionality based on the composition of multiple classifiers. Each classifier receives only a subset of pattern components (features) in such a way that the number of patterns is much higher than the number of features used as inputs. The problem with these approaches is that the number of classifiers to train and to accomplish the classification is usually very high (as finally, all the features should be taken into account). Beyond these approaches do not provide information about the most relevant features, the need to compute such a high number of features and to train a lot of classifiers could be a significant drawback to satisfy real-time requirements of
358
J. Ortega et al.
many applications. In this context, the contribution of this paper is twofold. On the one hand, we provide a multiobjective approach to cope with the feature selection in LDA classification based on two cost functions that evaluate the classifier accuracy and its generalization capability. On the other hand, we have proposed several classification structures (OPT1 to OPT3) to take advantage of our multiobjective approach to feature selection. The experimental results show that evolutionary multiobjective feature selection is able to provide classification performance similar to that of using all the possible LDAs with all the possible feature inputs (OPT0). Thus the proposed approaches lead to simpler classification procedures with fewer features. Besides the analysis of the characteristics of the features selected for obtaining some knowledge about important electrodes and segments, etc., there are other issues that can be considered to improve the performance of multiobjective feature selection in BCI applications. It is clear that improving the cost function that evaluates the generalization capability is an important issue. Moreover, the implementation of cooperative coevolutionary approaches able to cope with problems with a large number of decision variables (features) is also an interesting topic. Aknowledgements. This work has been partly funded by projects TIN2012-32039 (Spanish “Ministerio de Economía y Competitividad” and FEDER funds), P11-TIC7983 (Junta de Andalucía, Spain), and Research Programme 2014 of the University of Granada.
References 1. Lotte, F., Congedo, M., Lécuyer, A., Lamarche, F., Arnaldi, B.: A review of classification algorithms for EEG-based brain-computer interfaces. Journal of Neural Engineering 4(2) (2007), doi:10.1088/1741-2560/4/2/R01 2. Raudys, S.J., Jain, A.K.: Small sample size effects in statistical pattern recognition: Recommendations for practitioners. IEEE Transactions on Pattern Analysis and Machine Intelligence 13(3), 252–264 (1991) 3. Zao, Z., Zhang, R., Cox, J., Duling, J.D., Sarle, W.: Massively parallel feature selection: an approach based on variance preservation. Machine Learning 92, 195–220 (2013) 4. Asensio-Cubero, J., Gan, J.Q., Palaniappan, R.: Multiresolution analysis over simple graphs for brain computer interfaces. Journal of Neural Engineering 10(4) (2013), doi:10.1088/1741-2560/10/4/046014 5. Daubechies, I.: Ten Lectures on Wavelets. SIAM, Philadelphia (2006) 6. Handl, J., Knowles, J.: Feature selection in unsupervised learning via multi-objective optimization. Intl. Journal of Computational Intelligence Research 2(3), 217–238 (2006) 7. Emmanouilidis, C., Hunter, A., MacIntyre, J.: A multiobjective evolutionary setting for feature selection and a commonality-based crossover operator. In: Proceedings of the 2000 Congress on Evolutionary Computation, pp. 309–316. IEEE Press, New York (2000) 8. Oliveira, L.S., Sabourin, R., Bortolozzi, F., Suen, C.Y.: A methodology for feature selection using multiobjective genetic algorithms for handwritten digit string recognition. International Journal of Pattern Recognition and Artificial Intelligence 17(6), 903–929 (2003) 9. Kim, Y., Street, W.N., Menczer, F.: Evolutionary model selection in unsupervised learning. Intelligent Data Analysis 6(6), 531–556 (2002)
Evolutionary Multiobjective Feature Selection in Multiresolution Analysis for BCI
359
10. Morita, M., Sabourin, R., Bortolozzi, F., Suen, C.Y.: Unsupervised feature selection using multi-objective genetic algorithms for handwritten word recognition. In: Proceedings of the Seventh International Conference on Document Analysis and Recognition, pp. 666–671. IEEE Press, New York (2003) 11. Deb, K., Agrawal, S., Pratab, A., Meyarivan, T.: A fast elitist Non-dominated Sorting Genetic Algorithms for multi-objective optimisation: NSGA-II. In: Deb, K., Rudolph, G., Lutton, E., Merelo, J.J., Schoenauer, M., Schwefel, H.-P., Yao, X. (eds.) PPSN 2000. LNCS, vol. 1917, pp. 849–858. Springer, Heidelberg (2000) 12. Cohen, J.: A coefficient of agreement for nominal scales. Educ. Psychological Meas. 20, 37–46 (1960)