include the nature of the software repository, the different ... The rest of the elements mentioned above are usu- ... of the KDE CVS repository are provided.
Executable source code and non-executable source code: analysis and relationships Gregorio Robles, Jesus M. Gonzalez-Barahona Universidad Rey Juan Carlos Grupo de Sistemas y Comunicaciones Tulipan s/n, 28933 Mostoles (Madrid), Spain {grex,jgb}@gsyc.escet.urjc.es
Abstract The concept of source code, understood as the source components used to obtain a binary, ready to execute version of a program, comprises currently more than source code written in a programming language. Specially when we move apart from systems-programming and enter the realm of end-user applications, we find source files with documentation, interface specifications, internationalization and localization modules, multimedia files, etc. All of them are source code in the sense that the developer works directly with them, and the application is built automatically using them as input. This paper discusses the relationship between ’classical’ source code (usually written in a programming language) and these other files by analyzing a publicly-available software versioning repository. Aspects that have been studied include the nature of the software repository, the different mixtures of source code found in several software projects stored in it, the specialization of developers to the different tasks, etc.
1. Introduction Software development has evolved from command-line applications to huge end-user applications full of graphics and multimedia elements. Tracking this evolution, software development is no longer performed only by software developers. In many cases it has become an activity which requires the coordinated work of several different groups, with different backgrounds and committed to various tasks: internationalization and localization (i18n and l12n), graphic design, user interface design, writing of technical and end-user documentation, creation of multimedia elements, etc. Despite these changes, ’classical’ source code analysis is
still focused on the output of the work performed by software developers: source code written in a programming language. The rest of the elements mentioned above are usually not considered, even though they are in many cases a fundamental part of the application. We consider that all those elements are also an integral part of the development process, and in this paper we propose the starting point of a path towards their comprehensive study by looking at the interdependencies existing between all of them. In this sense, our intention is to extend, for the purposes of the analysis of the software production process, the concept of source code to all those other elements different from pure programming code. To accomplish this goal, we discriminate several kinds of files, corresponding different kinds of ’source code’. From the analysis of such files and their evolution over time it may be inferred the importance that a given software project allocates to different activities like documentation, translation, user interface design or multimedia development. We propose a methodology for such an study, and a software that retrieves the relevant information from a CVS repository and implements such a methodology. There is plenty of literature devoted to the analysis of source code, both in the proprietary and in the libre software1 realms, but only some of them relate directly to this paper. Among them, it is worth mentioning some studies that have attempted to gain some knowledge who works on a self-organized project. [2] analyzes change-log files in a almost-automatic way. However, the analysis is limited and somewhat inaccurate in its scope, and is difficult to extend with a deeper study of the different kinds of source files. Some other publicly-available repositories[8] are more suitable for our purposes, of which the versioning systems used for software development can be highlighted. Those repositories allow for the monitoring of the whole development 1 Throughout this article we use the term ‘libre software’ to refer both to free and open source software.
process, including file types and their developers. Another argument in favor of those data sources is that evolutionary studies are easy to perform, since all the past states of the code are available. [3] presents such an evolutionary study for the Linux kernel. Its primary aim is centered on performing a “pure” source code and dependency analysis, and it could be classified into the field of “classical” software evolution theory[5]. Our goal differs from that approach in two main aspects. On one hand, we are more interested in end-user applications rather than system programs such as a kernel, since they have a larger amount of source elements different from “pure” source code. On the other, we want to research also the human interactions and their evolution. In this direction exists some literature performing analysis on self-organizing development groups using social network analysis techniques[6], and proposing ways of identifying its underlying community structure[4]. In the following section we present the methodology, followed by a case of study in which it is applied: the KDE project, a libre software desktop environment with hundreds of applications and a large development community. After that, some results on the modules and on the developers of the KDE CVS repository are provided. Finally, some conclusions and further work will be discussed. This paper includes also an appendix containing some additional information about the methodology.
2. Methodology The methodology described in this paper is based on the analysis of CVS2 log entries. Having access to a versioning system such as CVS makes it possible not only to have the latest version of the source code, but also the possibility of fetching data about any point in time since the repository was set up (which enables evolutionary studies). We have automated this methodology with the CVSAnalY tool [7] which extracts, for every interaction (commit) performed by a commiter3 in the CVS repository the following data: commiter name, date, file, revision number, lines added, lines removed, and an explanatory comment introduced by the commiter. It is important to notice that commiters population include not just software developers, in the sense of programming code generators. In many cases they are devoted to other tasks such as translation or graphical design. Since it is possible to know from the CVS logs which commiters have done what actions, it is also possible to correlate access to certain kind of files with commiters, and classify them according to the task they are probably fulfilling. 2 The Concurrent Versions System (CVS) is the most popular versioning system used in the libre software world. 3 A commiter is a person who has write access to the repository and does a commit on it at a given time.
In addition, there is some file-specific information in the CVS logs that can be skimmed, such as whether a given file has been removed4 . An analysis of the file name makes it possible to sort files by type, so that programming-language files can be taken apart from translation files and so on. The criteria used for this classification is based on simple heuristics that pay attention primarily to the file extension and some common patterns in the file content. In the next subsection file type identification will be discussed further. When committing to CVS, the developer can insert a comment about it. These comments can also be parsed, trying to infer whether the corresponding commit is for an external contribution (code not directly written by the commiter), or even to an automated script. Comments are in many cases forwarded to a mailing list, so that developers can keep track of the latest changes. But things can be more complex: some projects have agreed on conventions so that certain commits do not produce a message to the mailing list in certain cases, which are supposed not to require notification. A good example of the pertinent use of “silent” commits comes from the existence of bots that do several tasks automatically. In any case, such conventions are not limited to non-human bots, as human commiters may also use them. For our methodology the important fact is that in large communities (like the ones we are researching) we can consider that “silent” commits are not contributions, and therefore we compute them separately or leave them out completely (depending on the analysis). Once the CVS logs have been parsed, and a database has been fed with the resulting data, a post-process stage takes place. Several scripts query the database for performing statistical analysis, calculating several inequality and concentration indices, and generating graphs for the evolution in time of a couple of interesting parameters (commits, commiters, LOCs...). Results are shown through a publicly accessible web interface that permits an easy inspection of the whole repository (general results), a single module or by commiters. Therefore these results themselves are again available for remote analysis and interpretation by project participants and other interesting parties.
3. Case of study: KDE KDE is a libre software project aimed to build a libre software graphical desktop environment for UNIX-like operating systems. The desktop and its applications (such as their own office suite, KOffice) are built by making use of their application development framework. A large community has flourished in the last years around KDE: the number of commiters is close to one thousand. 4 In CVS there is actually no file removal: files that are not required anymore are stored in the Attic and could be called back anytime in the future. But it can be tracked when one file is only in the Attic.
CVS repositories are usually organized in modules. In the KDE case, a module may contain several applications of a suite. For instance, there is a KOffice module which groups all office suite applications (word processor, spreadsheet, presentation program, etc.). Some other modules serve for the project’s own administrative means, and it is important to notice that there also exists a module used to store all the translation files.
Table 1. General statistics for the KDE project Number of modules 79 Number of commiters 915 Number of commits 2,935,436 Number of files 175,657 Lines added 106,036,517 Lines removed 73,534,466 First commit 1997-04-09 Last commit considered 2004-03-22 Number of days 2,539
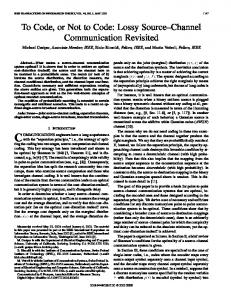
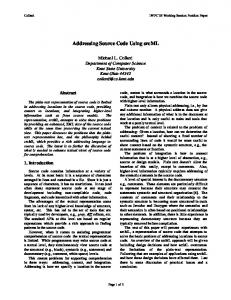
Figure 1 presents a weighted distribution of the file types stored in the KDE CVS repository. The weight used is the number of commits done to files corresponding to each file type. This figures provide an idea of the activity around any given file type that we are investigating. A first impression on this figure offers some interesting information. KDE is clearly a software development project (programming code is the largest portion), but the effort invested into such development does not reach by far 50%. The amount of translations is a good indicator of the wide spread of the KDE project around the globe, but documentation and images are also heavily represented. It is also shown how the amount of sound (multimedia) files is minimal, an evidence that KDE is not a multimedia project, while the user interface fraction (around 15%) is large enough to properly argument that it is actually a desktop-targeted environment. Finally, the fraction corresponding to unknown file types lies under 3%. Figure 2 presents the distribution of commits per module for the selected file types (both axes are in logarithmic scale). We expected to find a power law distribution as it is common in other distributions, like those found in several aspects of computer networks[1]. However, the graphs point out a Poisson distribution with the interesting case of the line corresponding to the i18n files, which has two clearly defined regions, similar to the Poisson distribution found for instance in the number of synonyms that a word has in the English language.
Figure 1. Commits by file type for the KDE repository.
4. Modules Our methodology offers the possibility of studying each module and commiter on its own. This makes it possible to classify modules and commiters depending on their composition (in the first case) and on the tasks it is devoted to (in the latter one). Therefore, most active file types provides an idea of the nature of modules and commiters. We expect that further research may also allow to know their specialization. As an example of the analysis that can be done on modules, we will pay attention on the KOffice module. Figure 3 shows the distribution of the different file types in a pie for KOffice, from which we may infer that it is primarily a development project (red), although the user interface (purple) portion is not negligible. All other elements considered in this study (images, documentation, translations and multimedia) are very rare. The fact that commits done to translation files are so scarce is due to the existence of an external module in the KDE project which centralizes all the translations. Later on these translations are automatically joined with the sources. Commits performed on unidentified file types (’unknown’) correspond also to a minimal portion of the pie. The shares of different file types depend of course on the module being studied. For instance, the module containing all the translations has a predominant green portion in its pie. Usually, modules containing applications or a set of applications have a pie that looks similar to the one shown for KOffice (mostly red), while modules devoted to web pages and documentation have a clear blue (documentation) and orange (images) appearance. It is interesting to notice some minor modules such as kdeedu (a KDE subproject that con-
Figure 2. Log-log representation of file types among KDE modules.
tains applications suited for education) which has an important portion of multimedia elements (that appear yellow and are labeled as sound in the pie).
Figure 3. Commits by file types for KOffice.
Besides pies, a different data visualization is obtained with heat maps. They can provide an idea of the specialization of commiters working on a given module. The idea is to show visually the correlation that exists between file types, given as a fraction. If this fraction is close to 1 it will correspond in the heat map with a hot zone, represented as a bright color (yellow or orange), while values close to zero will correspond to cold zones, represented by dark colors (like blue or gray). Black has been reserved as background color and also appears when no files of a given file type exist, or in the diagonal (that really should be yellow, since all
its values are 1) in order to make heat map reading easier. Examining figure 4 may illustrate how those heat maps work. The first row shows the correlation of documentation with all other file types considered in this study. As noted before, the intersection of documentation with itself has been left black. The second column shows the fraction of the commits to documentation that commiters have done to documentation and that have contributed both to documentation and images in the KOffice module. As it can be observed, this zone is very cold (blue is given when values lie between 0 and 0.2). The next column provides information about the number of commits done by those committing files to documentation and translations. As translation files are not included in the KOffice module, the zone is very cold, and it is colored in gray. On the other hand, the common contribution of commiters to documentation that have also contributed to the user interface and to development (fourth and sixth columns of the first row) is very high (more than 0.8) in the case of documentation. As there are no multimedia files in that time period, the whole multimedia column as well as its row have been left black. It is also interesting the case of the ’unknown’ type, as it may be useful to infer information about where to locate those types of files that are not well sorted by our heuristics. In the case of documentation we can see that this value is rather low (cold). It can also be noted that the relationship shown in heat maps has not to be symmetric, because although, for instance, the number of commits that commiters have done to documentation and translation is the same, the total number of commits to documentation and to translation is different. Since we have at our disposal data from the project history, we may also study the evolution of the specialization. Therefore, we have taken 10 equally large time slots from the first commit of a module to its present state, and produced a heat map for each time slot. In the case of KOffice, the first commit was done on 1998-04-18, while the last one considered in this study dates from 2004-03-22. Hence, the interval corresponding to each time slot lasts for about 216 days (a bit more than 7 months) of activity. Figure 4 corresponds to the time period from 2000-08-30 to 2001-04-04, while figure 5 corresponds to the time period three years later (exactly from 2003-08-18 to 2004-03-22). A closer look at both maps shows how there is a slight specialization (hotter/darker zones are more rare in the newer one) as well as a project expansion (there are more file types in the latter than in the former one).
5. Commiters Write access to the versioning system is not given to everybody. This privilege is usually given only to contributors who reach a certain degree of commitment with the
Figure 4. File type correlation heat map for the 5th time slot.
Figure 5. File type correlation heat map for the 10th (last) time slot.
project and the goals of the project. External contributions (commonly called patches, that may contain bug fixes as well as implementation of new functionality) from people without write access to the CVS repository are always welcome. It is a widely accepted practice to mark an external contribution when committing it with an authorship attribution. Therefore we have inferred certain heuristics to find and mark commits related to such contributions, although in this study we haven’t filtered those contributions out. In the following scatter plots any point corresponds to a commiter. The color of the point is given by the file type with which the commiter is being more active. Color assignation follows the rules used in the pies shown in the previous sections and are summarized in table 2. In one axis of the scatter plots are shown the contributions to a given file type, while in the other axis are provided contributions to some other file type. The distribution of commiters in the XY space gives an idea of the specialization of commiters as well as the possible relationships that may exist between different file types. In order to make the data offered by the scatter plots eas-
ier to work with we have taken the natural logarithm of the commits done by commiters to the whole repository. This means that only active commiters will be shown (those who have at least one commit in any of the two categories considered) and that the axis contains those commiters who have committed only one commit to a file type and one or more commits to the other one. This confronts us with the problem of commiters who haven’t done commits to one of the file types considered but with a considerable amount to the other. In order to also show them, we have considered commiters that have twenty or more commits 5 in one file type to have at least one commit to the other (if no commit had been done, this was added automatically). This should not be a dramatic distortion of the data and would give us valuable information specially about specialization of commiters. The first scatter plot we are considering is shown in figure , and presents development commits in the X axis and documentation in the Y axis. There are several interesting facts that can be learned from this figure. First, that the 5 ln(20)
is almost 3.
Table 2. Colors and shapes used to identify file type where most active in the scatter plots Color Shape File type Red Open rectangle Development Blue Plus (+) Documentation Green Open circle Translations Orange Filled rectangle Images Yellow Filled circle Multimedia Purple X User interface Gray Point Unknown
development ’population’ (red points) is by far larger than any other one. Second, that there is a natural split between documenters (blue) and developers (red), given by our way of coloring commiters by its highest contributing file type. It is also interesting the location of commiters whose primary task is none of these two: translators (green) are generally grouped with documenters, while those who work on the user interface (purple) appear in the red development dust. Third, among the most contributing commiters (log(commits) ¿ 10, also more than 20,000 commits) to the development file type we can find nine persons, but only five of them have development as their first activity. Two more are mainly translators (green points) and the other two are primarily documenters (blue points). Figure maintains the development commits in the X axis and sets in the Y axis the ones related to translations. It can be seen once more how there are several patterns followed by points of the same color. It is interesting the fact that the Y axis contains only green points, which means that many commiters only perform translation-related tasks. From this fact it can be inferred some degree of specialization in a project: almost half of the translators in the KDE project do not do any development activity. The situation of the blue points (documentation) in this scatter plot is also of great interest: there is a first group that lies between translators (green points) and developers (red points). The interpretation for this is not straightforward. One possibility is that there is a trend to get integrated into the project starting with translation work (which is pretty simple, since it only requires to have some knowledge of English and some other language), then contributing with some supporting task as documentation (which includes web pages) and finally landing on code development (which requires to have some knowledge on the platform and the technologies used, as well as some not so easy to acquire skills). Another curious fact about this scatter plot is that there are almost no large contributions from commiters which are not green, blue or red. As it was already mentioned, one of the weaknesses
Figure 6. Documentation vs development scatter plot.
of our identification heuristics is that it is hard to split documentation and images clearly as some images correspond to documentation. This is the case for instance for web pages or technical documentation in XML. Figure may throw some light into this problem. The first aspect worth mentioning is that documenters rarely do big contributions in documentation without also inserting images. All major documentation contributors have also an appreciable number of image commits. The second one is that many developers contribute both documentation and images (in fact, more images than documentation as the points are shifted towards the Y axis). As it was observed in a previous scatter plot, translators are also more tied to documenters than to images. The last scatter plot in figure highlights the commiters working on user interface tasks and development. The fact that can be inferred here is the number of persons dedicated to design and implement the user interface: it is rather small. There is also a noteworthy trend showing that while developers feature a larger contribution to development files, their contribution to user interface file types is also large. This may be interpreted in the sense that besides the very specialized group that works on user interface, all others start first by developing in the classical sense and as time passes and they acquire experience they also work on
Figure 7. Translation vs documentation scatter plot.
user interface. It is also possible to obtain a scatter plot of commiters for a module, and see if it corresponds to the general trend. Among the interesting facts that can be observed it can be highlighted how there are differences between a local color choice (in the sense that only commits by a commiter to the module are taken into account) and a global color choice (where all commits made by a commiter to the repository are considered). The number of “color changes” and the file types that are most affected may allow us to infer some conclusions.
6. Conclusions and further work The examination of source code allows for the discrimination of several types of files that reveal several “kinds” of source code. A deep study of them and of their evolution may help us to infer the importance that a program (or a project) attributes to certain tasks beyond generating source code (writing code in a programming language). These activities include documentation, translation, user interface design, generation of multimedia elements, etc. This paper also proposes a methodology and a software implementing it in the case that the sources are stored in a CVS repository, and that common conventions in the libre software world are used.
Figure 8. Images vs documentation scatter plot.
One of the main goals of this paper, which should be further researched, is the possibility of using objective criteria to characterize projects based on its activity in the aforementioned areas, and of studying the evolution of such activities over time. If data is available we can proceed to make the same study for a given part of the project (modules or subprojects) and even for the persons that are working on them (in the case of a CVS system, they are called commiters). Our first attempt has been to explore characterizations by assigning colors to the different tasks considered, and to visually recognize what types of module/commiter we have. Pending work includes studying correlations between modules and commiters. Future research should also focus on the evolution of modules and commiters over time, although some aspects have already been pointed out in this paper, specially in the case of commiters. The scatter plots have shown that there are several trends in the behavior of commiters, although they have not been proved in a deterministic way. Hence, we argue that many commiters evolve from translators to documenters, and finally to code developers. This same behavior arises with user interfaces, that require some previous activity in the development area.
Open Source Software Engineering, 25th International Conference on Software Engineering, pages 111–115, Portland, Oregon, 2003.
Figure 9. User interface vs development scatter plot.
References [1] R. Albert, A. L. Barabsi, H. Jeong, and G. Bianconi. Powerlaw distribution of the world wide web. Science, 287, 2000. [2] A. Capiluppi, P. Lago, and M. Morisio. Evidences in the evolution of os projects through changelog analyses. 2003. [3] M. W. Godfrey and Q. Tu. Evolution in open source software: A case study. 2000. [4] J. M. Gonzlez-Barahona, L. Lpez-Fernndez, and G. Robles. Community structure of modules in the apache project. 2004. [5] M. Lehman, J. Ramil, P. Wernick, and D. Perry. Metrics and laws of software evolution - the nineties view. 1997. [6] L. Lopez, J. M. Gonzalez-Barahona, and G. Robles. Applying social network analysis to the information in cvs repositories. In Proceedings of the International Workshop on Mining Software Repositories, 26th International Conference on Software Engineering, Edinburg, Scotland, UK, 2004. [7] G. Robles, S. Koch, and J. M. Gonzalez-Barahona. Remote analysis and measurement of libre software systems by means of the cvsanaly tool. In Proceedings of the 2nd ICSE Workshop on Remote Analysis and Measurement of Software Systems (RAMSS), 26th International Conference on Software Engineering, Edinburg, Scotland, UK, 2004. [8] G. Robles-Martinez, J. M. Gonzalez-Barahona, J. CentenoGonzalez, V. Matellan-Olivera, and L. Rodero-Merino. Studying the evolution of libre software projects using publicly available data. In Proceedings of the 3rd Workshop on
7. Appendix: File extensions In this appendix we will focus on the methodological part that is related to the identification of the file type as it is the most important for the goals of this paper. As it was mentioned before, the CVS logs are retrieved and parsed. We have included a procedure into CVSAnalY that enables the identification a file type by the inspection of its file name and specially by its extension. Hence, we’ve built a list of most common extensions and file names and later have gruoped them in several sets. Table 3 is a small excerpt of the grouping that has been created. As it can be noted, Table 3. Summary of file extension groups .c, .cpp, .java, .h, .py... Development file extensions readme*, changelog*... Development documentation configure*, makefile*... Building, compiling, conf... .html, .txt, .pdf, .xml... Documentation, web pages .png, .jpg, .gif... Images and graphics .po, .pot, .mo... i18n and l12n .desktop, .ui, .xpm... User interface .mp3, .ogg, .wav... Multimedia
There are some drawbacks in our classification method. The first and obvious one is that this is a heuristical procedure and hence cannot be proven to be exact in any case. Second we could mention that the heuristics could be enhanced in a simple way by looking at the content of the file for a given set of patterns that certify that the classification is correct or not. This is also a reasonable sugerence as we are working with source code that is in fact available. Besides, there are a set of file extensions that are hardly to classify in an accurate way. This is the case for instance for HTML and text files. Usually these types of files contain information targeted to humans, although it is difficult to assess if the target group are developers (in the wide sense including also those who don’t contribute code), users or just new-comers. We’ve decided to group all these pages in a set called “Documentation and web pages” (shortly documentation). Files that we find that usually are tied to the development process have been grouped in a different set called “Development documentation”, which includes files such as README, TODO, ChangeLog, HOWTO, etc. etc. On the other hand, in the study shown in this paper all development categories (development file extensions, development documentation and building, compiling, configuration, etc.) have been grouped into a unique set called generically “development”. Another case of uncertainty is the one related to images. Web pages usually make use of them, so they could have
been classified into the documentation category. We have seen in the case study in sections 3, 4 and 5 that there is a big correlation in projects and developers among these two file types. But there are images related to other means as application design, etc. Generally, our decision has been to put images and graphcis in the “Images” set, with the exception of very clear cases as the images with the “.xpm” extension that can be classified into the user interface set without trouble. File type identification and grouping has been tested with several huge CVS repositories and the precentage of files that cannot be classified (and that has been labeled as ’unknown’) lies under 5%. Further investigation of the repository allows to identify project-own file extensions and conventions which in some cases have lowered the unknown fraction under the 3% barrier. In any case, a detailed study is pending about the amount of false positives (those files that are wrongly assigned to a given set) that this method arises, although the manual audit we have done points out that this should be not a severe deficiency of the methodology.