Experiences Reverse Engineering Manually Dave Swafford ∆ #
[email protected] ∆
Diana Elman Ω #
[email protected]
Peter Aiken ∆ Ω #
[email protected]
Institute for Data Research - Information Systems/Virginia Commonwealth University Ω Global Settlement Technologies Group/Deutsche Bank Abstract
Better understanding manual reverse engineering can make it and any associated systems reengineering more effective. We reverse engineered a version of a system (referred to as "BOS/X") in support of a broader reengineering effort. System reengineering goals and other circumstances dictated a focused, limited duration, manual reverse engineering exercise. This presented an opportunity to study the BOS/X reverse engineering separately from other reengineering activities. We studied the BOS/X reverse engineering, the results achieved, and some limited reverse engineering metrics. This paper describes the: systems reengineering context; circumstances preventing application of automated techniques and motivating manual reverse engineering; reverse engineering process developed; BOS/X reverse engineering goals; evolution of the reverse engineering products; reverse engineering results; resources required to produce the results; and an evaluation of the reverse engineering effectiveness. Combined, these results may be used as measures – standards of comparison – that can be studied further – for example to determine potential areas for future automation application.
tion of automated RE techniques. Under these circumstances the goals remain the same but the RE must be performed manually in order to achieve the objectives. We performed a limited duration, manual RE exercise on a system version referred to as "BOS/X" and studied the results. The RE produced a functional description of BOS/X where none had existed previously. It successfully identified dozens of BOS/X functions that were highlighted for closer study as potential inputs to the BOS reengineering effort of which it was part. Most importantly, RE BOS/X provided a common basis for functionally mapping BOS-2 and a taxonomy basis for future discussion. In this paper we present the results of our study of the focused, limited duration, manual BOS/X RE. We reverse engineered BOS/X in order to understand its functionality that had evolved separately from the overall system. Circumstances enabled us to study the BOS/X RE separately from the broader reengineering activities. From this we understand more about the process of RE manually, the nature of the results achieved, and utility of some RE metrics. These can provide some initial measures against which future RE projects can be assessed.
2 1
Jeff Merhout ∆ #
[email protected]
Reverse Engineering Context: BOS Reengineering
Introduction 2.1 Research Sponsor: ITG
Reverse engineering (RE) is "the process of analyzing a subject system with two goals in mind: (1) to identify the system's components and their interrelationships; and, (2) to create representations of the system in another form or at a higher level of abstraction" [1]. Various types of RE (system, software, data, and database, etc.) have been automated. (See numerous examples in [2].) Often it is performed the context of a larger reengineering project [3] RE often requires a combination of manual as well as automated techniques (see [4] and [5]). Situational factors and/or operational contexts can prevent the applica#
The research sponsor was an International Technology Group (ITG). ITG developed business operational systems (BOS) for its parent financial institution. Various BOS versions supported three distinct business lines operating at locations worldwide. A recent reorganization had consolidated a number of formerly separate development teams as well as those supporting a recent business acquisition into the ITG. As a result, a combined staff of more than 500 developers supported sites in thirteen countries.
Please note that the author names are listed in a random fashion to denote equal contributions.
In recent months ITG had successfully and elegantly accomplished Euro and Y2K conversions, winning praise and earning the confidence of ITG customers. The ITG customers were the system users. Buoyed by recent successes, they were literally throwing money at ITG and demanding new BOS functionality. The customers had confidence that an investment of tens of million of US dollars would result in ITG delivering BOS-2 - a reengineered BOS with increased business functionality. ITG planned to use the opportunity to re-implement BOS using modern model-based development methodologies (including data centric design), new processing efficiencies, and object-oriented programming languages.
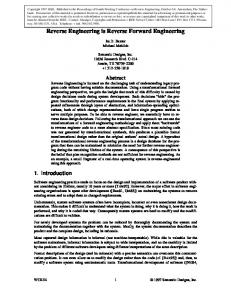
Each versions was started by compiling the reference system into load modules. These core programs provided the basic system functionality common to all versions. Subsequent build steps replaced and extended the program/table/matrix collection comprising that version. Programs were replaced by alternate versions implementing business line, site, and location specific requirements. These either complemented existing functionality or replaced specific programs. Program versions implemented line-of-business-specific functionality were introduced during build stage two. The third stage configured the version for differences in hardware platforms. Locality specific business line variations were incorporated during the fourth build stage.
2.2 BOS Technical Characteristics 2.4 Documented BOS System Functionality The ITG had implemented BOS using a now-obsolete vendor-specific code variant of a common business programming language that ran on the vendor's hardware. A decade later BOS was run on different computer using emulation partitions. Many different BOS versions existed - each varying among a combination of business line support, location specific and site-specific characteristics. Each version of BOS consisted of more than six million lines of code organized into approximately two thousand programs with approximately four thousand associated files. BOS used flat file technology – it had no database capabilities. Among the thousands of files were hundred tables and matrices that provided system flexibility. Tables and matrices controlled processing steps. Unforeseen situations were often corrected by adding new table or matrix entries or system parameters.
2.3 BOS Build Architecture Figure 1 illustrates how BOS versions were developed from common source code designated as the reference system.
Three possible line of business variations Line of Business 2
Line of Business 3
Nine possible site-specific location variations L1
L2
L3
L4
L5
L6
L7
order -> trade -> position keeping -> clearing -> settlement -> accounting -> reporting [6] While other financial institution's systems provided similar functionality, three BOS features strategically differentiated the product: 1) BOS was real time – as opposed to batch-oriented; 2) BOS supported simultaneous multi-currency operations; and 3) the BOS table and matrix architecture permitted it to handle a multitude of events, products, and situations and future expansion of functionality appeared feasible.
2.5 BOS Reengineering Goals BOS was the result of literally thousands of person years of development effort and it represented one of the largest and most valuable assets of the financial institution. It was clear that the institution could not afford to re-develop BOS from scratch. BOS-2 was planned as a system reengineering effort based on a coordinated RE of BOS and then a forward engineering of BOS-2. There were several BOS reengineering goals.
Reference System
Line of Business 1
BOS supported global financial market operations. It was described as "a real time, multi-currency, investment/private banking and foreign exchange/money market system application." A high level of integration between front and back office functions supported a financial transaction life cycle comprised seven stages:
L8
L9
• Thirteen possible location-specific variations
Figure 1
Four-stage build process resulting in many BOS versions.
•
BOS-2 was partly driven by increases in business transactions requiring processing. Another goal was to change many ITG development staff member roles from maintenance to support enhancement of fewer BOS-2 versions. This would permit better system positioning - to respond to anticipated changes in the business environment.
• • •
The recent take-over motivated management to eliminate redundant systems. RE would be used to understand and describe overall BOS component functionality. Reduction in the number of BOS versions and concomitant reduction in the overall maintenance complexities.
From this understanding, selected, detailed BOS component descriptions would be extracted. Each component would be described using object, data, process and functional decomposition models integrated with business rules. These descriptions would be used to re-implement them as BOS-2 components using more efficient architectures, modern development technologies, and objectoriented programming language. BOS-2 would also incorporate increased business functionality, new processing technologies, and modern data handling technologies. In support of the reengineering, ITG had been supporting a multiyear, data RE effort of BOS. This effort had resulted in the first ever set of conceptual models describing the core BOS functionality. The Data Architecture Group had produced a conceptual enterprise model and thirteen individual business-subject area models describing large parts of BOS functionality. These were to form the basis for developing the BOS-2 data architecture.
3
BOS/X Reverse Engineering Analysis Goals
BOS/X had long been supported by a separate development organization ("X" is short for "Location X"). In early 1999, corporate reorganization almost doubled the size of the ITG. As a result, BOS/X system functionality was now included in the scope of the BOS reengineering effort. The BOS/X developers had enhanced it with specific functionality that didn't exist in other BOS versions. For example, BOS/X was the only BOS version that supported US-specific, market/financial operations and tax reporting capabilities. In addition, ITG hardware could not process the transaction volume required by the business. Much of the routine BOS/X functionality had been outsourced to an outsourcing vendor several years previously. The outsourcer had modified some of the BOS/X code to run under CICS on two IBM mainframes. Reduction in the per transaction costs incurred for this outsourcing was a major motivation to bring this business back in-house. As planning for the reengineering progressed it became clear to the ITG that expanded customer business requirements and desired development economies clearly
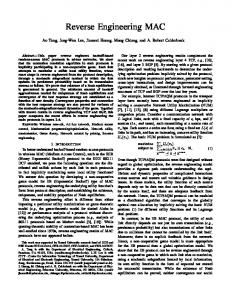
dictated that certain BOS/X functionality must be identified, recovered, reused, and successfully integrated into BOS-2. Unfortunately, only sketchy documentation describing the BOS/X functionality existed and there was little basis communicating within the new, larger ITG about BOS/X functionality. ITG management needed to evaluate specific BOS/X functionality had been outsourced as well as understanding that functionality used to process the non-routine transaction for possible its utility to BOS reengineering. A previously unforeseen RE was required in order to understand BOS/X functionality. The ITG approached the Institute for Data Research with an urgent need to perform a targeted, limited scope, RE analysis. (The Institute was already on-site assisting the ITG in other capacities.) The Institute - supplied as reverse engineers two graduate students who possessed in addition to the requisite RE skills, domain expertise in the area of financial planning and several years of financial systems and data analysis. The RE goals were to identify BOS/X components whose functionality should be considered for inclusion into BOS-2. The RE had to be accomplished within a three-week period in order to meet aggressive BOS reengineering goals. The RE would identify the BOS/X component functionality, identify the component interrelationships, and create a BOS/X functional decomposition [7]. A management chart (Figure 2) articulated the BOS/X the desire for specific BOS/X functionality to be incorporated into BOS-2. The top half of the figure illustrates the ongoing Data Architecture Team-based data RE of the conceptual BOS functionality as part of BOS reengineering. The bottom half illustrates the specific research charge given to the BOS RE team (referred to as BOS-RT). DBTRADER ENTERPRISE FDD*
Conceptual Architecture Model
BOS
Logical Architecture Model
BOS-2 Architecture √
√ √
Functional Decomposition
BOS/X
Figure 2
•
A
B
C X
√
X
?
√
√
X
?
X
Within 6 months prepare the desired components for inclusion into BOS-2
Management chart describing the role of RE BOS/X.
Analyze BOS/X and develop a functional decomposition to the describe its component functionality
•
•
Categorize each component's functionality as: "√" Largely unique to BOS/X and desirable as a part of the BOS-2 architecture (also indicated by shaded boxes) "X" Largely similar to existing BOS functionality "?" Indeterminate functional utility Perform further analysis as required in order to determine whether each "?" should really be a "√" or an "X"
Non-technical considerations also motivated ITG management to request an independent group to perform the RE of BOS/X. •
•
•
•
•
4
The BOS/X development team had been newly integrated into the ITG. There existed potential for rivalry and system loyalty among various development teams. Early discussions of system functionality had been unproductive due to the use of the same labels to describe different functionality (functionality homonyms) or use of different labels to describe similar functionality (functionality synonyms). These discussions demonstrated a clear need to model the functions and define each in clear, unambiguous terms. In addition, the newness of the development team integration could have created suspicions that the "other side" wasn't hearing and/or understanding what was being said during the discussions. Having the RE performed by an unbiased third party eased the suspicions and provided a basis for the use of non-system specific terminology. The impending corporate take-over had created some fear of staff reductions. The lack of substantive system documentation made the participation of the BOS/X developers especially important. An impartial BOS-RT reduced the fear of "hidden agendas" of biased results reporting and facilitated communication between BOS/X develops and the BOS-RT. A final motivation articulated by ITG management was to look for individuals who seemed to have knowledge, skills, and abilities that might compliment the existing reengineering team capabilities. These individuals might be tapped to play an increased role in subsequent reengineering activities.
Characteristics Preventing Automated Approaches to Reverse Engineering
Circumstances and situational characteristics prevented the BOS-RT from using automated RE tools and techniques.
The three-week analysis timeframe left two weeks of preparation time. Given the specific research charge from ITG, the utility of automated tools and techniques was questionable. Existing system artifacts consisted largely of the vendor-specific code. Tools could be adopted to handle the vendor-specific variations within the required time period. While the team was familiar with a number of automated tools and techniques, there simply wasn't time to acquire and implement substantive automated RE tools and techniques in time to deliver useful results. The lack of time was effectively countered by investment of sufficient ITG resources in the manual RE. Code volume was also an issue. Automated parsing of six million lines would have required analysis of two millions lines each week or 400,000 lines of code daily. This volume would have prohibited comprehension on the part of the BOS-RT analysts and would have produced results at too fine a level of granularity to be of use the ITG management. A final factor was the previous outsourcing of the routine BOS/X functionality. It was unlikely that the vendor would permit the financial institution to reverse engineer their system – especially with ITG goal of eliminating that portion of the vendor's business.
5
Manually Reverse Engineering BOS/X
The RE goal was to produce a preliminary analysis of the functions performed by BOS/X with an eye toward potential future component reusability. It was understood that the preliminary analysis would precede more detailed reverse engineering of the BOS/X functions thought likely to be included in the POS-2. The preliminary analysis was to be represented using functional decomposition models. Stevens, Myers, and Constantine defined functional decompositions as the first formal method of describing entire systems [8]. Functional decomposition describes a system as a well-structured hierarchy of functional modules with higher level functions described solely as aggregates of lower level functions. The decomposition process continues until it has reached the point of diminishing value. Figure 3 illustrates a sample functional decomposition.
System Functions
Function 1
Subfunction 1.1
Figure 3
Function 2
Subfunction 1.2
Function 3
A sample functional decomposition.
The BOS-RT began RE by reviewing its existing sources of evidence. These consisted of:
• • •
Evidence acquisition
• • • •
Evidence analysis
Analyzing the evidence for appropriateness and model component development potential
Straw model development
Creating candidate model components
Model refinement/ validation
•
Subfunction 1.3
5.1 Sources of Evidence
•
Reverse Engineering Analysis Cycle (repeated until completed) • Evaluating and incorporating previous Cycle cycle results planning • Identifying area of highest risk of lack of knowledge • Specifying RE targets and a plan for the current cycle
A text containing detailed descriptions of the subject domain that is used as a "bible" for introducing newcomers to the securities industry [9]. The thirteen conceptual, business-subject area models completed by the Data Architecture Team. Assorted, out of date descriptions of various system versions. A list of potential subject matter experts who could provide information about system versions. Time with these individuals was tight and had to be carefully utilized due to on going development demands and travel schedules.
During a casual discussion with some developers during the first day of analysis, the BOS-RT discovered that a "gap analysis" between BOS and BOS/X had been performed in 1994. The single remaining copy of this 100 (+) page document was obtained by the BOS-RT. It described sixty-four specific differences between the BOS and BOS/X. While much of the information was too detailed to be of much use, analysis of it did play an important role confirming assumptions and otherwise validating the BOS-RT team findings.
5.2 Reverse Engineering Analysis Plan The RE followed established cyclical RE steps for evolving a gradual understanding of BOS/X. The RE cycle consisted of six activities performed generally sequentially but with many different variations and specific sequences dictated by factors such as the discovery of new sources of evidence and subject matter availability. The RE cycle is illustrated in Figure 4.
• • Model storage and organization
Figure 4
Collecting evidence Cataloging evidence Structuring evidence Looking for missing evidence
Identifying changes in the model as a result of errors, new knowledge, and normalization Documenting changes and further refining models Validating models using appropriate techniques
Collecting, cataloging, and structuring models for archival and configuration management purposes
RE cycle activities [10].
Cycles involved planning phases for determining the greatest risk and/or uncertainty and defining it as the focus of the next analysis cycle. The team obtained evidence that addressing the risk/uncertainties. They analyzed the evidence, often refining the criteria and analysis methods based on the results obtained. As they gained confidence in their results, they shaped a model component. When analysis was complete and the model component had been developed, it was validated with the experts and refined based on feedback. Once validated the new components were integrated into the existing structure and published for subsequent use.
5.3 Obtaining Analysis Results Model refinement and validation sessions were accomplished using a variety of formats: • • •
Question/answer sessions lasting just a few minutes to clarify issues. Structured interviews were more prolonged versions of question/answer sessions aimed at focused, efficient information transfer. Model refinement and validation sessions where candidate models were presented experts for refinement and validation [11].
5.4 Validation Strategy: Confirmatory Analysis
100.00%
During the analysis the BOS-RT took the approach of attempting to confirm each piece of evidence that they received. Evidence from one source would be incorporated into the model in draft form and then validated. This approach required that model components using the evolution described by Figure 5 - requiring at least two cycles to become validated. Reverse Engineering Analysis Activities
Cycle 1 Evidence status
Cycle 2 Evidence status
Cycle planning
Assessed
Not validated
Evidence acquisition
Created
Needing confirmation
Evidence analysis
Analyzed
Becoming Confirmed
Straw model development
Modeled
Refined
Model refinement/ validation
Validated by primary source
Validated by secondary source
Model storage and organization
Accessible to secondary source
Accessible to subsequent analyses
Figure 5
6
Two modeling cycles were required for evidence to become validated model components.
66.67%
33.33%
0.00% M o n
Figure 6
T u e
W e d
T h u
F r i
M o n
T u e
W e d
T h u
F r i
M o n
T u e
W e d
T h u
Division of labor between meetings and analysis.
The BOS-RT participated in a total of 35 meetings with fifteen different experts including the executive team responsible for sponsoring the RE analysis. Figure 7 illustrates the pattern of meeting held during the RE analysis as somewhat constant. 5 4 3 2 1 0 M o n
T u e
W e d
T h u
F r i
M o n
T u e
W e d
T h u
F r i
M o n
T u e
W e d
T h u
Studying the Reverse Engineering Figure 7
The BOS-RT maintained journals chronicling their analysis activities. Using these sources, we were able to determine and report a number of statistics providing insight into how the BOS-RT spent its time. Analysis of the journals kept indicated that a total of approximately 150 hours logged by each reverse engineer over the almost three-week period. The two engineers worked in parallel as much as possible. Approximately, one third of their time was spent working individually - reviewing documentation, hunting for evidence, coordinating meeting schedules, etc. Onethird of their time was spent working together on combined analytical tasks. The shaded area of Figure 6 illustrates time spent in meetings - one third of their time with the subject matter experts.
Total number of meetings held.
Figure 8 details the amount of time spent meeting one-on-one with specific experts. Obviously TM was crucial to the RE analysis. About half of the interviewees (DM, PA, MY, PG, BM, DE) were generalists. Those with whom the team met for just one meeting were generally specialists who supplied specific evidence that was later verified by others or they were the verifiers of evidence supplied by the generalists.
the BOS-RT regrouped, assessed what it had learned, and determined the best course of action for the next cycle. Approximately one third of the way through the analysis, a review meeting was held. The initial fifteen areas had been decomposed into a total of eighty-four different subfunctions and subsubfunctions. The BOS-RT also had made an initial determination as to which function/subfunctions likely possessed functionality that was unique to BOS/X. These were reviewed with the management sponsor who provided some confirmation, clarification, and corrections to the evolving functional decomposition. Figure 9 illustrates the subfunction distribution - describing 71 separately identifiable functions, subfunctions and subfunctions comprising the results of the initial RE analysis.
TM DM PA MY PG BM DE JF IS MS SA SC RS RY AM
0
1
2
3
4
5
6
7
Cumulative Hours of Meeting Time
Figure 8
Meeting time analysis by individual.
Function Number 15
0-?
14
0-? 8-√
13
7
Evolution of the Analysis Product
The analysis progress can be also described by illustrating the progressive evolution of the final analysis product. The pattern described below was repeated with many slight variations for the fifteen individuals consulted for each of the thirty-five meeting that were held. The initial version of the product was derived from a two hour structured interview with system expert TM. TM had been involved with BOS/X for more than a decade and had coded major portions of it. TM was a senior manager. When asked to describe the major BOS/X functions, TM was initially puzzled having never had to consider the describing BOS/X this fashion. He pulled out an organizational chart and indicated that the system functionality could be seen in these terms. This resulted in an initial definition of fifteen different functional areas. These were labeled as Function 1.0 – Function 15.0. The BOS-RT then asked TM for his educated assessment of whether each function was unique to BOS/X or whether the functionality was shared with BOS/CORE. His responses were also recorded on the spreadsheet. The BOS-RT then requested documentation describing functions in detail. A final set of questions involved identifying individuals on his staff with whom BOS-RT could spend time decomposing each of the core functions into subfunctions. Meetings were established with these individuals. When available, documentation was accessed and analyzed prior to the meetings. After each set of meetings,
9-X
12
4-X
11 10
0-X 2-?
9
3-X
8
4-√
7
5-√
6
9-X
5 4
0-√ 4-X
3 2 1
3-? 5-√ Number of Subfunctions
Figure 9
Distribution of 71 functions and subfunctions after completion of one-third of the analysis.
Also this meeting, it was decided that the final product should use "system neutral" BOS/2 functional terminology to avoid biasing the analysis in favor of either BOS/CORE or BOS/X. Management requested that the BOS-RT map each system to the BOS/2 functionality. Conceptually, this change represented a larger analysis scope than had originally been anticipated. The new product (illustrated in Figure 10) would provide a roadmap indicating from which system version the compo-
nents that would be reengineered into BOS/2 would originate. Arrows on the figure indicate that a specific component from either BOS/CORE or BOS/X would be considered for detailed reverse engineering as part of BOS/2 reengineering. The BOS-RT continued with the analysis cycles, flushing out new BOS/X functionality, validating new model components, and refining the requested analysis product for the remaining two weeks left for the analysis.
final version also includes the designation "M" for mixed. As postulated by the project sponsor some of the unique BOS/X functionality was only able to be determined at the subfunction and subsubfunction levels. The final analysis also referenced the experts who were consulted. The final analysis contained 50(+) indications of potentially reusable system components. In addition, several developers were identified as being quite helpful and were noted for possible participation in subsequent reengineering activities.
BOS-2 Functionality BOS/CORE Functionality
BOS/X Functionality
Figure 10
8
9
Final analysis product illustrating specific components targeted for detailed reverse engineering.
Reverse Engineering Analysis Results
At the conclusion of the analysis, the BOS-RT had created a representation of the system that had not previously existed, incorporating multiple levels of abstraction. The functional decomposition of BOS/X contained 194 functionalities comprised of 19 functions, 131 subfunctions, and 63 subsubfunctions as well as associated definitions. The distribution of these components is illustrated in Figure 11. 19
2-?
18
2--?
17 0-√
15
0-√
14
3-M
13
From:
[email protected] Subject: Re: Progress Report MIME-Version: 1.0 TO:
[email protected] CC:
[email protected],
[email protected]
3-M
Folks, the results I saw last night were excellent.
12
14-M
11
28-M
10
5-X 0-X
8
4-√
7
5-X
6
6-M
5 4
This research has described the motivations for the application of manual RE techniques, their implementation, the results achieved, along with some limited analysis metrics. Specific lessons learned included a surprising amount of information that was derived without accessing the source code. The limited duration, manual RE produced a preliminary analysis of the target system functionality where none had existed previously. It resulted in a functionbased means of comparing two systems. It successfully identified dozens target system components that warranted closer investigation for potential reuse during the larger reengineering effort. The RE provided a common basis and vocabulary for discussing subsequent reengineering steps. Finally, while it is really insufficient to state that management was quite happy with the results the following e-mail indicates management's pleasure.
22-M
16
9
Lessons Learned
13-X 0-√
3
7-√
2 1
Figure 11
9-M 8-√
Summary of final RE results.
As in Figure 9, the final utility of functions is illustrated using the checks, X's and questions marks. This
The clear message from management was "All right we've gotten enough information here – this is far enough for this analysis to proceed – now let's categorize it – formalize it - store it – make it accessible." Understanding the reverse engineering process better prepares us to derive requirements for RE automation and tool support from cost effectiveness and process effectiveness perspectives. These provide future opportunities to the forecast cost of development and application of automation. The process described here can be applied in other contexts. By formalizing the manual reverse engineering
process, other similar projects within the organization suddenly gained credibility as this process has been repeated several times for other versions of the BOS. Again, the management motivations were expressed in very simple terms, "I want that (referring to the reverse engineering analysis outputs) for my system." The process of developing analysis products that identify a system's components and their interactions representations of the system in another form - is a classic, even text-book example of reverse engineering. Working quickly and effectively the analysis team was able to provide the ITG with valuable models of the system where no such models had previously existed. This same process can be repeated in other contexts and should prove a useful model for other organizations. Probably the most important lesson was that an academically based team was able to provide useful results to a real world business problem in time to be relevant.
10 Acknowledgements This paper benefited from the insightful comments provided by Michael Blaha and several anonymous reviewers belonging to a previous conference program committee.
References 1
IEEE Computer – Society Technical Council on Software Engineering – Reengineering & Reverse Engineering Terminology available online at http://www.tcse.org/revengr/taxonomy.html
2
Proceedings of the Working Conferences on Reverse Engineering May 21-23, 1993, Baltimore, MD – Los Alamitos, CA: IEEE Computer Society Press – 233 pages. Toronto, Ontario, Canada July 14-16, 1995 – Los Alamitos, CA: IEEE Computer Society Press – 335 pages. — Monterey, CA – Los Alamitos, CA: IEEE Computer Society Press – 312 pages. October 6-8, 1997, Amsterdam, The Netherlands – Los Alamitos, CA: IEEE Computer Society Press – 248 pages. October 12-14, 1998, Honolulu, Hawaii – Los Alamitos, CA: IEEE Computer Society Press – 256 pages.
3
D. Connall D. Burns "Reverse Engineering: Getting a Grip on Legacy Systems" Data Management Review October 1993, pp. 24-27.
4
Michael R. Blaha "The Case for Reverse Engineering" IT Professional March/April 1999 1(2):35-41.
5
Peter H. Aiken "Reverse engineering of data" IBM Systems Journal 1998 37(2):246-269.
6
Internal company records dated 1995.
7
Elliot Chikofsky and James H. Cross II "Reverse Engineering and Design Recovery: A Taxonomy" IEEE Software January 1990 7(1):13-17.
8
Wayne Stevens, Glen Myers, and Larry Constantine "Structured Design" IBM Systems Journal May 1974 13(2):115-139.
9
David M. Weiss After the Trade Is Made: Processing Securities Transactions New York: Prentice Hall Trade ISBN: 0131776010 – 512 pages.
10
Aiken, P.H., Data Reverse Engineering: Slaying the Legacy Dragon. 1996, New York: McGraw-Hill. 394 pages (ISBN 0-07-000748-9).
11
E. Carmel, R. Whitaker, J. George "PD and Joint Application Design: A Transatlantic Comparison" Communications of the ACM June 1993, 36(4):40-47.