International Journal of Modeling and Optimization, Vol. 7, No. 3, June 2017
Experimental Study and CFD Modelling of Minimum Fluidization Velocity for Geldart A, B and D Particles Widuramina S. Amarasinghe, Chameera K. Jayarathna, Bovinda S. Ahangama, Britt M. E. Moldestad, and Lars-Andre Tokheim
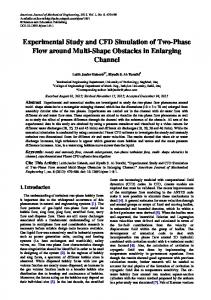
instance in fluidized bed combustion or reaction systems involving solid catalysts. Basically, fluidization is achieved by sending a pressurized fluid through the particulate medium. The main application of fluidization related to this study is separation of different particulate materials applied in CO 2 capture by calcium looping with indirect calciner heat transfer [1] using hot inert alumina particles to transfer heat to a sorbent made of calcium carbonate, hence facilitating calcination to calcium oxide and CO2. The zirconia material is based on downscaling CaCO3 particles from hot-flow pilot-scale to cold-flow lab-scale conditions, whereas the steel and bronze particles are based on downscaling two different sizes of the alumina particles. Information about the minimum fluidization velocities, and the behavior of the particles before, during and after the minimum fluidization conditions, is crucial for the design of the above-mentioned separation process. Geldart’s powder classification scheme is used to classify particles according to size and density, as shown in Fig. 1. There are four main areas. As per Fig. 1, zirconia, bronze and steel represent A, B and D groups, respectively. The zirconia particles are small (70 µm) and have a relatively low density (3830 kg/m3). Aerated particles should fluidize easily without forming bubbles at low gas velocities. In this area, significant bed expansion can be expected before bubble formation starts [2]. Even though shows that the zirconia particles are on the borderline between group A and B zirconia has been considered as group A particles due to the quick bubbling formation under low velocities observed during fluidization. Luis et al. have found the minimum fluidized velocity for zirconia particles as 0.024 m/s by using zirconia particles with 30 µm particle size and 5890 kg/m³ primary particle density while investigating particle agglomeration conditions [3].
Abstract—The aim of this study is to determine minimum fluidization velocity of three different particles which represent different Geldart classification groups and to compare the results with computational results. The experiments were conducted using a fluidized cylindrical cold bed with uniform air distribution. The three particulate materials use were zirconia, bronze, and steel, classified as Geldart A, B and D particles, respectively, and the minimum fluidization velocities were found to be 0.015, 0.07 and 0.27 m/s, respectively. Using the commercial CPFD software Barracuda, the fluidized system was simulated using the Wen-Yu and Wen-Yu-Ergun multiphase flow models. The CPFD-determined minimum fluidization velocities for zirconia, bronze, and steel were found to be 0.008, 0.08 and 0.23 m/s, respectively, corresponding quite well with the experimental results for Geldart B and D particles. Index Terms—Barracuda, fluidization, Geldart classification, minimum fluidization velocity, pressure drop, Wen-Yu, Wen-Yu-Ergun.
I. NOMENCLATURE = Drag function [1/s] = Particle drag force [N] = Gravitational acceleration [m/s2] = Particle mass [kg] = Fluid pressure [N/m2] = Reynold`s number = Particle radius [m] = Time interval [s] = Particle velocity [m/s] = Particle volume [m3] = Particle position [m] = Restitution coefficient [-] = Particle volume fraction at close pack condition = Fluid volume fraction [-] = Particle volume function [-] = Fluid viscosity [Pa*s] = Fluid density [kg/m3] = Particle density [kg/m3] = Average particle density [kg/m3] = Fluid stress tensor [N/m2]
II. INTRODUCTION The fluidized bed is one of the best-known solids-gas contacting methods used in the processing industry, for
Fig. 1. Geldart`s particle classification diagram (particle size vs particle density) [2]
Manuscript received January 30, 2017; revised May 12, 2017. The authors are with University College of Southeast Norway, Norway (e-mail:
[email protected]).
The bronze particles have the characteristics of group B, “sand-like” or “bubbly” particles. Here, excess bubbles will 152
International Journal of Modeling and Optimization, Vol. 7, No. 3, June 2017
appear when the minimum fluidization velocity is exceeded, and the bubbles can grow to large sizes in this regime [4].
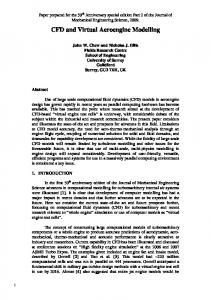
III. EXPERIMENT SETUP AND PROCEDURE An in-house built lab-scale fluidized bed (see Fig. 2 and Fig. 3) was used to measure the minimum fluidization velocity of pure zirconia, steel, and bronze under a uniform airflow. The bed is cylindrical with a height of 1.4 m and a diameter of 0.084 m and is made out of Lexan plastic. There are pressure sensors placed along the bed with a 10 cm distance between them. Sierra mass flow controllers are used to adjust the airflow by means of a pressure reduction valve. A LabVIEW® program is installed on a PC to log the data via a controller unit. The bed material was added manually from the top of the cylinder. Then the air flow rate was gradually increased until the slugging regime was reached. The air flow rate and pressure values were logged at regular intervals. This procedure was followed for all particle types. A summary of parameters related to the experiment are shown in Table I. The particle size distribution was measured using a laser diffraction instrument by considering the projected volume of the particles.
Fig. 2. Snapshot of the experimental setup.
The steel particles are comparatively large and dense. Fig. 1 indicates that the steel particles are on the borderline between group B and D, but they can be considered belonging to group D due to the behavior observed during fluidization. When the velocity is increased, jets can form in the bed, and materials can be blown off with the jet in a spouting motion. Such particles may be difficult to fluidize in deep beds. Bubbles coalesce and grow in size rapidly, and severe channeling can be observed if the fluidization gas is not well distributed [4]. There has been a study done by O. Molerus to interpret all the Geldart group particles by considering cohesion forces which is a governing factor for the minimum fluidization velocity [5]. Apart from that several studies have been conducted to investigate the minimum fluidization behavior of different particles (with different particle sizes and densities) experimentally and numerically which represent different groups in Geldart diagram [1], [6], [7]. This study basically focuses on how will the experimental and CFD modelling of the minimum fluidization of particles of group A, B, and D in Geldart diagram can be differed. The particle regimes were selected based on the observations during the fluidizations and the mean particle size (X50) of the particles even though particle samples represented a range of particles sizes.
TABLE I: DATA RELATED TO THE EXPERIMENTS Bed Design Height (m)
1.2
Diameter (m)
0.084
Particle Properties
Zirconia
Bronze
Steel
Particle size range (µm)
50-120
130-230
230-400
69
164
290
3830
7790
7800
Mean particle size, X50 (µm) Envelope particle density (kg/m³)
Fluidization Air Properties (at 1 atm and 20 °C) Density (kg/m3) Dynamic viscosity (N·s/m²) [8]
1.23 17.83×10⁻⁶
IV. COMPUTATIONAL SCHEME AND MODEL The continuity equation and momentum equation for the gas phase without reactions and interface mass transfer are given by Eq (1) and (2), respectively [9], [10]. Here is the volumetric momentum exchange rate between gas and particles. (1)
The rate of momentum transfer between fluid and solid phases per unit volume is given by Eq (3) where is the particle probability function. (3) The time evolution of can be obtained by the Liouville equation as given in Eq (4) for the particle distribution function.
Fig. 3. Fluidized bed system.
153
International Journal of Modeling and Optimization, Vol. 7, No. 3, June 2017 TABLE II: MODEL COEFFICIENTS
(4)
Wen-Yu
The particle acceleration balance is given in Eq (5). In CPFD software Barracuda, particle interactions are modelled by using an efficient particle stress function. Hence, the particle normal stress is given by Eq (6) [9], [11] where is a constant with the units of pressure and is a constant with a recommended value between 2 and 5 while is a very small number depends on the application.
Wen-Yu-Ergun
The computational mesh used for the simulations is shown in Fig. 4, A single mesh element has the shape of a cube with a single side dimension around 15 mm. The mesh has 8700 control volumes. Fig. 4 shows the transient points that have been used to monitor the pressure values to obtain the pressure drop. The distance between the two points is 10 cm.
(5)
(6) The commercial computational particle fluid dynamics (CPFD) software Barracuda was used to simulate the system using available drag models., The Wen-Yu and Wen-Yu-Ergun fluidization drag models gave the best results [12] [13]. A brief description of the Wen-Yu drag model is given below. The fluid drag on a particle is given by Eq (7) and the drag function in the Eq (7) is given by the Eq (8).. (7) Fig. 4. Computational mesh used for simulations.
(
The drag coefficient is a function of Reynolds number ) and the fluid volume fraction ( ), as seen in Eq (9)-(11)
(10) (11) Fig. 5. Transient points to monitor the total pressure in the computational system.
The Wen-Yu-Ergun drag model is a combination of the Wen-Yu and Ergun drag models. In this combined model, the drag function in Eq (7) is defined as follows:
V. RESULTS AND DISCUSSION (12)
Experiments, as well as simulations, were conducted for zirconia, bronze, and steel particles. A summary of the results is shown in TABLE, and graphs showing the minimum fluidization velocities, based on measured pressure drop and gas velocity values, are shown in Fig. 6-8 for zirconia, bronze, and steel, respectively.
(13) (14) Here, is equal to the is defined in Eq (15).
function defined in Eq (8), and TABLE III: SUMMARY OF EXPERIMENTAL AND COMPUTATIONAL RESULTS
(15) The default values used in CPFD software Barracuda for the coefficients in the Wen-Yu model and Wen-Yu-Ergun model are given in TABLE I. [14]
154
Particle type Zirconia
Geldart group A
Bronze
B
Steel
D
Minimum fluidization velocity (m/s) Experiment Simulation 0.015 0.008 (Wen-Yu) 0.08 0.07 (Wen-Yu-Ergun) 0.23 0.27 (Wen-Yu-Ergun)
International Journal of Modeling and Optimization, Vol. 7, No. 3, June 2017
of particles can lead the particles to be effectively bigger particles and hence higher fluidization velocities can be expected during the experiment [15] Another contribution to the discrepancy could be that the particle size distribution was not exactly the same in the computational model as in the experiments. Accurately specifying the PSD in Barracuda is important for correct prediction of the minimum fluidization velocity and the bed pressure drop, especially for smaller particles. In Fig. 9-Fig. 11 snapshots from the simulation of zirconia, bronze and steel particles, respectively, are shown as a function of increasing air velocities. The zirconia particles get fluidized at 0.008 m/s, which is a low value compared to the bronze and steel fluidization velocities. In Fig. 10. it can be clearly seen that there is a significant bed expansion just before bubbling starts around 0.013 m/s. The bed expansion was observed during the experiments as well. These are clear characteristics of group A behavior, which justifies the classification of zirconia particles as belonging to group A. Fluidization of bronze particles was observed at 0.08 m/s in the simulations as shown in Fig. 9. Excessive bubble formation is observed at velocities higher than the minimum fluidization velocity, and bubbles grow rapidly with increased velocities. These phenomena, which are among the core characteristics of group B particles, were observed in the experiments as well. The steel particles are fluidized at a velocity between 0.22 and 0.25 m/s. Above 0.25 m/s, bubbling starts. Steel particles are considered as group D particles, which are likely to generate large consolidated bubbles, and above a velocity of 0.25 m/s, bubbles do consolidate and generate larger bubbles. This behavior was observed during the experiments and can also be seen in Fig. 11 at 0.3 m/s. This justifies the classification of steel particles as being group D particles.
Fig. 6. Pressure drop vs superficial gas velocity for zirconia particles.
Fig. 7. Pressure drop vs superficial gas velocity for bronze particles.
Fig. 8. Pressure drop vs superficial gas velocity for steel particles.
Fig. 10. Simulated bronze volume fractions at different gas velocities (m/s). Fig. 9. Simulated zirconia volume fractions at different gas velocities (m/s).
The experimentally determined minimum fluidization velocities and the simulated values were approximately the same for bronze and steel particles, but not for the zirconia particles. Drag model coefficients are usually determined based on data fitting of experimental data generated by fluidization of different particle types. The coefficients used in Barracuda may be not optimized for particles laying on the boundary between the A and B areas in Geldart classification chart (see Fig. 1). Furthermore, agglomeration of particles into clusters
Fig. 11. Simulated steel volume fractions at different gas velocities (m/s).
155
International Journal of Modeling and Optimization, Vol. 7, No. 3, June 2017 Chameera K. Jayarathna is a final year Ph.D. student working in the area of carbon capture with calcium looping Technology. He is employed at the research institute Tel-Tek and is doing his Ph.D. at the University College of Southeast Norway. He has a MSc degree in process technology (Telemark University College, Norway, 2009) and a BSc degree in process engineering (University of Moratuwa, Sri Lanka, 2005). He is also working as a scientist and project manager at Tel-Tek, Porsgrunn, Norway, since 2010 and he has participated in several different projects related to carbon capture and storage. Chameera Jayarathna work with solid classification, particle fluidization, flow simulations (CFD, CPFD), process simulations and experimental works during last 10 years.
VI. CONCLUSION The experimentally determined minimum fluidization velocities for zirconia, bronze, and steel were found to be 0.015, 0.07 and 0.27 m/s, respectively. The corresponding values from the Barracuda simulations were 0.008, 0.08 and 0.23 m/s. The Wen-Yu and Wen-Yu-Ergun drag models gave the best results compared to the other drag models available in CPFD software Barracuda. The investigated zirconia, bronze and steel particles can be classified as Geldart A, B, and D particles, respectively. This classification fits with experimental data as well as the Geldart diagram. The CFD predictions for Geldart B and D particles corresponded well with the experimental data. However, the simulated results for the A particles need further investigation, as these were not in line with the experimental results.
Widuramina S. Amarasinghe is a second year master student in process technology (University College of Southeast Norway (HSN), Porsgrunn, Norway, 2017) who is currently involved with his master thesis (Waste heat availability in the raw meal department of a cement plant). He has a BSc in chemical and process engineering (University of Moratuwa (UOM), Sri Lanka, 2015). He has involved in some teacher assistant positions at HSN for 1st-year master students in MatLab and Python programming. Also, he has worked as a research assistant for an experiment Setup assembling and experiment running for a fully integrated calcium looping system. Widuramina`s main research interests are particle technology, energy and optimization, process modeling and simulations, CFD simulations and experimental work.
ACKNOWLEDGMENT We would like to thank Franz Otto von Hafenbrädl at Tel-Tek and Øyvind Johansen at USN for their support during the experimental work and Dr. Hiromi Ariyaratne at USN for commenting on the manuscript. REFERENCES [1]
[2]
[3]
[4] [5]
[6]
[7]
[8] [9]
[10] [11] [12]
[13] [14] [15] [16]
C. K. Jayarathna, B. M. Holvorsen, and L. A. Tokheim, "Experimental and theoretical study of minimum fluidization velocity and void fraction of a limestone based CO2 sorbent," GHGT-12, 2013. D. Geldart, "Gas Fluidization Technology," Berichte der Bunsengesellschaft fÜr Physikalische Chemie, vol. 91, no. 6, pp. 678-679, Juni 1987. L. F. Hakim, J. L. Portman, M. D. Casper, and A. W. Weimer, "Fluidization behavior and conformal coating of nanoparticles in fluidized beds by ALD," AIChE Annual Meeting, Austin, 2004. C. Dechsiri, "Introduction to fluidization," in Particle Transport in Fluidized Beds, Groningen, 2004, pp. 8-24. O. Molerus, "Interpretation of geldart's type A, B, C and D powders by taking into account interparticle cohesion forces," Powder Technology, vol. 33, no. 1, pp. 81-87, 1982. M. Ye, M. A. V. D. Hoef, J. A. M. Kuipers, "A numerical study of fluidization behavior of geldart A particles using a discrete particle model," Powder Technology, vol. 139, no. 2, pp. 129-139, 2004. C. K. Jayarathna and B. M. Holvorsen, "Experimental and computational study of particle minimum fluidization velocity and bed expansion in a bubbling fluidized bed," SIMS 50, Fredericia, Denmark, 2009. J. C. Dixon, "Properties of Air," in The Shock Absorber Handbook, Chichester, UK, John Wiley & Sons, Ltd, 5 NOV 2007, p. Appendix B. D. M. Snider, "An incompressible three-dimensional multiphase particle-in-cell model for dense particle flows," Journal of Computational Physics, vol. 170, pp. 523-549, 2001. D. Gidaspow, "Multiphase flow and fluidization," Continuum and Kinetic Theory Description, London, Academic Press, Inc, 1993. C. K. K. Lun, S. B. Savage, D. J. Jeffrey, and N. Chepurniy, "Kinetic theories for granular flow: Inelastic particles in Couette flow and slightly inelastic particles in a general flowfield," Journal of Fluid Mechanics, vol. 140, pp. 223-256, 1984. C. Y. Wen and Y. H. Yu, "Mechanics of fluidization," Chemical Engineering Progress Symposium Series, vol. 62, pp. 100-111, 1966. C. Y. Wenand Y. H. Yu, "A generalized method for predicting the minimum," A.1.Ch.E. Journal, pp. 610-612, May, 1966. L. CPFD Software, "Selecting a drag model," in User manual, 2017, pp. 65-66. W. Pietsch. Powder and bulk solids. (2008). [Online]. Available: http://www.powderbulksolids.com/article/what-agglomeration.
156
Bovinda S. Ahangama was born in Sri Lanka in 1983 and has MSc degree in system and control engineering from University College of Southeast Norway, Porsgrunn, Norway in 2015 and has a BSc degree in apparel manufacturing engineering from University of Moratuwa, Sri Lanka in 2009. He is currently working as a research assistant at the research institute Tel-Tek, and has worked as a research assistant for the experiments of a fully integrated calcium looping system at University College of Southeast Norway, Porsgrunn in 2016. He has 3 years work experience as a senior planning engineer in MAS Active (pvt) Ltd, Sri Lanka. Mr. Ahangama’s research interests are powder technology, control system, and automation & instrumentation. Lars-André Tokheim has a Ph.D. degree in combustion (Telemark University College (TUC), Porsgrunn, Norway, 1999), MSc degree in industrial environmental technology (TUC, 1994) and a BSc degree in chemistry (TUC, 1992). He is professor of Process Technology at TUC since 2006, where he teaches heat & mass transfer and gas purification, supervises MSc and Ph.D. students, and coordinates master study programs in process technology and energy & environmental technology as well as a Ph.D. study program in process, energy & automation engineering. He has industrial experience from Norcem/Heidelberg Cement since 1994; as a Research Scholar (1994-1998), as a process engineer in the production department (1998-2001), and as head of the Department for Process Development and Environment (2001-2006). Prof. Tokheim’s main research interests include the use of alternative fuels in cement production and gas pollution reduction. B. M. E. Moldestad has her master in process technology from Telemark University College. The PhD degree is from Norwegian University of Science and Technology and is in the field flow behavior in fluidized bed. Her research work includes both experimental and computational multiphase studies. She has worked within the field of fluidization since 2000. She is employed as professor at the University College of Southeast Norway in the field Process Technology.