Care must be taken when carrying over the results of a simulation to real markets. .... As you can see, the equilibrium price slowly but surely moves towards 1,.
Experimenting with a Market Simulation Michael de la Maza and Deniz Yuret
1 Introduction At the turn of the century, Texas wildcatters would decide were to dig for oil by taking a pinch of sand from the ground and tasting it. Their methods were uninformed by any understanding of the causal processes that led to the formation of oil deposits. Everett Lee De Golyer, known as the Father of American Geophysics, was the rst to introduce scienti c methods into the oil discovery eld on a wide scale. As a result, he become a multimillionaire in an age in which a million dollars was still a lot of money. The money management industry today is similar to the oil industry at the turn of the century. Virtually all of the trillions of dollars that are actively managed are managed by seat of the pants methods that are similar to digging for oil by tasting sand. However, in recent years a growing number of individuals and companies have dedicated themselves to applying the methods of science and engineering to the stock market. Those who have been successful in doing so have made fortunes and there are many more fortunes to be made. In this article, we take another step in this direction by applying our understanding of genetic algorithms to the market. This article describes a simulation of a market in which individuals evolve trading strategies and compete against each other to maximize pro ts. Why simulate instead of studying real markets? Simulations have several advantages over direct observation:
� The parameters of the simulation can be endlessly modi ed in order to
provide greater understanding. � Simulations are typically much faster than real markets, therefore many more experiments can be done. � The investigator has very ne-grained control over the simulation. 1
However, there are some disadvantages associated with simulations:
� Care must be taken when carrying over the results of a simulation to
real markets. They may not apply. � A simulation necessarily involves abstraction, and this abstraction may leave out some of the most important elements of the market. � A trader who makes a million dollars in a simulation has not made a million dollars! The simulation described here does not capture all of the subtleties and nuances of the market. Its implementation contains many simpli cations and assumptions. Nevertheless, it gives insight into how some market participants may be able to consistently uncover pro t-making opportunities. This article begins by discussing the details of this simulation. Then, a set of three experiments with the simulation are described and analyzed. Finally, the article suggests a four parameter model of participants that we have found helpful in characterizing what are the relative advantages and disadvantages of a market participant.
2 Details of the simulation Our market simulation consists of a series of days. A day contains four steps: 1. Each participant computes a fair price for a security. In our simulation, there is only one security in the entire market and each participant is forced to submit a bid during each day. 2. An equilibrium price, which balances the buyers and sellers, is computed from the fair prices submitted by each participant. The equilibrium price is the median of the fair prices. 3. Participants whose fair prices are above the equilibrium price buy at the equilibrium price, and participants whose fair prices are below the equilibrium price sell at the equilibrium price. Thus, for every security that is sold, a security is bought and so one participant's gain is another participant's loss. No transaction fees are charged. 2
4. Participants improve their bidding strategies by using a genetic algorithm. Each individual has a visible strategy which it uses to compute the fair price. In addition, each individual has a set of invisible strategies that cannot be directly perceived by other market participants. These strategies are updated using a traditional genetic algorithm. The visible strategy is the strategy that performed the best during the last day and it is updated every day. The strategies that individuals can learn are very simple. They consist of a quadruple a, b, c, d of four real numbers and the fair price is computed by the formula: ( )= � + � + � + where is the ten day moving average of the equilibrium prices; is the last equilibrium price; and is 1 if the last change in equilibrium prices is positive, -1 if it is negative, and 0 otherwise. Suppose, for example, that the visible strategy of a market participant is 1, 2, 3, 4 and that the ten day moving average is 12, the last equilibrium price is 11, and the last change in equilibrium prices is negative. Then, the fair price compute by this strategy is: 1 � 12 + 2 � 11 + 3 � ?1 + 4 = 35. If there are four participants which submit fair prices of 33, 34, 35, and 36 then the equilibrium price is 34.5. The two participants who submitted fair prices below 34.5 sell the security at 34.5 and the two participants that submitted fair prices above 34.5 buy the security at 34.5. The participants are forced to liquidate their holdings at the equilibrium price of the next round. So, if the equilibrium price is above 34.5, then the two participants who purchased the security at 34.5 will make money and the two participants who sold the security will lose money. On the other hand, if the equilibrium price is below 34.5 the two participants who sold the security at 34.5 will make money and the two participants who purchased the security will lose money.
f a; b; c; d
a
x
x
b
y
c
z
d
y
z
3 Experiments This section describes three experiments that we have done to explore various facets of our simulation. In all of the experiments, there are four participants 3
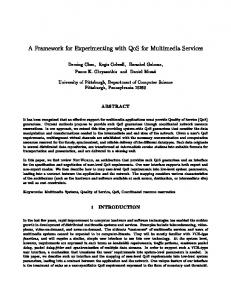
1.4
Ten day moving average Equilibrium price
1.2 1 0.8 0.6 0.4 0.2 0 0
50
100 Day
150
Figure 1: Equilibrium price as a function of time. The ten day moving average, the last equilibrium price, and the sign of the last change are all random numbers between -5 and 5. who trade.
3.1 E�ect of noise
Some market pundits say that the market makes many unexplainable moves that will eventually wipe out all strategies. Separating the signal from this noise is thought to be one of the hardest problems facing all traders. Can market participants still uncover good market strategies in the face of noise? That is the question that this experiment is designed to test. In this experiment, the ten day moving average, the last equilibrium price, and the sign of the last change are all replaced with random numbers between -5 and 5 and the equilibrium price is set to 1. Thus, the optimal strategy is 0, 0, 0, 1 , which re ects the decision to ignore the three noisy variables. A ten day moving average of the equilibrium prices is shown in Figure 1. As you can see, the equilibrium price slowly but surely moves towards 1, indicating that the participants are able, over time, to ignore the noise in the information provided to them.
4
200
60 50 40 30 20 10 0 0 10 20 30 40 50 60 70 80 90100 Day
Figure 2: Pro t of most pro table individual as a function of time. This data is averaged over ten runs of the simulation. Because participants are forced to liquidate their holdings with some probability, the pro t does not approach 0.
3.2 Forced liquidations
This experiment tests what e�ect forced liquidations have on pro ts. Market participants must sometimes liquidate their holdings for a variety of reasons { they get hit with lawsuits, they want to send their children to college, or they have substantial losses in real estate. In this experiment, a participant, with probability .2, is forced to report a fair price that is one half of the fair price computed by its visible strategy. This gives market participants who do not have to liquidate their holdings the opportunity to make substantial pro ts. Figure 2 shows how the pro t of the most pro table participant changes over time. Initially, the pro t rises and then drops sharply, but it never reaches zero as the participants who do not have to liquidate take advantage of those who do. In contrast, Figure 3 shows the pro t in an experiment in which participants are not forced to liquidate. In this case, the pro t quickly approaches zero as the participants lock in on optimal trading strategies.
5
140
2.5
120
2 100 80
1.5
60
1
40
0.5 20
0
0 0
5
10
15 Day
20
25
30 40 50 60 70 80 90 100 Day
30
Figure 3: Pro t of most pro table individual as a function of time. This data is averaged over ten runs of the simulation. The pro t approaches 0 because the participants are able to learn optimal strategies.
3.3 Sharing strategies
In our nal experiment we studied what happens to pro tability when the market participants share their visible strategies. As shown in Figure 4 the pro tability of the most pro table experiment drops sharply. This gure should be compared to Figure 3 which shows the pro tability of the most pro table participant when no sharing occurs. This experiment helps to explain why most of the results published in the eld of stock market analysis are negative. Sharing pro table strategies really does reduce pro tability for everyone.
4 Understanding market participants As a result of these experiments we have arrived at a four parameter model of market participants. Each market participant can be characterized along these four dimensions:
� Constraint set. Is the participant beholden to shareholders or investors? Do pro ts have to be reported on a monthly, quarterly, or yearly basis? At what rate can the participant borrow capital? What securities and markets can the participant trade? 6
45
0.16
40
0.14
35
0.12
30 0.1
25 20
0.08
15
0.06
10
0.04
5
0.02
0 0
5
10
15 Day
20
25
30
0 30
40
50
60
70
80
90
Figure 4: Pro t of most pro table individual as a function of time. This data is averaged over ten runs of the simulation. Pro t quickly approaches 0 because the participants are sharing their visible strategies.
� Information set. Does the participant have access to end of day data,
minute data, or tic data? Is information about order ow available? Does the participant have access to oor traders or market makers? � Algorithm set. Does the participant use pencil and paper to explore the space of trading strategies? Backpropagation? Genetic algorithms? Dynamic hill climbing? � Model set. Is the participant restricted to linear models? Can if-then rules, previous market scenarios, and stochastic di�erential equations all be employed to represent market knowledge? A large Wall Street investment bank is likely to have a constraint set and an information set that places it at an advantage relative to the individual trader. The Wall Street rm has a much deeper capital base than the individual trader and, on a single position, is likely to be willing to withstand much greater losses. In addition, the investment bank has access to the order
ow of many traders around the globe, and can borrow capital at a much lower rate. In response, the individual trader must work to have superior algorithms and models than the investment bank. To a large degree this magazine, and this article, are dedicated to providing that advantage. 7
100
At our own money management rm, Red re Capital Management Group, we only trade markets in which we have a considerable advantage along one or more of these four dimensions.
5 Conclusion We plan to extend the simulation described in this article in at least two ways. First, the algorithm and model sets of all of the participants in these experiments are the same { only the constraint sets and information sets change. In the future we will pit participants with di�erent algorithm sets and model sets against each other. Second, this simulation contains only one security and all of the participants are required to purchase or sell a security during every round. Our future market simulations will have multiple securities and the participants will have the option of not trading. We have applied some of the insights that we have gained from doing this and related research to our own trading accounts. We participated in the 1993 U.S. Investing Championships (options division) and nished fth with a 43.9% return over a period of four months. To leverage this success we have formed a money management rm, called Red re Capital Management Group, that employs arti cial intelligence methods, including simulations similar to the ones described here, to create fully automated trading strategies for interest rate, currency, and equity markets. We trust that other market a cionados will nd these simulations equally helpful.
References [1] M. de la Maza and D. Yuret. A futures market simulation with nonrational participants. In R. Brooks and P. Maes, editors, Proceedings of the Fourth International Workshop on the Synthesis and Simulation of Living Systems, pages 325{330, 1994. [2] D. Goldberg. Genetic Algorithms in Search, Optimization and Machine Learning. Addison-Wesley, Reading, MA, 1989. [3] T. J. Sargent. Bounded Rationality in Macroeconomics. Clarendon Press, Oxford, 1993. 8
[4] D. Yuret and M. de la Maza. A genetic algorithm system for predicting the OEX. Technical Analysis of Stocks & Commodities, pages 58{64, June 1994.
9