{muratak,kamer,selcuk,zahir}@cs.bilkent.edu.tr. Abstract. An analytical calculation of the success probability in linear and differential cryptanalysis was recently ...
Experiments on Probability of Success in Linear and Differential Cryptanalysis Murat Ak, Kamer Kaya, Ali Aydın Sel¸cuk, Zahir Tezcan Department of Computer Engineering Bilkent University Ankara, 06800, Turkey {muratak,kamer,selcuk,zahir}@cs.bilkent.edu.tr
Abstract. An analytical calculation of the success probability in linear and differential cryptanalysis was recently given by Selcuk et al. using statistical methods. In this paper, we present the results of an experimental study to test the validity of these calculations with several variants of DES as the target cipher. Our results show a good deal of agreement between the theoretical and experimental results, but they also point out some limitations of the analytical calculation. Key words. Block ciphers, linear cryptanalysis, differential cryptanalysis, success probability.
1
Introduction
Differential cryptanalysis (DC) [1] and linear cryptanalysis (LC) [2, 3] are two of the most important techniques in block cipher cryptanalysis today. Recently, Selcuk et al. [6, 7] proposed an analytical calculation of the success probability of linear and differential cryptanalysis. The results were useful as a tool for a direct calculation of the success probability of these attacks techniques. But they were also potentially limited for being based on a number of assumptions, some of which had not been verified. In this paper, we present the results of an experimental study that was carried out to test the validity and accuracy of the calculations of Selcuk et al. [6, 7] with various attack scenarios. The experiments use variants of DES as the target cipher and vary according to the number of key bits attacked, number of rounds of the target cipher, the bias of the linear approximation, or the the signal-tonoise ratio of the differential characteristic. We work with the generalized definition of the term “success” as defined in [6, 7]: If an attack on an m-bit key gets the correct value as the rth candidate among the 2m possibilities, the attack is said to have provided an (m − lg r)-bit advantage over exhaustive search. For instance, the traditional, more strict definition of success, where the attack discovers the right key as the first candidate, corresponds to obtaining an m-bit advantage over an m-bit key. Throughout the paper, φ and Φ are used to denote the probability density and the cumulative
distribution functions of the standard normal distribution; B is used for denoting the binomial distribution. The rest of this paper is organized as follows: After presenting the results of the experiments for the success probability in linear cryptanalysis in Section 2, the results for differential cryptanalysis is presented in Section 3. Section 4 concludes the paper.
2
Experiments on Success Probability in Linear Cryptanalysis
In order to perform a linear attack, first, a linear approximation for the cipher is needed. A linear approximation is a binary equation of the bits of the plaintext, ciphertext, and the key, which holds with a probability p 6= 1/2. The quantity |p−1/2|, known as the bias, is a measure of correlation among the plaintext, ciphertext, and key bits. The attacker collects a large number of plaintextciphertext blocks, and for each possible key value he counts the number of blocks for which the linear approximation holds. Assuming that the right key will give a significantly higher bias for the approximation, the key that maximizes the bias over the sample is taken as the right key. 2.1
Review of the Analytical Results
In this section, we give an overview of the results developed in [6, 7] regarding the success probability of a linear attack. Recall the problem from [6, 7], where an attacker is interested in getting the right key ranked within the r top candidates among a total of 2m keys, where an m-bit key is attacked, with an approximation of probability p, using N plaintext blocks. Let k0 denote the right key and ki , 1 ≤ i ≤ 2m − 1, be the wrong key values, and let n denote 2m − 1. Let Xi = Ti /N − 1/2 and Yi = |Xi |, where Ti is the counter for the plaintexts satisfying the approximation with key ki . The Ti counters have a binomial distribution, B(N, p0 ) for T0 and B(N, pW ) for Ti , i 6= 0. We denote these distribution functions by F0 and FW , and their density functions by f0 and fW , respectively. Let Wi , 1 ≤ i ≤ 2m − 1, be the Yi , i 6= 0, sorted in increasing order. Distribution of Wi is modeled by order statistics. For an overview of the subject, see [4, 6, 7]. The main assumptions of the analytical calculation can be summarized as follows: 1. In a typical attack, N is very large and therefore binomial distributions for Ti counters can be approximated by normal distributions. 2. Ti values are independent and that they are identically distributed for i 6= 0. That is, all pi , i 6= 0, are identical. This probability is denoted by pW . 3. Distribution of the ordered counters Wi can be approximated by the normal distribution. By these assumptions, the following main results were obtained for the success probability of a linear attack: 2
Theorem 1 (Selcuk et. al. [6, 7]). Let PS be the probability that a linear attack, as defined by Algorithm-2 in [2], where all candidates are tried for an mbit subkey, in an approximation of probability p, with N known plaintext blocks, delivers an a-bit or higher advantage. Assuming that the approximation’s probability is independent for each key tried and is equal to 1/2 for all wrong keys, we have, for sufficiently large m and N , � √ � PS = Φ 2 N |p − 1/2| − Φ−1 (1 − 2−a−1 ) . (1) Corollary 1 (Selcuk et. al. [6, 7]). With the assumptions of Theorem 1, N =
�
Φ−1 (PS ) + Φ−1 (1 − 2−a−1 ) 2
�2
· |p − 1/2|−2
(2)
plaintext blocks are needed in a linear attack to accomplish an a-bit advantage with a success probability of PS . Selcuk et. al. [6, 7] also gave a more precise, direct calculation of the success probability of a linear attack for the special case a = m (i.e., when the right key is to be ranked the highest) which does not use normal approximation for order statistics: �2m −1 Z ∞ �Z x fW (y) dy f0 (x) dx PS = −x
0
=
Z
∞ √ −2 N|p−1/2|
Z
√ x+2 N|p−1/2|
√ −x−2 N|p−1/2|
φ(y)dy
!2m −1
φ(x)dx ,
(3)
again assuming the independence of the counters and the normal approximation for the binomial distribution. 2.2
Experimental Results
For a practical evaluation, we implemented two of Matsui’s 8-round DES attacks [3] and compared the actual success probability to the results of Eq. 1. To test the results of theoretic calculations, we implemented two attacks. The parameters for these attacks are given in Table 1. First attack uses a 6-round DES approximation with a bias 1.95 · 2−9 and targets the keys of S5 in the first and the eighth rounds, with 12 key bits in total. Second attack uses a 7-round DES approximation with a bias 1.95 · 2−10 and targets the keys of S5 in the Attack No # of key-bits # of rounds Apprx. Rounds Bias 1 12 8 6 1.95 · 2−9 2 6 8 7 1.95 · 2−10 Table 1. Parameters of the experiments
3
N=2
1
N=2
1 N=2
N = 218
0.8
P(rank(k0) ≤ r)
20
N = 216
0.6
19
0.8
N = 217
P(rank(k0) ≤ r)
N=2
19
0.4
0.2
N=2
18
0.6
0.4
N = 217
0.2
0
N = 216
0 0
100
200
300
400
500
600
700
800
900
1000
1
2
3
4
r
5
6
7
8
9
10
r
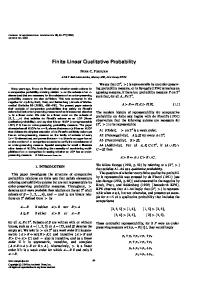
(a) Attack No.1. The results for the first attack in the range 1 ≤ rank(k0 ) ≤ 1000. The bias of the linear approximation is 1.95 · 2−9 . The theoretical and experimental results are mostly indistinguishable.
(b) Attack No.1. The same plots with a focus on the range 1–10 for the first attack. Now a difference can be observed, especially when the top ranking probability is of concern. The theoretical and practical results are still indistinguishable for N = 220 .
1 N = 220
P(rank(k0) ≤ r)
0.8
N = 219 N = 218
0.6
N = 217
N = 216
0.4
0.2
0 5
10
15
20
25
30
r
(c) Attack No.2. The results for the second attack in the range 1 ≤ rank(k0 ) ≤ 32. The bias of the linear approximation is 1.95 · 2−10 .
Fig. 1. A comparison of Eq. 1 with the experimental success rates. The plots with the linespoint style show the experimental results; those with the lines style are PS according to Eq. 1.
4
20
eighth round, which has 6 bits.1 In the experiments, the attack is run 10,000 times for each value of N . The success probability according to Theorem 1 and the experimental results are compared in Figure 1. Figure 1 shows that Eq. 1 gives a quite precise calculation of the success probability for most cases. Note that the experimental results of the second attack, where m = 6, is also very accurate. This shows that normal approximation for order statistics still works well even for m = 6, that is n = 63. We observe that when the top ranking probability is of concern a 15% error rate is possible. To test whether this error originates from the normal approximation for order statistics, we made ceratin numerical tests using Eq. 3, which does not use this approximation. A numerical comparison of Equations 1, 3, and the experimental results is given in Table 2. We can see that the results of Eq. 3 is closer to experimental results than Eq. 1.
N 216 217 218 219 220
(1) 0.043 0.181 0.592 0.968 0.999
(3) 0.038 0.159 0.539 0.949 0.999
Exp. 0.033 0.151 0.509 0.930 0.999
N 216 217 218 219 220
(a) Attack No. 1
(1) 0.075 0.149 0.320 0.633 0.931
(3) 0.065 0.129 0.276 0.562 0.886
Exp. 0.063 0.115 0.253 0.509 0.844
(b) Attack No. 2
Table 2. The top ranking probability P (rank(k0 )) = 1 according to Equations 1, 3 and the experimental results.
To summarize, the experiments on LC presented in this section have found the analytical calculations given in [6, 7] to be quite accurate. A small inaccuracy observed for the top ranking probabilities can mostly be eliminated using Eq. 3.
3
Experiments on Success Probability in Differential Cryptanalysis
Differential cryptanalysis, developed by Biham and Shamir [1], is a chosenplaintext attack that exploits the correlation between the input and output differences of a pair of plaintext blocks encrypted under the same key. The first step in a differential attack is to find a characteristic of the cipher attacked. A characteristic is a sequence of differences between the round inputs in the encryption of two plaintext blocks with a given initial difference. For a characteristic 1
The benefit of using DES in the experiments is that, it was observed in [5] that the bias of linear approximations of DES-like ciphers can be estimated accurately by the piling-up lemma [2], which is not always the case for other ciphers (e.g., RC5). Hence, using DES as the test cipher, the experiments can be conducted free of the errors that would result from a miscalculation of the bias.
5
to be useful in an attack, a plaintext pair with the given initial difference must have a non-trivial probability to follow the given sequence of differences during encryption. Having obtained such a characteristic, the attacker collects a large number of plaintext-ciphertext pairs with the given initial difference. Assuming that the characteristic is followed at the inner rounds of the cipher, each pair will suggest a set of candidates for the last round key. When a pair is a “right pair”, which followed the characteristic, the actual key will always be among the keys suggested. If the pair is “wrong”, it may be detected and discarded, or, otherwise, it will suggest a set of random keys. After processing all collected pairs and counting the keys they suggest, the key value that is suggested most will be taken as the right key. An important measure for the success of a differential attack is the proportion of the probability of the right key being suggested by a right pair to the probability of a random key being suggested by a random pair with the given initial difference. This proportion is called the “signal-to-noise ratio”. Biham and Shamir [1] observed a strong relation between the signal-to-noise ratio and the success chance of an attack. By empirical evidence, they suggested that when the signal-to-noise ratio is around 1–2, about 20–40 right pairs would be sufficient; and when the signal-to-noise ratio is much higher, 3–4 right pairs would usually be enough. 3.1
Review of the Analytical Results
In this section, we give an overview of the results developed in [6, 7] regarding the success probability of a differential attack. The notation used is similar to that in LC: m is the number of key bits attacked and N denotes the total number of pairs analyzed. k0 denotes the right key, ki , 1 ≤ i ≤ 2m − 1, denote the wrong keys. pi is the probability of ki being suggested by a plaintext pair; Ti counts the number of times ki is suggested. Wi , 1 ≤ i ≤ 2m − 1, denote Ti , i 6= 0, sorted in increasing order. The probability of the characteristic is denoted by p, and µ = pN denotes the expected number of right pairs. pr is the average probability of some given key being suggested by a random pair with the given initial difference. SN denotes the signal-to-noise ratio, p/pr . The assumptions used in the development of the analytical results for DC are the same as those used for LC: The binomial counters Ti can be approximated by the normal distribution; the Ti counters are independent and are identically distributed for i 6= 0; and the distribution of the ordered counters Wi can be approximated by the normal distribution. Accordingly, the following main results were obtained for the success probability: Theorem 2 (Selcuk et. al. [6, 7]). Let PS be the probability that a differential attack on an m-bit key, with a characteristic of probability p and signal-tonoise ratio SN , and with N plaintext-ciphertext pairs, delivers an a-bit or higher advantage. Assuming that the key counters are independent and that they are identically distributed for all wrong keys, we have, for sufficiently large m and 6
N , and µ denoting pN , PS = Φ
�√
µ SN − Φ−1 (1 − 2−a ) √ SN + 1
�
.
(4)
Corollary 2 (Selcuk et. al. [6, 7]). With the assumptions of Theorem 2, √
N =
SN + 1Φ−1 (PS ) + Φ−1 (1 − 2−a ) SN
�2
p−1
(5)
plaintext-ciphertext pairs are needed in a differential attack to accomplish an a-bit advantage with a success probability of PS . Similar to that in LC, a more precise, direct calculation of the success probability of a differential attack was also given in [6, 7] for the special case a = m (i.e., when the right key is to be ranked the highest) which does not use the normal approximation for order statistics: PS (m) = =
Z Z
∞ −∞ ∞ −∞
�Z
�2m −1
x
fW (y) dy −∞ Z x√SN +1+√µ SN −∞
f0 (x) dx
φ(y)dy
!2m −1
(6)
φ(x)dx ,
(7)
again assuming the independence of the counters and the normal approximation for the binomial distribution. 3.2
Experimental Results
Table 3 summarizes the attacks used in the experiments we conducted to test the validity of the analytical calculations. In the experiments, DES is taken as the target cipher and the characteristics used are taken from [1]. Attack 4 is chosen as an attack with a high SN ratio. Attacks 1–3 are chosen as attacks with a low SN ratio with a range of different m values. For the first and last attacks we used a 3-round characteristic and for the third attack we used a 5-round characteristic. For the second attack we applied a 2-round iterative characteristic 1.5 times and obtained a characteristic with 3 rounds. The second column of the table shows the characteristics used in the attacks with a reference Attack no. Characteristic S-boxes 1 pg.37 5 2 pg.48 4, 5 3 pg.42 6, 7, 8 4 pg.37 2, 5, 6, 7, 8 Table 3. Parameters of
7
m # of rounds p 6 6 1/8 12 6 1/46 18 8 1/3496 30 6 1/16 the experiments.
SN 2 5.6 1.2 216
1
1
0.9
P(rank(k0) ≤ r)
P(rank(k0) ≤ r)
0.9 0.8
0.7
0.6 Equation 4, µ = 16 µ=8 µ=4 Experimental, µ = 16 µ=8 µ=4
0.5
0.4 5
10
15
20
0.8
0.7 Equation 4, µ = 20 µ = 10 µ=5 Experimental, µ = 20 µ = 10 µ=5
0.6
0.5
25
30
10
20
30
40
r
0.9
0.9
P(rank(k0) ≤ r)
P(rank(k0) ≤ r)
1
0.8
0.7 Equation 4, µ = 96 µ = 48 µ = 24 Experimental, µ = 96 µ = 48 µ = 24 10
20
30
40
50
70
80
90
100
90
100
(b) Attack No. 2; SN = 5.6
1
0.5
60
r
(a) Attack No. 1; SN = 2
0.6
50
60
70
80
0.8
0.7 Equation 4, µ = 12 µ=6 µ=2 Experimental, µ = 12 µ=6 µ=2
0.6
0.5 90
100
10
r
20
30
40
50
60
70
r
(d) Attack No. 4; SN = 216
(c) Attack No. 3; SN = 1.2
Fig. 2. A comparison of Eq. 4 and the experimental success rates.
8
80
to the page numbers in [1]. The third column shows the S-boxes attacked in each experiment. The fourth and fifth columns show the number of attacked key bits m and the number of rounds of the target DES cipher, respectively. p is the probability of the characteristic used and SN is the signal-to-noise ratio. Fig. 2 gives a comparison of the analytical results by Eq. 4 and experimental evaluation of the success probability for various differential attacks with the parameters in Table 3. The results show that Eq. 4 is not very accurate, especially when a relatively low success probability is of concern. When 99% success probability values are of interest, the equation gives a quite reliable estimate for PS . As mentioned in Section 3.1, the first assumption of the analytical calculation is that the Ti counters can be approximated by the normal distribution. To check the effect of this assumption on the inaccuracies observed, we plotted PS using the binomial distributions without the normal approximation. Recall that in [6, 7] the success probability is formulated as PS = P (T0 > Wr¯) Z ∞Z x = fq (y) dy f0 (x) dx . 0
(8)
−∞
where fq is the density function of Wr¯ and depends on the density function fW . If we use f0 = B(N, p0 ), fw = B(N, pW ) in Eq. 8, we remove the effect of the first assumption on the success probability. Fig. 3 gives a comparison of the analytical results by Eq. 8 and experimental evaluation of the success probability for the differential attacks. The figure shows that Eq. 8, although provides better results for attacks 3 and 4, is not much more accurate than Eq. 4. Another assumption used for the calculations was the normal approximation to order statistics. To check the effect of this assumption, we compared the experimental results to the the top ranking success probability according to Eq. 6, which does not make use of this assumption. Again, we use the original B(N, p0 ) and B(N, pW ) for f0 and fW without the normal approximation. The results are summarized in Table 4, which show that although Eq. 6 is somewhat more accurate than Eq. 4, considerable error rates still remain. We conclude that the analytical formulations given in [6, 7] for the success probability in DC are less accurate than those given for LC. Although we tried alternative formulations, the results obtained are still not very accurate, especially for lower values of PS . This brings us to the conclusion that the only remaining unchecked assumption, namely the assumption that the key counters are independent, constitutes a fundamental difficulty. Indeed, in a differential attack, every plaintext-ciphertext pair suggests on average a certain number of key candidates.2 Consequently, the key counters Ti sum up to a certain value and hence are inherently correlated. The test results show that neglecting the dependence of the counters in DC can cause a non-negligible error, and a formula that neglects this effect is bound to be limited in its accuracy. 2
For instance, in a DES attack, on average 4 keys are suggested per s-box by a plaintext-ciphertext pair.
9
1
1
0.9
P(rank(k0) ≤ r)
P(rank(k0) ≤ r)
0.9 0.8
0.7
0.6 Equation 8, µ = 16 µ=8 µ=4 Experimental, µ = 16 µ=8 µ=4
0.5
0.4 5
10
15
20
0.8
0.7 Equation 8, µ = 20 µ = 10 µ=5 Experimental, µ = 20 µ = 10 µ=5
0.6
0.5
25
30
10
20
30
40
r
0.9
0.9
P(rank(k0) ≤ r)
P(rank(k0) ≤ r)
1
0.8
0.7 Equation 8, µ = 96 µ = 48 µ = 24 Experimental, µ = 96 µ = 48 µ = 24 10
20
30
40
50
70
80
90
100
90
100
(b) Attack No. 2; SN = 5.6
1
0.5
60
r
(a) Attack No. 1; SN = 2
0.6
50
60
70
80
0.8
0.7 Equation 8, µ = 12 µ=6 µ=2 Experimental, µ = 12 µ=6 µ=2
0.6
0.5 90
100
10
r
20
30
40
50
60
70
r
(d) Attack No. 4; SN = 216
(c) Attack No. 3; SN = 1.
Fig. 3. A comparison of Eq. 8 and the experimental success rates.
10
80
µ 1 2 4 8 16 32 64
(4) 0.335 0.465 0.652 0.857 0.978 0.999 1.000
(8) 0.459 0.600 0.743 0.871 0.994 0.999 1.000
(6) 0.314 0.422 0.613 0.847 0.981 0.999 1.000
Exp. 0.228 0.291 0.408 0.643 0.878 0.988 1.000
µ 1 5 10 20 40 60
(4) 0.039 0.108 0.311 0.713 0.980 1.000
(8) 0.012 0.035 0.181 0.549 0.963 1.000
(6) 0.008 0.031 0.143 0.528 0.954 1.000
(8) 0.113 0.537 0.902 0.997 1.000 1.000
(6) 0.113 0.563 0.882 0.995 1.000 1.000
Exp. 0.079 0.346 0.653 0.929 0.997 1.000
(b) Attack No. 2; SN = 5.6
(a) Attack No. 1; SN = 2
µ 3 6 12 24 48 96
(4) 0.335 0.762 0.941 0.997 1.000 1.000
µ 1 2 4 6 8 12 16
Exp. 0.007 0.024 0.121 0.463 0.925 1.000
(c) Attack No. 3; SN = 1.2
(4) 0.836 0.918 0.976 0.992 0.997 0.999 1.000
(8) 0.644 0.873 0.915 0.985 0.998 0.999 1.000
(6) 0.602 0.769 0.925 0.985 0.998 0.999 1.000
(d) Attack No. 4; SN = 216
Table 4. P (rank(k0 ) = 1) according to Equations 4, 8, 6 and the experimental results.
11
Exp. 0.449 0.588 0.800 0.899 0.952 0.990 0.998
Despite these limitations, the analytical results given in [6, 7] still appear to be useful: The formulas can be used reliably for the higher values of PS (e.g., 99% or higher); and they can be used for the lower values of the success probability to obtain rough estimates for PS or N .
4
Conclusion
In this paper, we gave the results of several experiments designed to test the validity of a formal probabilistic model of success proposed in [6, 7] for linear and differential cryptanalysis. Experimental results show that the formulas developed for LC are quite precise, especially when a 90+% success probability is of interest. The formulas appear to be less accurate for DC. The fact that the key counters are inherently correlated constitutes a fundamental difficulty for a simple and general formulation. Nevertheless, the equations derived disregarding this correlation turn out to provide reasonably accurate estimates for the higher values of the success probability. For the lower values, the equations can still be useful to obtain a rough estimate for the success probability or for the plaintext requirement. There are several significant open problems in analyzing the success probability of cryptanalytic attacks. Finding a more accurate formulation of the success probability in DC than those discussed in [6, 7] would be a significant contribution.
References [1] Eli Biham and Adi Shamir. Differential Cryptanalysis of the Data Encryption Standard. Springer-Verlag, 1993. [2] Mitsuru Matsui. Linear cryptanalysis method for DES cipher. In T. Helleseth, editor, Advances in Cryptology—Eurocrypt’93, volume 765 of LNCS, pages 386– 397. Springer-Verlag, 1993. [3] Mitsuru Matsui. The first experimental cryptanalysis of the Data Encryption Standard. In Y. G. Desmedt, editor, Advances in Cryptology—Crypto’94, volume 839 of LNCS, pages 1–11. Springer-Verlag, 1994. [4] A. R´enyi. Probability Theory. American Elsevier Publishing Company, Inc., 1970. [5] Ali Aydın Sel¸cuk. On bias estimation in linear cryptanalysis. In Indocrypt 2000, volume 1977 of LNCS, pages 52–66. Springer-Verlag, 2000. [6] Ali Aydın Sel¸cuk. On probability of success in differential and linear cryptanalysis. Technical Report CERIAS TR 2002-02, Center for Education and Research in Information Assurance and Security, Purdue University, January 2002. [7] Ali Aydın Sel¸cuk and Ali Bi¸cak. On probability of success in linear and differential cryptanalysis. In S. Cimato, C. Galdi, and G. Persiano, editors, Security in Communication Networks, Third International Conference (SCN 2002), volume 2576 of LNCS, pages 174–185. Springer-Verlag, 2003.
12