Experiments with Wavelet based Image De-noising using Generalized Cross Validation Maarten Jansen, Adhemar Bultheel Department of Computer Science, K.U.Leuven Celestijnenlaan 200A, B-3001 Heverlee, Belgium
ABSTRACT De-noising algorithms based on wavelet thresholding replace small wavelet coefficients by zero and keep or shrink the coefficients with absolute value above the threshold. The optimal threshold minimizes the error of the result as compared to the unknown, exact data. To estimate this optimal threshold, we use Generalized Cross Validation. This procedure does not require an estimation for the noise energy. Originally, this method assumes uncorrelated noise, and an orthogonal wavelet transform. In this paper we investigate the possibilities of this method for less restrictive conditions. Keywords:
noise reduction, wavelets, threshold, generalized cross validation
1. INTRODUCTION During the last decade, applications of wavelet theory in digital image processing have shown excellent and hopeful results. A wavelet representation of an image permits in a natural way to look at the image at different scales and thus supports a multi-resolution based processing. For problems like contrast enhancement, this method reduces the introduction of artifacts as compared with more classical operations. A wavelet decomposition of an image has strong decorrelating properties, i.e. it uses the correlation between neighboring pixels to represent the image more compactly: the essential information is captured by a limited number of large, important coefficients, while the main part of coefficients is close to zero. This property is used in compression algorithms. The wavelet representation uses basis functions that are local both in space and frequency. Each wavelet coefficient thus carries information about location and range of features like edges. A wavelet transform is fast and numerically well conditioned. In this text we focus on noise reduction. We describe a method that manipulates the wavelet coefficients directly. The manipulation of a coefficient often depends on the class to which the coefficient belongs. Therefore the algorithm first classifies the coefficients before the actual manipulation. For the allocation of each coefficient to a class, the algorithm uses a criterion, which is often binary: it divides the coefficients into two classes. The first group contains important, regular coefficients, while the other group of coefficients is catalogued as "not essential and too much affected by noise" . Several criteria were proposed. We mention some of the possibilities: 1. The most straightforward procedure uses the absolute value of the coefficient as a criterion: a coefficient close to zero contains little information and is relatively strongly influenced by noise. The basic idea is the same as for compression algorithms: the method assumes that a regular image can be represented by a small number of large coefficients. Donoho e.a.1 showed that this method has statistical optimality properties. 2. Another class of methods computes the correlation between coefficients at successive scales.2 These methods are based on the assumption that regular signal or image features have correlated coefficients at different scales, whereas irregularities due to noise do not. Further author information: (Send correspondence to M.J.) Email:
[email protected]; wWW: http:/ /www.cs.kuleuven.ac.be/~maarten/; 16 32 7996;
Telephone:
++32 16327080;
Fax: ++32
o o
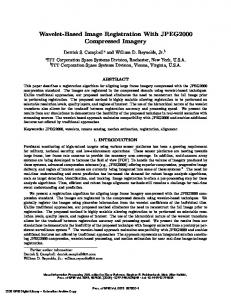
Figure 1. Wavelet thresholding for noisy images: mean square error of the result as a function of the threshold. If the threshold is too small, too much noise remains in the result. A large threshold deforms too much the original image (bias). The optimal threshold minimizes the mean square error. 3. A third class of methods is based on the characterization of the Lipschitz or Holder regularity of a function by its (continuous) wavelet transform.3,4 These methods look at the evolution of the coefficients across the different scales to distinguish regular from noisy contributions. Loosely spoken, a regular image or signal singularity has a long-term range and therefore the corresponding wavelet coefficients at coarse scales are large. Noise on the contrary, is local and therefore its singularities have larger coefficients at finer scales. This paper deals with the first class of simple threshold procedures. The small coefficients are marked as noisy and in most cases the algorithm replaces them by zero. We concentrate on the choice of the threshold. This choice is a compromise: if the threshold is too small, too much noise remains in the result. On the other hand, a large threshold deforms too much the original image. We try to find the threshold that minimizes the expected mean square error of the result as compared with the unknown, noise-free image. This is equivalent to a maximization of the signal-to-noise ratio. The error as a function of the threshold has a typical form, as depicted in Figure 1. Since the noise-free image is unknown, we cannot compute and hence not minimize this error function. Donoho and Johnstone5 propose a "universal threshold", proportional to the amount of noise 0": 8
= V2Iog(N)
(1)
0",
where N is the size of the input. Also other estimators, like SURE,6 make explicit use of the noise parameter practice, this parameter has to be estimated.
0".
In
Weyrich and Warhola7 propose a method that avoids the use of this parameter. In their algorithm, they incorporated a Generalized Cross Validation8 (GCV) procedure to estimate the optimal threshold from the input data only. In9 we showed that, under certain conditions, this procedure is asymptotically optimal, i.e. for a large number of data points it yields a threshold for which the result minimizes the error function. In this paper we discuss the assumptions and the conditions we imposed to prove this asymptotical optimality. We investigate why they are necessary and try to modify the procedure for cases where these conditions are not fulfilled.
2. WAVELET TRANSFORMS In this section we review some aspects of wavelet theory, mainly to set up notations and to introduce the concepts that we need for further discussion. For more about wavelets, we refer to the extensive literature, for instance.10-12 For simplicity, most of this section uses a one-dimensional terminology. We start with a discrete data set y. In the first instance the total number of data is a power of two: N = 2J. A discrete non-redundant wavelet transform maps this array of data to a new array of equal length. In a first step the algorithm convolves the input with a lowpass filter h, which results in the scaling coefficients. These coefficients are a smoothed version of the input data. The difference between this coarser scale representation and the original data is captured by a convolution of the input with a high pass filter g. Since these convolutions both give a result with
~.- ••_"I._. Figure 2. Successive steps of a fast decimated wavelet transform. After convolving the input with two filters hand g, the algorithm drops half of the result (down-sampling).
Under certain conditions, perfect reconstruction of the
original signal is possible from this decimated transform LL HL HL HHLH
LH HH I HL HH
H I L LH I LL
Figure 3. A two dimensional wavelet transform. First we apply one step of the one dimensional transform to all rows (left). Then, we repeat the same for all columns (middle). In the next step, we proceed with the coefficients that result from a convolution with h in both directions (right). a size equal to that of the input, this procedure doubles the total number of data. Therefore, we try to omit half of these data by subsampling, as indicated in Figure 2. Of course, some conditions on 9 and h are necessary to make a perfect reconstruction of the input possible from the resulting data. We do not go into detail on this problem. In the second and following steps, the algorithm repeats the same procedure on the reduced set of smoothed data. In each step, the resulting wavelet coefficients contain information about a certain degree of detail. All together, they constitute a multi-resolution analysis of the input. In two dimensions, we first apply one step on the row vectors and then on the column vectors. Figure 3 shows how this results in coefficients of four classes of coefficients. Coefficients that result from a convolution with 9 in both directions (HH) represent diagonal features of the image, whereas a convolution with h in one direction and with 9 in the other, reflects vertical and horizontal information (HG and GH). In the next step we proceed with the lowpass (LL) coefficients. The amount of computations for this linear transform is proportional to the size of the input N. This is a since general linear transforms require O(N2) flops and even the fast fourier transform still requires O(N log N) flops.
fast wavelet transform,
If we omit the subsampling step, we get at each resolution level the same number of wavelet coefficients. Figure 4 illustrates this redundant wavelet transform. Of course this transform should be consistent with the decimated transform in the sense that all the decimated coefficients re-appear in our new transform. To compute, for instance, the wavelet coefficients on the one but finest resolution level, we cannot, like in the decimated case, just convolve the scaling coefficients of the previous step with the high frequency filter g. If we want to get the original coefficients among our redundant set, we have to skip the extra coefficients of the previous step before the actual convolution. Of course these extra coefficients serve in their turn to complete the redundant set of wavelet coefficients at the given resolution level. A similar procedure is necessary for the computation of the scaling coefficients at the next level. At
Figure 4. The redundant wavelet transform. The points with a black center represent coefficients that also appear in the decimated transform. To be consistent with this decimated transform, we should make sure that we only combine intermediate results from the original transform in our computation of coefficients "with a black center". each level, the number of coefficients to skip, increases as a power of two minus one. This adaptation preserves the multiresolution character of the wavelet transform. It requires an O(N log N) computation time. For the inverse transform, we know that, at each resolution level, we could drop one half of the (wavelet and scaling) coefficients before reconstruction of the scaling coefficients at the previous level. As a consequence, these coefficients can be reconstructed in at least two different ways. If we manipulate the wavelet coefficients, for instance to remove noise, then the result will probably not be an exact redundant wavelet transform of one function. In this case, two reconstruction schemes at a certain level generate two different scaling coefficients at the previous level. Experiments show that taking a linear combination of these two possibilities causes an extra smoothing. This redundant wavelet transform is also shift-invariant: if we translate the input signal over m positions, all wavelet coefficients are shifted over the same number m of positions. This is definitely not true for the fast wavelet transform. For more information about this redundant wavelet transform, we refer to Refs. 13-15.
3. WAVELET SHRINKING
AND THE METHOD VALIDATION
OF GENERALIZED
CROSS
We start from the following, additive model for data with noise: y
=
f + E.
(2)
f represents an unknown, "clean" image and y is the input for our algorithm. In the first instance, we impose some restrictions on the noise E and on the wavelet transform: 1. The original image is smooth in the sense that it can be represented compactly by taking a wavelet transform. In fact, this assumption justifies the use of wavelets, since the localizing properties of these basis functions guarantee such a compact representation for most input images. Without this assumption, the wavelet transform would not be necessary. 2. We start with a decimated wavelet transform, and we suppose that it is orthogonal. 3. The noise E is stationary. In principle, this means that all components of the vector should have the same distribution. In practice, we want the mean EEi and the variance u2 = EE; to be constants, i.e. independent of i. This is second order stationarity.
Figure 5. Noise reduction by wavelet shrinking. On the left: Soft-thresholding: a wavelet coefficient w with an absolute value below the threshold 5 is replaced by o. Coefficients with higher absolute values are shrunk. Middle: Hard-thresholding: Coefficients with an absolute value above the threshold are kept. Right: a more complicated shrinking function. 4. We also assume that the noise is white or uncorrelated:
ECicj
= 5ij(J"2.
5. The noise should be Gaussian with zero mean. Experiments showed that, in practice, the GCV-method performs well for other zero mean stationary distributions of the noise.
1Il
If the noise is white and stationary and if the transform is orthogonal, we can rewrite the same, additive model "wavelet domain":
w=v+w. wand v are the discrete, decimated wavelet transforms of This is still white and stationary noise.
(3) y
and
f,
and
w
is the wavelet transform of the noise.
All wavelet coefficients with absolute value below a certain threshold 5, are classified as "noisy". The algorithm replaces them by zero. The coefficients above the threshold are shrunk with the same value 5. Figure 5 compares this "soft-thresholding" operation with the "hard-thresholding" alternative. The hard-thresholding procedure does not shrink the coefficients with absolute value above the threshold. Although at first sight this may seem a more natural approach, soft-thresholding is a more continuous operation, and it is mathematically more tractable. The figure also shows a more complicated shrinking junction. It provides a continuous approach, while keeping the largest coefficients untouched. Not all shrinking methods use a threshold parameter. The soft-thresholding function is thus a compromise between a fast and straightforward method and a continuous approach. After applying a threshold 5, we get the modified wavelet coefficients W6, for which the inverse transform yields the restored data Y6. As threshold value, we choose the minimizer of the following Generalized Cross Validation function: GGV(5)
=
-hIIY - Y6112
[~)F
'
(4)
where N is the total number of wavelet coefficients and No the number of these coefficients that were replaced by zero. This function only depends on input and output data. A priori knowledge about the amount of noise energy is not necessary. If we use orthogonal wavelet transforms, then we can compute this formula in the "wavelet-domain", and hence minimization can be done completely in this domain. In that case, the amount of work due to this minimization is comparable to or even less than the number of computations necessary for the wavelet transform. In Ref. 9, we proved that, under the given conditions, and for the soft-thresholding case, this threshold choice is asymptotically optimal, i.e. for a large number of wavelet coefficients, the minimizer of GGV(5) also minimizes the mean square error function (or risk function) R(5), where
R(5)
More precisely, we have:
= ~IIY6
- f112.
(5)
GC~ __
3.5
,
,
2.5 \
1.5"
\
R
I
10
12
14
Figure 6. GGV and mean square error of the result in function of the threshold 8. The input was an image with artificial, white, and stationary noise. THEOREM
1. If 8* = arg min R(8) and
'8
= arg min GGV(8),
then for N -+ 00:
ER('8) 11, and in the neighborhood
(6)
of 8* : EGGV(8)
~ ER(8)
+ 0-2•
(7)
Figure 6 illustrates this principle for a typical case.
4. LEVEL-DEPENDENT THRESHOLDS It is clear that one threshold cannot perform well for images with non-stationary noise. Indeed, the wavelet transform of such noise is not stationary either and a "good" threshold always depends - explicitly or implicitly - on the amount of noise. If this amount differs for all coefficients, one common threshold is not able to remove the noise decently. For images with correlated noise, the correlation itself is no problem, but the wavelet transform of such a noise is not stationary either. However, it is easy to prove that an orthogonal decimated wavelet transform of stationary, correlated noise is stationary within each resolution level.1G,17 This property still holds if we omit the subsampling step. Using this observation, we can construct a GCV-estimator for a threshold at each resolution level. However, a fast wavelet transform yields less coefficients at coarse scales, as we illustrated in Figure 2. Since the GCV-estimator is asymptotically optimal, we prefer here the redundant wavelet transform. As mentioned before, the reconstruction from this over-determined representation causes additional smoothing.
5. RESULTS AND DISCUSSION We now illustrate the methods for two test cases. The first is an image of 256 x 256 pixels with artificial, additive, colored noise. This noise was the result of a convolution of white noise with a FIR highpass-filter. The signal-tonoise ratio is 4.56 dB. Figure 7 shows the original image and the image with noise. Figure 8 shows the result of the level-dependent threshold procedure applied on the fast wavelet transform of the noisy image. Signal-to-noise ratio is now 14.77 dB, but the result shows artifacts. The same figure also shows the result for the redundant wavelet transform. It illustrates the smoothing effect of this alternative: most of the artifacts have disappeared. For this example, we used Haar-wavelets. Signal-to-noise ratio is now 17.52 dB.
Figure 7. Left: a clean test-image. Right: the same image with artificial, additive and correlated noise. The noise is the result of a convolution of white noise with a FIR highpass filter. Signal-to-noise ratio is 4.56 dB.
Figure 8. Result after applying the level-dependent threshold procedure on the wavelet transform of the noisy image. Left: the fast wavelet transform. Signal-to-noise ratio is 14.77 dB. Right: redundant wavelet transform. Signal-to-noise ratio is 17.52 dB.
Figure 9. Left: MRI image with noise. Middle: result after thresholding for redundant transform based on orthogonal wavelets. Right: result for redundant transform based on biorthogonal wavelets. The second example is a "realistic" MRI-image of a knee (128 x 128 pixels). The left image of Figure 9 is the input image with noise. The second image is the result of our algorithm for the redundant Haar-wavelet transform. Since the subsampled version of the Haar-transform is orthogonal, this wavelet transform preserves stationarity within each resolution level. This is not true for the biorthogonal Cohen-Daubechies-Feauveau (2,2) wavelet transform. However, this transform is "close to orthogonal" and the third image of Figure 9 shows that the obtained result is at least comparable with the result of Haar.
6. CONCLUSION This paper has presented an automatic selection of level-dependent thresholds for wavelet coefficients, to remove stationary, correlated noise. Most existing algorithms use an estimation of the noise energy at all scales to choose these thresholds. Since we need one threshold for each scale, the benefits of an automatic selection of these thresholds are still more important than for the choice of one threshold, like in.9 However, our selection is based on an asymptotical method, which fails at coarse scales, since only a few wavelet coefficients correspond to these levels. Therefore, we introduce the redundant wavelet transform. This alternative provides, at the expense of more computation time and higher memory requirements, sufficiently coefficients at all scales.
ACKNOWLEDGEMENTS This research was financed by a grant from the Flemish Institute for the Promotion of Scientific and Technological Research in the Industry (IWT).
REFERENCES 1. D. L. Donoho and 1. M. Johnstone, "Wavelet shrinkage: Asymptopia?," Journal of the Royal Statistical Society, Series B 57(2), pp. 301-369, 1995. 2. Y. Xu, J. B. Weaver, D. M. Healy, and J. Lu, "Wavelet transform domain filters: a spatially selective noise filtration technique," IEEE Transactions on Image Processing 3(6), pp. 747-758, 1994. 3. S. Mallat and W. L. Hwang, "Singularity detection and processing with wavelets," IEEE Transactions on Information Theory 38(2), pp. 617-643, 1992. 4. S. Mallat and S. Zhong, "Characterization of signals from multiscale edges," IEEE Transactions on Pattern Analysis and Machine Intelligence 14, pp. 710-732, 1992. 5. D. L. Donoho and 1. M. Johnstone, "Ideal spatial adaptation via wavelet shrinkage," Biometrika 81, pp. 425-455, 1994. 6. D. L. Donoho and 1. M. Johnstone, "Adapting to unknown smoothness via wavelet shrinkage," J. Amer. Statist. Assoc. to appear, 1995. 7. N. Weyrich and G. T. Warhola, "De-noising using wavelets and cross validation," in Approximation Theory, Wavelets and Applications, S. Singh, ed., vol. 454 of NATO ASI Series C, pp. 523-532, 1995. 8. G. Wahba, Spline Models for Observational Data, ch. 4, pp. 45-65. CBMS-NSF Regional Conf. Series in Appl. Math., Society for Industrial and Applied Mathematics, Philadelphia, PA, 1990.
9. M. Jansen, M. Malfait, and A. Bultheel, "Generalized cross validation for wavelet thresholding," Signal Processing 56, pp. 33-44, January 1997. 10. 1. Daubechies, Ten Lectures on Wavelets, CBMS-NSF Regional Conf. Series in Appl. Math., Vol. 61, Society for Industrial and Applied Mathematics, Philadelphia, PA, 1992. 11. S. G. Mallat, "A theory for multiresolution signal decomposition: The wavelet representation," IEEE Transactions on Pattern Analysis and Machine Intelligence 11(7), pp. 674-693, 1989. 12. G. Strang and T. Nguyen, Wavelets and filter banks, Wellesley-Cambridge Press, Box 812060, Wellesley MA 02181, fax 617-253-4358, 1996. 13. M. Malfait and D. Roose, "Wavelet based image denoising using a markov random field a priori model," IEEE Transactions on Image Processing 6(4), pp. 549-565, 1997. 14. G. P. Nason and B. W. Silverman, "The stationary wavelet transform and some statistical applications," in Wavelets and Statistics, A. Antoniadis and G. Oppenheim, eds., Lecture Notes in Statistics, pp. 281-299, 1995. 15. J.-C. Pesquet, H. Krim, and H. Carfantan, "Time invariant orthonormal wavelet representations," IEEE Transactions on Signal Processing 44(8), pp. 1964-1970,1996. 16. 1. M. Johnstone and B. W. Silverman, "Wavelet threshold estimators for data with correlated noise," Journal of the Royal Statistical Society, Series B To Appear, 1997. 17. M. Jansen and A. Bultheel, "Multiple wavelet threshold estimation by generalized cross validation for data with correlated noise," TW Report 250, K.U.Leuven, Department of Computer Science, Leuven, Belgium, Jan. 1997.