Explicating Net Diversity in Trend Assessment - CiteSeerX
Recommend Documents
capacity is equated as individuals' use in their exposure to the medium. Second, the ... blog means almost nothing if only few sites receive visitors. Hindman ...... high-tech profiles of broadband readiness and diverse access facilities among the.
in political, economic, and information domains and their potential roles in creating .... up a political website is usually equivalent to hosting a talk show on public access ..... For instance, buying a product online presupposes the exposure to.
learning of aesthetics in design and technology education. Grietjie Haupt and ... the extent to which the four-level model can evaluate design and technology.
Jul 15, 2015 - Masoumeh Yousefiazarkhanian*, Ali Asghari**, Jafar Ahmadi***, Behvar Asghari**** and Ali Ashraf Jafari*****. *Ph.D. Student. University of ...
We ground our work in the concept of IS design theories as proposed by. Walls et al. .... information systems versus the retail information system for company ABC). .... to Becker and Schütte development and application of reference models is ...
Subjects who are better at web design would be able to spend less time ... These added web materials were small and of the same theme as the written material.
Implicit assumptions made during higher development levels, such as in architecture ... proposed assumption modeling method can be used by software architects and ..... Property Set Reuse for Declaration of Common Dependency Custom Attribute . ... Th
Nov 19, 2011 - in a village in Masvingo Province, Zimbabwe: Structure ... seed or seed acquired from close family members, traditional myths and different cultivation ..... estimated visually using DNA low mass ladder (InvitrogenTM Life ...
Aug 9, 2010 - The polymorphisms were scored and used in band-sharing analysis to .... genotypes and selection of the parents for successful hybridization.
spatial changes as well as quantify the result of shoreline change at Glefe, a suburb of Accra in. Ghana. Shoreline positions from a 2005 orthophoto and a 2011 ...
Oct 25, 2011 - these narratives and a negative linear relationship between these same ...... C.E. (2014) DICTION 7.0 Text Analysis Program â Help Manual, Digitext, ..... lks fe e l lik e th e ir w orld is slippin g aw a y. It is. H e re th e d escr
To answer these ques- tions, we .... (1944) identified a number of key characteristics of opinion leaders that distinguish ..... participation in June 2000 was intermediate at .23 (p < .001). ..... Consumer behavior and marketing action (3rd ed.).
tlei, Brosimum alicastrum, Manilkara zapata, Pouteria sa- pota and Terminalia amazania. ..... pai·a el diseño de su plan rector de manejo. Final report (project.
tlei, Brosimum alicastrum, Manilkara zapota, Pouteria sa- pota and Terminalia ....
na argyrophylla, Muntingia calabura, Piper yzabalanum,. Plumeria rubra ...
Seeds were supplied by a professional supplier, Gaara seeds. Co., Cairo, Egypt. .... Assessment of genetic diversity in tomato by IRAP, ISSR and RAPD markers.
Apr 30, 2015 - One hundred ninety three germplasm accessions of potato (Solanum tuberosum ssp. tuberosum) germplasm, from eight countries, were ...
by Bisen Singh and Mahendra Pal Singh, New. Connaught Place, Dehradun, 602 p. Malik, S.K., Chaudhury, R., Dhariwal, O.P. and. 2. Bhandari, D.C. 2010.
75.7672 W. 1179. No-Cen. CKC025. B, V, and W. Ayacucho. 13.2546 S. 74.3445 W. 3498. No-Cen. CKC026. B, BR, V, and W. Ayacucho. 13.2186 S. 74.3606 W.
Nov 18, 2013 - Fungal Tree of Life; BLAST: Basic Local Alignment Search Tool; BOLD. SYSTEMS: Barcode of Life Data ... Laboratory; Fungi DB: Fungal and Oomycete Genomics Resources; ...... S (2012) Metagenomic profiles of free-living archaea, bacteria
Alfred P. Sloan Foundation Industries Studies ConferenceBoston, MA. Hall, J. (2007). "Probabilistic climate scenarios may misrepresent uncertainty and lead to ...
ABSTRACT. Garden cress [Lepidium sativum L.] is an important ... for genetic diversity assessment of 32 garden cress ...... cloning: A laboratory manual.
Hindman contrasted the traffic patterns of the top 300 websites and small sites to .... or the diversity of viewpoints as represented in programming. ... What the field of digi- ...... Neuman, W. R., Guggenheim, L., Jang, S. M., & Bae, S. Y. (2014).
Abstract This study tracks the increasing supply of Internet access and the diversity of Internet use by analyzing data from the three waves of a survey conducted in the United Kingdom in 2005, 2007, and 2009. Data on Internet access and three dimensions of online use (civic-government, economic-commerce, and generic information and news) reveal that Internet not only offers an emergent promise of diversity but also presents a systematic divide in which the increase in benefits (of Internet capacities and actual consumed) does not uniformly occur, while the impacts of social disparities remain constant over time. Our discussion addresses how characteristics of social backgrounds are salient in harnessing types of Internet use that may be a critical tipping point for information diversity. We argue that policymakers will be better served by understanding the constraint of actual use that is to be in par with the continuous explosion of technological supply. Keywords information diversity, Internet use, communication policy, social disparity The Internet is the most democratizing innovation we’ve ever seen, more so even than the printing press. —Joe Trippi (2005, quoted in Hindman, 2008)
At the influx of emerging digital information technologies, many speculated that the mass public will be exposed to diverse sources of information and that the citizens, with rapidly expanding choices of information at hand, will be enabled to consume information effectively. Noteworthy in this trend has been the rise of Web 2.0 applications in political, economic, and information domains and their potential roles in creating
1Howard
University, Washington, DC, USA
Corresponding Author: Yong Jin Park, 13306 Burkitts RD, Fairfax, VA, USA. Email: [email protected]
Downloaded from crx.sagepub.com at PENNSYLVANIA STATE UNIV on February 20, 2016
2
Communication Research
well-beings across communities. On the policy side, some policymakers in advanced nations such as the United States and the United Kingdom have argued that the information diversity principle of disseminating diverse and antagonistic sources (Napoli, 1999, 2011a) has become obsolete because (1) the notion is based on the scarcity of mass media channels and (2) digitalization in its infinite supply has enabled wider arrays of information choices. This view is to be challenged in two ways. First, the availability of information capacity is equated as individuals’ use in their exposure to the medium. Second, the diversity of information in the Internet is assumed to be monolithically available across different population segments (see Hindman, 2007, 2008). Methodologically, the cross-sectional data used in recent debates highlight these limitations. Although anecdotal evidence, such as the role of YouTube or Twitter in instigating political uprisings during the Arab Spring, suggests a promising trend of emerging new public spheres, no clear trend has been documented yet to show how the enthusiastic reception of new technologies will ultimately pan out. In fact, much commentary on the issue of Internet diversity has been focusing on a single dimension of access in the transition from narrowband to broadband penetration, as much of the policy argument is predated upon the notion that as technological access increases, social opportunities increase in congruence. This optimism is, furthermore, often imbued with a somewhat simplistic policy account of ordinary user abilities in utilizing the diverse sets of digital media. The present study tests the premise of the congruence between technological access and social affordance through the trend assessment over time. We analyze (1) whether the Internet diversity in terms of access and use has increased over time and (2) how different social segments are benefited to be exposed to the diversity of Internet use and access. To examine these issues, we explicate the notion of Internet diversity in terms of actual use (Hindman, 2008; Napoli, 2011a) and analyze the data from three waves of trend data sets from 2005 to 2009 (n = 4,290). The investigation will shed light on the resilience of social stratification of Internet (Hargittai, 2010; Hargittai & Hinnant, 2008; Park, 2015a; Zillien & Hargittai, 2009) in mobilizing or inhibiting citizens in the areas of civic-government, economic-commerce, and news-related informational engagements. The results and discussion address how the socialization process of different populations may be a critical tipping point for the incongruence between increased access and the stability of use, as well as how characteristics of social backgrounds remain salient in harnessing types of the diversity that Internet enables. In the following, we first conceptualize the net diversity with regard to the extent to which a diverse array of information is consumed by individuals and consider prior works on the digital disparities with regard to various aspects of Internet use and access (DiMaggio, Hargittai, Neuman, & Robinson, 2001; Neuman, Bimber, & Hindman, 2011; Van Dijk, 2012). Analysis then proceeds with regard to the two areas of concern: (1) the apparent stability of the divide over time and (2) sociodemographic predictors of Internet diversity. Finally, we discuss broader social and policy implications for the alleviation of the inequalities in the Internet.
Downloaded from crx.sagepub.com at PENNSYLVANIA STATE UNIV on February 20, 2016
3
Park
Theoretical and Empirical Considerations The Notion of Net Diversity To explicate the notion of net diversity, we start with the seminal study by Matthew Hindman (2008) who debunked the notion that the Internet democratizes the public sphere by enabling politically interested citizens to create, filter, and distribute their voices widely, transforming the politics from elite-oriented to mass-driven systems. Hindman contrasted the traffic patterns of the top 300 websites and small sites to demonstrate that a majority of Internet users access only a tiny fraction of highly visible contents dominated by a handful of new media mega sites such as Google, Yahoo, and Amazon. Hindman went on to explain that grand claims about the Internet are based on misguided assumptions about the traffic concentration of the Web, while there is no empirical support for the claim that the Internet makes visible a much broader set of sources of political information. Simply put, the fact that anyone can start a political blog means almost nothing if only few sites receive visitors. Hindman argued, “Putting up a political website is usually equivalent to hosting a talk show on public access television at 3:30 in the morning” (p. 23). Hindman’s point carries important implications. First, he has called into question the claim of the shift from mass to niche market in which every citizen is empowered to (1) access the infinite side of information diversity in the potential visibility of nonmainstream culture (e.g., Anderson, 2006) and (2) distribute the content meaningfully with distinctive traits of their own design and choice (e.g., Benkler, 2007). Second, more importantly, his findings suggest a critical disjuncture between information supply and demand because the mass attention, in finite cognitive capacity, tends to be concentrated at the stage of the actual use and exposure (Neuman et al., 2011). That is, the technological capability of production diversity does not necessarily translate into the cultural diversity at the consumption stage even as the content producers shape the Web into radically diverse public spheres. With this backdrop, scholars (Bimber, 2001; DiMaggio et al., 2001; Howard & Jones, 2004) have begun to see the need to qualify early theories about how the Internet would drastically transform the public spheres (e.g., Benkler, 2007; Negroponte, 1996). Some might well contend that we are witnessing a simple mirror of a traditional pattern of old media concentration in the new media landscapes. It is also plausible that lack of systematic data has allowed popular narratives to assume the hyperbole without holding it up to empirical verifications when only selected contexts of online communities or individuals were highlighted as participants equally capable of becoming diverse content creators.
Two Facets of Net Diversity: Supply of Access Availability and Exposure of Use In this line, recent scholarship (Asalama, 2009; Hargittai, 2010; Hargittai & Hinnant, 2008; Helberger, 2008; Napoli, 2011a, 2011b; Van Dijk, 2012; Zillien & Hargittai, 2009) has offered a refined notion of diversity in terms of actual Internet use at the stage of consumption. Most notably, Napoli (2011b) argued that there exists the
Downloaded from crx.sagepub.com at PENNSYLVANIA STATE UNIV on February 20, 2016
4
Communication Research
exposure diversity at the final point of media use, which indicates the extent to which audiences consume diverse sets of content. This is different from a traditional notion of the media diversity understood as the presence of a vast array of information accessible to citizens, because the content that is available is not necessarily the one that actually reaches audiences. From this perspective, it is applicable that the user side equation, that is, how individual users remain engaged in various activities instead of information capacity per se, is the most important locus of diversity in the Internet. Here the distinction is to be made between the stages of (1) information access and (2) consumption and also between (1) passive reception and (2) Internet-enabled active participation (see Hargittai, 2010). In this vein, net diversity can be the capital resource through which individual users enjoy, not only access to technological capacities, that is, the supply of access availability at the point of information source, but also the full ranges of Internet uses in the spectrum of civic-government, economiccommerce, and information and news-related online activities, that is, the diversity of use at the point of information exposure. At the center of this study, we maintain the three categories of (1) civic-government (e.g., Bimber, 2001), (2) economic-commerce (e.g., Hoffman & Novak, 2000; Lee, 2013), and (3) generic information and news-related informational activities in Internet use (e.g., Fallows, 2004; Katz & Rice, 2002; Van Dijk, 2012). Here we borrow much of the logic and conceptualization from the earlier works in the rich field of digital disparities. In essence, the aim is to identify the breadth (diversity) of individual involvements in different information domains (DiMaggio et al., 2001; Hargittai & Hinnant, 2008; Hindman, 2008; Park, 2013, 2015a, 2015b). In practice, the respective domains concern whether users, once online access is achieved, begin to take up diverse activities in order to expose themselves to economic, governmental, or informational benefits from the Internet (Schradie, 2012) as these three dimensions represent the most fundamental aspects of capital-enhancing activities that hint on how effectively-diverse Internet use can be. While the rise of Web 2.0 applications in political, economic, and information domains will involve new types of online activities (see Neuman, Guggenheim, Jang, & Bae, 2014), the development of other activities will be certainly extended from those of the three categories. Underlying issues become particularly important in the context of digital and participation divide instead of the access in its own right. That is, we will need to reconnect the exposure diversity to the final point of new media use in order to investigate the extent to which users are actually able to consume and expose themselves to diverse sets of content. Hargittai (2002, 2010; DiMaggio et al., 2001) insightfully argued that while Internet access is an important source of information inequality across sociodemographics, an important point of contention also concerns differentiated user abilities in participating in diverse digital activities. Similarly, Bonfadelli (2002) pointed out that the heterogeneity of Internet-based information tends to exacerbate information inequality because not all users can expose themselves to and utilize diverse sets of available information, while the relative homogeneity of mass media content (Neuman, 1991) may make such differences less salient.
Downloaded from crx.sagepub.com at PENNSYLVANIA STATE UNIV on February 20, 2016
5
Park
The studies in digital disparity provide an important insight because media scholars traditionally concerned with the diversity of source, such as ownership concentration, or the diversity of viewpoints as represented in programming. Little known is the consumption as opposed to the supply-production of diversity, namely, how audiences use media channels to access a variety of information. The distinction is the user-centered view (exposure of information) as opposed to media-centric perspective (source of information), which would simply tally the total access points across available channels (see Webster, 2014). Instead, we can focus on the user side by investigating how individuals’ attention in actual media consumption is distributed. In traditional mass media use, the plurality of accessible media channels does mean little when limited repertoire of media viewing persists. This is particularly so, given a multitude of media channel competes for finite attention (Neuman, 1991; Webster, 2014). Here we can import this insight to the new media context by linking the notion of information diversity back to the exposure point of Internet use. What the field of digital disparity (Ball-Rokeach, Kim, & Matei, 2001; DiMaggio et al., 2001; Hargittai, 2002, 2010; Van Dijk, 2012) contributes is the social stratification, that is, not all users are uniformly capable as such factors as gender, race, and socioeconomic status (SES) shape inequality in the effectiveness and quality of Internet use. Since the early days of Internet penetration, advanced research (Hargittai, 2010; Hargittai & Hinnant, 2008; Howard & Jones, 2004; Zillien & Hargittai, 2009) has raised the concern of individuals’ ability to use the Internet effectively beyond the binary distinction between accessHaves and Have-nots. In this regard, the three dimensions (1) civic-government, (2) economic-commerce, and (3) generic information and news-related information activities in Internet use may serve as a helpful lens through which the net diversity, as actually exposed to individuals (Napoli, 2011a, 2011b), can be empirically measured.
Information Diversity as a Policy Principle From the standpoint of policymaking and in terms of the role that the Internet and future technologies play in the dynamics of promoting information diversity, this offers a critical insight into whether technological development is genuinely opening up the window by providing de facto alternatives to the traditional media system that has been concentrated with homogeneous information. In European policy contexts, active discussion has taken place regarding how to incorporate the Internet as a tool of promoting diversity (Burri-Nenova, 2007). This approach was contrasted with the U.S. approach by which the Internet is assumed to produce positive outcomes of diverse information availability and the policy role is to be kept at a minimum. Here again, the critical question is whether the increasing potential of diverse information capacity in the Internet is in line with the diversity of use and exposure across different communities, just because users have a greater array of information options to actively engage in (cf. Ball-Rokeach et al., 2001; Napoli, 2011a). The question remains whether technological changes—notably, the Internet—facilitate the promotion of diversity to the extent that highlighting the dissemination of diverse information sources as a fundamental policy principle is no longer necessary.
Downloaded from crx.sagepub.com at PENNSYLVANIA STATE UNIV on February 20, 2016
6
Communication Research
Indeed, for many social scientists, engaging in debates concerning the information diversity in the Internet can be a daunting task. On one hand, the policy assertion that the rise of digital media such as Internet outdated the diversity principle entails empirical verification. On the other hand, much of the debate seems to have proceeded without explicating the notion of diversity in the Internet. Building upon excellent empirical and conceptual endeavors by social scientists in this vein (Bimber, 2001; DiMaggio et al., 2001; Hindman, 2008; Napoli, 2011b), however, we can still delve deeper into the debate in this important area. Here the goal is to empirically assess the posited benefits of Internet in promoting diversity as explicated in terms of use and access. As prior research has provided an excellent groundwork, this study is to specify the conditions that incubate the net diversity (or lack thereof) across sociodemographic characteristics over time. On that note, in order to ground our investigation empirically, Hindman’s (2008) poignant point about the concentration of Web traffic deserves due modifications as well. First, because his study (2008; also Hindman, Tsioutsiouliklis, & Johnson, 2003) primarily concerned political domains, it seems logical to extend the premise in other domains of informational, governmental, and economic activity. Second, his systematic analysis was based on the “big data” of aggregate Web traffic in a cross-sectional measure. Thus, we need to qualify or support his thesis with individual-level data, using a set of surveys that measured self-reported Internet use over time. Third, sociodemographics at the stage of consumption should be highlighted as social stratification is likely to function as a potential barrier to use and access, ultimately determining whether a diverse array of information available in the Internet actually reaches a broad range of individual users (Hargittai, 2015, for “big data” sample limits). Overall, understanding of the concentration of Web traffic needs further refinement as we posit to test Hindman’s “narrow net” thesis at the two dimensions of net diversity—(1) individual use and (2) access availability. From the policy standpoint, to assess whether the diverse needs at the level of user attention and use are truly met by new media platforms, we need to test whether the sociodemographic disparities upon actual consumption persist or alleviate over time.
Hypothesis and Research Question In sum, this study tests the notion of net diversity as explicated into the actual use (exposure of information) and the supply of access availability (available source of information). In general, researchers (Hindman, 2008; Napoli, 2011a) theorized that the availability of information capacity may not necessarily be at par with the increase of actual use. Accordingly, we hypothesize the presence of the disjuncture between use (at the point of actual exposure of information) and access availability (at the point of supplied source of information). Hypothesis 1 (H1): There will be a disjuncture in the level of overall growth between the supply of Internet access availability and the diversity of Internet use over time.
Downloaded from crx.sagepub.com at PENNSYLVANIA STATE UNIV on February 20, 2016
7
Park
When specifying the dynamics of the disjuncture, the preceding theoretical contours also suggested that the sociodemographic conditions may influence how individual users remain engaged in various activities as well as access to the technological capacities (DiMaggio et al., 2001; Hargittai & Hinnant, 2008; Zillien & Hargittai, 2009). Given the paucity of direct evidence on the longitudinal trend data, however, we have few grounds on which to propose directional hypotheses. Instead, we ask, what impacts the sociodemographic conditions may have in incubating the increase of diverse uses and accesses, and related, how these differences may or may not accelerate over time. Research Question 1a (RQ1a): To what extent do sociodemographic conditions impact the supply of Internet access availability and the exposure to the diversity of Internet use over time? Research Question 1b (RQ1b): Is there an interaction effect between the yearly increase and each of the sociodemographic differences?
Method Measures and Data To assess the longitudinal trend of net diversity in terms of access and use, we need a rich set of survey measures over time and large numbers of cases. Especially, it would be ideal to have the consistent survey measures from the early 2000s, when the Internet penetration was still in its infancy globally, to the late 2000s, when Web 2.0 applications began to take off. A powerful data set was provided by the Oxford Internet Institute (OII) over the timelines of 2005, 2007, and 2009 (n = 4,290). The choice of OII data is beyond pragmatism of an available time series data set with national stratified probability sampling. The U.K.-based data in fact provide a useful point of analysis in reference to the U.S. context in which a majority of recent debates were based. Hindman’s Hitwise data were also based on Internet traffic among U.S. users, and how these patterns of lack of information diversity in the Internet will pan out in a different national context of social stratification is a significant point of inquiry. The analyses for this article were done exclusively with the current Internet users while the OII survey collected data from Internet users and nonusers. The crosssectional surveys are based on nationally representative random samples of more than 2,000 individuals age 14 and older in England, Scotland, and Wales. One of the unique aspects about OII survey is that this was conducted door-to-door based on a face-face contact, which allowed high response rates (72%, 2005; 77%, 2007; 80%, 2009) by which productive interviews were obtained. Moreover, the survey was administered every 2 years with consistent measures each time. Lastly, considerable variations within each stratum provide fruitful grounds to test our empirical objectives. Demographic characteristics of the OII surveys aligned with the profiles of the U.K. population and government regional division: Wales, Scotland, and England (and its subregions). With poststratification weighing applied, gender, age, socioeconomic grade (defined by U.K. social classification system as five categories of upper and
Downloaded from crx.sagepub.com at PENNSYLVANIA STATE UNIV on February 20, 2016
8
Communication Research
working classes) were not far different from those of the general population. The level of education was comparable, given 21% in United Kingdom has a university-equivalent degree (as compared with 25%, 22%, and 20% of each year in this sample). However, the number of non-White respondents (with 6.9%, 2009; 9.7%, 2007; and 5.4%, 2005, respectively) remained far smaller in this study’s current Internet user sample, although Whites in the United Kingdom stayed as high as 87.17% in 2011. We speculate that Internet penetration disparity between non-Whites and Whites may account for this. In addition, a good portion of non-English speaking population may have been excluded from survey-interview because of language barriers that hinder the face-to-face interaction of the OII survey administration. Given the extent to which non-White users are underrepresent in the sample, readers should use caution in making generalizations based on this study’s findings. We pooled the data from 2005, 2007, and 2009 and created the 3-year variables in the hierarchical regression models.1 The estimated coefficient gives the relative strength of a given year compared with others, indicating that the year is more or less likely to be associated with diverse Internet access and use among participants, controlling for sociodemographic conditions. We also conducted means tests between years to estimate the bi-yearly differences in general linear models (H1). In addition, we looked at the distributions of those who reported (1) at least two activities in each dimension of use diversity and (2) a minimum of two in each metric of Internet access points. This was to discern descriptive yearly trends through which we could detect the fluctuations (%) of those not confined in a single dimension of use and access. In assessing stratification trends during the period 2005-2009 (RQ1a and RQ1b), the two analytical strategies were used. First, each of the access and use diversity models included the single year variable (coded as 1, 2, or 3) as a covariate (e.g., Valentino & Sears, 2005) and estimated direct effects of social strata. Then, the interaction terms between the year variable and the sociodemographic conditions were created on the pooled cross-sectional data to examine how the relationships between the outcome variables and sociodemographics changed over the 3-year period of 2005, 2007, and 2009 (see Dielman, 1983). Limitations pertinent to the secondary (OII) data use of large social surveys are acknowledged (see Freese, 2009) as we made explicit decisions and explanations in each case of associated shortcomings. We also caution that these are not panel data that track changes among the same respondents. Instead, this study’s models will capture the resilience or fluctuation of sociodemographic patterns of respective years.
Measures of Net Diversity One of the most important aims of this study is to discern Internet access (source of information) from actual use (exposure of information) as the two should not be equated in the process of consumption. Moreover, the distinct dimensions of Internet access and use are to be explicated, as the different accessibilities of type and location were noted in addition to the binary measure of broadband adoption (63%, 2005; 85%, 2007; 95%, 2009). For online use at the actual exposure of information, the diverse
Downloaded from crx.sagepub.com at PENNSYLVANIA STATE UNIV on February 20, 2016
9
Park
engagements were operationalized into the three dimensions of civic-government (Bimber, 2001), economic-commerce (Fox, 2002; Hoffman & Novak, 2000; Lee, 2013), and generic information and news-related- (Fallows, 2004; Katz & Rice, 2002; Park & Jang, 2014) informational activities. In each dimension, the key is to identify the breadth (diversity) of absence or presence (coded as 0 or 1) of the respondents’ involvement in particular activities. Note that each dimension is not strictly limited to information-seeking but encompasses online activities that precede related information exposure. For instance, buying a product online presupposes the exposure to commerce-related information such as price, available goods, or/and online marketplaces. The prevailing approach in the earlier studies of online uses seems to be to look at just one type of online activity in a single domain (notably, Fallows, 2004; Fox, 2002). However, this does not allow us to detect varied functional uses and broader affordances for different types of activities in exposure. Instead, the extent of the net diversity can be measured through the number of capital-enhancing activities in which individuals are engaged in distinct domains. The diversity of use is defined as the extent to which individuals are engaged in diverse arrays of Internet uses. To assess this, the variance of individual scores was measured, using the additive indexes in the three dimensions of (1) civic-government (M = 0.76, SD = 1.20, 2005; M = 1.07, SD = 1.50, 2007; M = 1.39, SD = 1.70, 2009, Minimum = 0, Maximum = 6; M = 1.077, SD = 1.503, Minimum = 0, Maximum = 6, 3-year aggregate), (2) economic-commerce (M = 2.31, SD = 1.42, 2005; M = 2.53, SD = 1.42, 2007; M = 2.55, SD = 1.43, 2009: Minimum = 0, Maximum = 4; M = 2.471, SD = 1.432, Minimum = 0, Maximum = 4, 3-year aggregate), and (3) generic info and news-related informational activities (M = 3.40, SD = 1.68, 2005; M = 4.45, SD = 2.03, 2007; M = 4.34, SD = 1.92, 2009: Minimum = 0, Maximum = 7; M = 4.120, SD = 1.957, Minimum = 0, Maximum = 7, 3-year aggregate; see Table 1 for individual items). The civic-government information dimension consisted of the six items asking whether or not respondents did respective activities online, with a response option of yes (1) or no (0). The four items in the economic-commerce dimension and the seven items in the generic info and news-related information dimension asked how frequently respondents used the Internet for each informational activity. The measurements were six categories in the original scale (1 = never, 6 = several times a day), but later recoded into binary variables (never, coded as 0) in the pooled data set for the consistency across all years. The three classifications remain related but discrete dimensions of use diversity in our regression analyses. Correlations among these dimensions, although positively related (r = .33, civic-government and generic info and news; r = .36, economiccommerce and civic-government; r = .43, generic info and news and economiccommerce), were consistently under .50, indicating that these categories may not be ideal candidates for unidimensional analysis. Factor analyses confirmed an extraction of a three-factor solution (in principal component) in the use diversity: rescaled components of (1) .974, for civic-government; (2) .966, for economic-commerce; and (3) .961, for generic info and news, with the explained variance of 61.37%. Threefactor solutions were also confirmed in factor loadings for each year (.92, .70, .70,
Downloaded from crx.sagepub.com at PENNSYLVANIA STATE UNIV on February 20, 2016
10
Communication Research
Table 1. Individual Items. 2005
2007
2009
M
SD
M
SD
M
SD
Civic-government Get information about local council services Pay local council tax/fine/rent/service online Get info about central government services Pay for central government tax/fine/license/ service Get info about schools or education Look up info on MP/local councilor/politician M = 1.077, SD = 1.503, Minimum = 0, Maximum = 6 (3-year aggregate) Economic-commerce Buy a product online Make travel reservations/bookings Pay bills Use your bank’s online services M = 2.471, SD = 1.432, Minimum = 0, Maximum = 4 (3-year aggregate) Generic info and news-related information Look for news Get local event info Look for sports info Look for health/medical info Make travel plans Look for job/work Look for jokes, cartoons, humor M = 4.120, SD = 1.957, Minimum = 0, Maximum = 7 (3-year aggregate)
2005; .84, .79, .86, 2007; .70, .72, .86, 2009). Thus, analytically, we have reason to separate the three dimensions as independent categories, of which the theoretical and empirical foundations derive from prior endeavors as well.
Supply of Internet Access Availability Sum of access location was calculated by counting the total number of Internet access locations available per user (with six possible items of home, moving, Internet café, public library, school/university, and work; M = 1.83, SD = 0.95, 2005; M = 1.95, SD = 1.12, 2007; M = 1.91, SD = 1.02, 2009: Minimum = 0, Maximum = 6; M = 1.898, SD = 1.049, Minimum = 0, Maximum = 6, 3-year aggregate). Sum of access type was estimated by counting the total number of Internet-connected devices available per user (with five possible items of telephone line, cable TV, wireless, digital TV, and
Downloaded from crx.sagepub.com at PENNSYLVANIA STATE UNIV on February 20, 2016
11
Park
handheld devices; M = 1.11, SD = 0.84, 2005; M = 1.48, SD = 0.99, 2007; M = 1.85, SD = 1.23, 2009: Minimum = 0, Maximum = 5; M = 1.481, SD = 1.073, Minimum = 0, Maximum = 5, 3-year aggregate). These items were presented as part of a battery of options following the prompt: Access to the Internet (1) at (location options) and (2) via (type options). Then, the respondents were asked to check (yes or no) in each of the type and location accessibilities.
Stratification The key variable of analysis is the sociodemographic conditions by which the levels of Internet access at the supply side and of the three dimensions of Internet use at the demand side differ. The seven measures of household income, gender, age, education, marriage, race, and employment status (Hargittai & Hinnant, 2008; Katz & Rice, 2002; Kwak, 1999) were used. We constructed the measures of sociodemographic characteristics as consistent as possible across the data sets. Among the variables, race in four main categories of ethnic group membership was coded as White (0) versus non-White (1), and additional regressions include the groups of White, Black, Asian, and Other; education that asked the highest educational qualification, with six categories from “no qualification” to “higher than university,” was coded as university-equivalent and above (1); employment in the categories of retired, unemployed, employed, and students was coded as employed (1) and others (0); marriage was coded as married (1) and other categories of widowed, divorced, or separated, and single (0); age that asked to report the year of birth was computed into years by subtracting that year from each year of the surveys (Minimum = 14, Maximum = 84, 2005; Minimum = 14, Maximum = 99, 2007; Minimum = 14, Maximum = 90, 2009); income was a five-category variable in 2005 and 2007, but the 2009 survey included two high income categories (5 and 6), which were collapsed into one in the pooled data set for the consistency with the other survey years. Sample means for these variables are shown for each year in Table 2.
Interaction Terms In order to carry out the analyses, we created multiplicative interaction terms between the year variable and each measure of sociodemographic indicators. A hierarchical regression was run separately for each of the interaction terms, after controlling for prior blocks that included all the seven measures of stratification. We plotted the interactions, using standardized coefficients in the final equations after controlling for other blocks.
Results Net Diversity Over Time Descriptive trends can be found in Figure 1 and Table 3 also presents the findings from regression tests. First, Figure 1 displays the contrast in the trends of overall growth
Downloaded from crx.sagepub.com at PENNSYLVANIA STATE UNIV on February 20, 2016
12
Communication Research
Table 2. Sample Characteristics. 2005
2007
2009
M
SD
M
SD
M
SD
Gender (female) Age Income Education Married Race (non-White) Employed Internet users
56% 38.80 2.86 0.20 0.47 0.05 0.55 (n = 1,359)
14.89 1.19 0.40 0.49 0.22 0.49
57% 40.55 2.78 0.22 0.43 0.09 0.49 (n = 1,613)
15.61 1.20 0.41 0.49 0.29 0.50
57% 41.87 3.15 0.25 0.49 0.06 0.44 (n = 1,318)
16.18 1.46 0.43 0.50 0.25 0.49
100 90 80 70 60
broadband
50
access type
40
access loca on
30 20 10 0 2005
2007
2009
100 90 80 70
civic-government
60 50
econ-commerce
40 30
generic info and news
20 10 0 2005
2007
2009
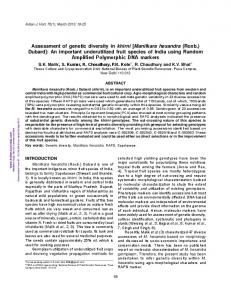
Figure 1. Trend assessment of supply of Internet access and use diversity.
Note. Numbers shown indicate percent (%) of the respondents who reported that they engaged in at least two activities in each dimension of use diversity and had access to a minimum of two in access supply.
between Internet access supply and diverse use, lending overall support to H1. The upper panel of Figure 1 shows a trend of Internet access supply drastically increasing over the 3 sampled years of 2005, 2007, and 2009. As shown, broadband penetration
Downloaded from crx.sagepub.com at PENNSYLVANIA STATE UNIV on February 20, 2016
13
Park Table 3. Trend Assessment of Supply of Internet Access and Use Diversity. Home broadband Supply of Internet access Year 2005 Year 2009 Year (2005-2009)
Access type
β
SE
β
SE
β
−1.19 (0.30) 2.46 (11.71) 1.24 (3.47)
0.17 *** 0.17 *** 0.07 ***
−0.16 (−0.39) 0.14 (0.35) 0.26 (0.37)
0.04 *** 0.04 *** 0.02 ***
−0.03 (−0.07) −0.01 (−0.03) 0.01 (0.02)
Civic-government Use diversity Year 2005 Year 2009 Year (2005-2009)
Access location
Economic-commerce
SE 0.04 0.04 0.02
Generic info and news
β
SE
β
SE
β
SE
−0.10 (−0.35) 0.08 (0.28) 0.16 (0.31)
0.06 *** 0.06 *** 0.03 ***
−0.08 (−0.26) −0.02 (−0.06) 0.05 (0.09)
0.05 *** 0.05 0.03 **
−0.24 (−1.03) 0.01 (0.05) 0.21 (0.54)
0.08 *** 0.07 0.04 ***
Note. Covariates include age, income, education, marriage, employment, gender, and race. The reference year was 2007. The numbers in parentheses are unstandardized coefficients and R2 in final equations are included in Table 4. For the binary variable of home broadband, hierarchical logistic regressions were used, with the numbers in parentheses for odds ratio. **p < .01. ***p < .001.
arose sharply throughout all 3 years and access type also yielded a large gain from 2005 to 2009. The access location increased over time (from 2005 to 2009). However, its yearly gain was not linear as the access location in 2007 was higher than that of 2009, setting it apart from other access measures. The lower panel of Figure 1 displays the trend of the diversity of use, which was different from the access supply of broadband and access type. For instance, the yearly differences, in the discrete dimensions of economic-commerce and generic information and news, apparently diminished over time and in particular, the gains in these dimensions remained flat from 2005 to 2009. The civic-government informational activities arose, but only modestly over the 3-year span. Multivariate analyses display large and significant effects of the year variable for the entire samples from 2005 to 2009 (see Table 3, in the bottom row of the upper and the lower tables). This result, however, needs careful qualification as the year variable tends to mask sensitive year-by-year variations. Instead, the diversity of use, when regressed against the reference year of 2007, show considerable nuances. First, between 2005 and 2007, significant differences in all dimensions (β = −0.10, β = −0.08, β = −0.24, all p < .000) were in fact found. But between 2007 and 2009, no significant gain existed with the exception of a small effect size in civic-government (β = 0.08, p < .000). That is, the significant increase over the sampled years was driven by the initial gains in the earlier period of Internet penetration as the gains from 2007 to 2009 did not reach significance, when controlling for other factors. This is in the contrast with the two dimensions of the supply of Internet access availability (access type and broadband penetration), which showed the consistent and the significant biyearly growths (1) between 2005 and 2007 (β = −1.19, β = −0.16, both p < .000) and (2) between 2007 and 2009 (β = 2.46, β = 0.14, both p < .000). However, there was no significant increase in access location in any of the years. This reflects the nonlinear pattern of the increase in access location as identified in Figure 1 and indicates that the
Downloaded from crx.sagepub.com at PENNSYLVANIA STATE UNIV on February 20, 2016
14
Communication Research
discrete dimensions of the supply of Internet access were not uniformly in gain over the sampled period.2
Disparities in Net Diversity The relationships between sociodemographic conditions and the net diversity, as explicated into the supply of access availability and the diversity of use during the sampled years (RQ1a) were examined in Tables 4 and 5. First, in terms of the access supply (see Table 4), age and income were the consistent predictors for both broadband (β = −0.01, β = 0.27, p < .000) and access type (β = −0.08, β = 0.14, p < .000), indicating that the younger and the more affluent users were more likely to access to broadband at home and have diverse modes of Internet connection during this period. With regard to the access supply, the most resilient social disparities were in the dimension of access location. Although the non-White was significant (with Blacks in a higher level of locational access), other indicators consistently point the persistent disparity, with the poor (β = 0.15, p < .000), the less educated (β = 0.16, p < .000), the older (β = −0.21, p < .000), and women (β = −0.05, p < .01) less attuned to diverse locational access. In terms of the diversity of use, the social divide was also persistent, with education and income levels having the sizable effect sizes in all three dimensions (β = 0.21, β = 0.14, β = 0.15; β = 0.14, β = 0.17, β = 0.07, p < .000). In other words, those with higher levels of education and income were more exposed than those with less privileged positions to the diverse activities of civic-government, economic-commerce, and information and news. In the generic info and news dimension, the disparities of gender, age, and employment status were manifest (β = −0.09, β = −0.13, β = 0.10, p < .000). Interestingly, the age disparity in the dimension of civic-government was in the opposite direction (β = 0.04, p < .05), which indicates that the younger users were less engaged in civic-government related informational activities online. The results concerning the interactions between the year variable and each of the sociodemographic characteristics are displayed in Table 5 (RQ1b). Each interaction term shows the extent to which the disparities in Internet use and access changed over time, controlling for differences in other variables. The findings indicate a trend in which some of the social gaps in the supply of access availability began to dissipate as shown in the positive interaction terms between the year and women, and between the year and marital status (both coded higher; β = 0.29, β = 0.38, p < .05), which suggests that the increase in broadband connection over the sample years was stronger among women and married people. Other significant interactions, however, also indicate that sociodemographic gaps were exacerbated, rather than alleviated, over time. For instance, the interactions in access type display negative relationships between being women (β = −0.11, p < .05), being married (β = −0.09, p < .05), being older (β = −0.27, p < .000), and the year. That is, the gain in modes of access over the sampled years tended to be greater among men, nonmarried people, and younger users. Given no overall effects of gender and marital status (as shown in Table 4), this means that the gains for women and married people remained smaller as their statuses may be also
Downloaded from crx.sagepub.com at PENNSYLVANIA STATE UNIV on February 20, 2016
15
Downloaded from crx.sagepub.com at PENNSYLVANIA STATE UNIV on February 20, 2016
Note. Coefficients indicate the findings after controlling the year, and the separate regressions with additional categories were run for race. The numbers in parentheses are unstandardized coefficients. For the binary variable of home broadband, hierarchical logistic regressions were used, with the numbers in parentheses for odds ratio. *p < .05. **p < .01. ***p < .001.
β
Home broadband
Supply of Internet access
Table 4. Social Stratification of Internet Diversity During 2005-2009.
16
Downloaded from crx.sagepub.com at PENNSYLVANIA STATE UNIV on February 20, 2016
Note. Entries are standardized regression coefficients after the control variables shown in Table 4. The numbers in parentheses are unstandardized coefficients. For the binary variable of home broadband, hierarchical logistic regressions were used, with the numbers in parentheses for odds ratio. *p < .05. **p < .01. ***p < .001.
Year × Gender 0.29 (1.34) Final R2 (%) Year × Age −0.00 (0.99) Final R2 (%) Year × Education 0.08 (1.08) Final R2 (%) Year × Employed 0.13 (1.14) Final R2 (%) Year × Married 0.38 (1.46) Final R2 (%) Year × Race −0.28 (0.75) Final R2 (%) Year × Income 0.09 (1.10) Final R2 (%)
Supply of Internet access
Table 5. Interactive Effects Accounting for Internet Diversity.
17
Park
associated with certain social disadvantages, such as the lack of resources, that can be devoted to self-interest or individual capital enhancement. Likewise, the yearly gains in the diversity of use did not occur uniformly across different sociodemographic groups. The interactions in the economic-commerce use show negative relationships between age, marital status, and the year (β = −0.21 p < .01, β = −0.11, p < .05), indicating that the increase in this dimension of the use diversity was stronger among nonmarried and younger users. In addition, in the civicgovernment-related informational activities, the interaction terms were significant in favor of men (β = −0.10 p < .05), the more educated (β = 0.14, p < .01), the employed (β = 0.12, p < .01), and the more affluent (β = 0.14 p < .05). In other words, the increase in the civic-government related activities during the sampled years was more likely to occur for those who were already in socially privileged positions. Finally, in the dimension of generic information and news, there was no significant interaction between any sociodemographic predictors and the year variable, suggesting that the yearly gain in this dimension of use diversity appeared relatively immune to sociodemographic variations.
Discussion The general proposition in this study was that the shift to the supply of Internet access availability may or may not involve the drastic transformation into the net diversity as the advancement of technological capabilities and the resilience of social conditions may not be in congruence. To test this, we explicated the net diversity in terms of use and access, drawing on prior conceptual and empirical discussions (e.g., Hindman, 2007, 2008; Napoli, 1999, 2011b). For this, we borrow much of the insights from the digital disparity (DiMaggio et al., 2001; Hargittai & Hinnant, 2008; Park, 2013, 2015a, 2015b; Zillien & Hargittai, 2009) concerning social stratification in that there are systematic differences across all segments of the user population in participating widely in civic, political, and economic life. We also reconnect the notion of net diversity to the exposure point of consumption to dissect the actual level of information that comes into use in the Internet, as opposed to the access points across available channels (source of information). Then, the two analyses were performed, based on the three waves of the surveys from 2005 to 2009. First, trend analyses of access and use were made. Second, we examined the sociodemographic barriers to the diversity of use and their resilience over time. A particularly fruitful point of this study is that it considered various sociodemographic determinants and individual-level data in the systematic analysis of who gets into the information diversity of Internet and its benefits, from what backgrounds, and with what trends over time.
Explicating Net Diversity in Social and Policy Contexts It is important to reemphasize that the goal here is to address whether the users at the stage of Internet consumption are in fact to benefit from the full potential of diversity that the Internet can afford. This is not to dispute that the broadband penetration and
Downloaded from crx.sagepub.com at PENNSYLVANIA STATE UNIV on February 20, 2016
18
Communication Research
availability of the different modes of online connections—two distinctive aspects of the supply of Internet access availability—had drastically increased during the sampled period. Descriptive trends also indicate that uses became diverse as users were more exposed to purposeful uses over time, bringing the hope of Internet as embraced by the enthusiasts. Particularly, the rise in civic-government use is potentially a consequence of improvements in supply (government created better websites with more service offerings), as it appears much of the public was already comfortable doing a variety of “complex” things, such as purchasing things, online in 2005. The conventional wisdom may be that the net diversity began to expand in the late 1990s and 2000s when the broadband connection started to spread more widely and the variety of connection modes available removed limited consumer options, making the digital landscapes move to stronger support for the transforming role of the Internet. We are more skeptical, however. First, we found evidence that even net diversity in the hardware-supply side of Internet access, when dissected into discrete dimensions, did not grow uniformly as shown by lack of increase in access locations during the sampled period. Second, plainly, the diversity of economic-commerce and generic info and news-related informational activities actually did not increase from 2007 to 2009, moderating the linear relationship between the time and the diversity of use. We can think of this as the “take-off” in the earlier stage of technological growth and the “leveling-off” in the later stage (Rogers, 1986). This accommodates the traditional finding of an “S” curve rather than a linear growth curve in diffusion dynamics.3 But beyond that, we argue that the diversity of use has suffered from yet another impact of the persistent stratification of gender, age, education, employment status, and especially income, as the gap between rich and poor remained consistent in all the dimensions measured in this study. We speculate that the social disparities ingrained over the years are unlikely to be eradicated with the Internet and to have been shunted to the diversity of use so quickly. Furthermore, its persistence has been facilitated by the disadvantages accumulated over the years as the fragmentation of the social structure entails the profound resilience of disparities that in turn fuel divides in terms of both use and access. Our findings are in line with prior studies (DiMaggio et al., 2001; Hargittai & Hinnant, 2008; Katz & Rice, 2002; Van Dijk, 2012) indicating sociodemographic indicators, such as education, household income, gender, and age, function as consistent predictors of difference in Internet uses. Furthermore, there are consistent findings that suggest stable and enduring influences in one’s social environments help to shape differences in Internet uses (Bucy, 2000). What resonates our findings is Markus Prior’s (2005) famous argument about increased diversity of content (in his case on cable TV) being associated with increased demographic differences in exposure to political news (e.g., those with low SES having less exposure to news). Collectively, the literature suggests the presence of persistent socioeconomic barriers to active participation in the Internet. While this study hints on the possibility that some of the demographic differences in the United Kingdom, notably gender and race, may have been eased out at the access level, little has been known on whether the sociodemographic disparities at the use level alleviate over time in par with the increased supply of Internet access.
Downloaded from crx.sagepub.com at PENNSYLVANIA STATE UNIV on February 20, 2016
19
Park
The key point here is that Internet’s possibility of information diversity is not equally accessible across sociodemographic layers as the disparities at the consumption stage stay resilient over time, rather than changing in congruent with the increase of access to Internet infrastructure.
Resilience of Stratification Over Time Here the contrast between (1) the indicators of Internet access and (2) use diversity, in which the disparities continue to widen in favor of the richer, the more educated, males, and younger users, is noteworthy. This suggests that we may be overestimating the technological potentials of ever expanding communication capacities, despite the greater tendency of societal limits and disparities to persist (Bimber, 2001; DiMaggio et al., 2001; Hargittai & Hinnant, 2008; Katz & Rice, 2002; Van Dijk, 2012), and underestimating the impact of true societal differences in translating the potential of the wider and more diverse ranges of options that the Internet brings (Hindman, 2008), because such translations tend to favor those already in socially privileged positions. In this regard, what we captured looks like the second half of the classic “S” diffusion curve in which the benefits of Internet access capacities become no longer evident with the resilience of social stratification at the point of actual information exposure and use. The finding that non-Whites were more involved in civic-government and generic information and news-related informational activities is interesting. Yet again, the optimism is mixed with the evidence that the underserved community (Black) in the United Kingdom still lagged behind access to broadband, access type, and online economic-commerce activities relative to Whites. Also noteworthy is the opposite direction of the age disparity found in civic-government-related Internet use. While this might present an enabling scenario in which the Internet spreads across generations as older users began to learn its active use, another possibility is that the high-tech profiles of broadband readiness and diverse access facilities among the younger generation may not necessarily translate into diverse uses for political and civic purposes. Our thesis is demonstrated in Figure 2, which shows the interactive effects of (1) broadband penetration and (2) the discrete dimensions of use diversity and the supply of Internet access, respectively. In broadband connection, figures show that the gender gap began to dissipate as the growth in Internet adoption was greater for women than for men during the sampled years (upper panel); the same pattern is shown between the married and nonmarried people, with the gap shrinking over the years (lower panel). The panels in the two columns to the left display different patterns, however, illustrating that education, income, and age disparities widened over time when it comes to the various aspects of use diversity. For instance, the increased diversity in Internet exposures and uses were more likely to occur among those with higher levels of income and education, and among younger people. This pattern also applied with regard to access type and access location. Despite the gains in the supply of access availability among women and the older users over time, men and younger users benefited from the yearly change far more extensively. Likewise, those-unemployed lost
Downloaded from crx.sagepub.com at PENNSYLVANIA STATE UNIV on February 20, 2016
20
Downloaded from crx.sagepub.com at PENNSYLVANIA STATE UNIV on February 20, 2016
0
0
0
1
0.2
2
0.2
0.4
Year Up
0
2
3
Type
o-Comm c Ec
-2
Maale
-1
Singgle
-1
Married
-2
Female
0
0
1
1
Broadband
Year Low
Year Up
Broadband
Year Low
Year Up
Broaddband Connection
Note. We plotted the interactions, using standardized coefficients in the final equations after controlling for other blocks. The combination of 0 (lower) and 1 (upper) was assigned to each of the four groups.
Location
Year Low
2.5
1
Year Up Unemployed
0.5
Year Low
Employed
Male
Year up Year Low
Year Up
Ciivic-Gov
Year Low
Female
Type
1
-0.5 0.5
Younger 0
Year Low
Year Low
Ciivic-Gov
Year Up
Older
Accesss Type/Locatio on
Year Up
Figure 2. Interactive effects for use and access.
Younger
Older
-0.2
Educa on Low
Educa on High
Income Low
Income High
U Diversity Use
21
Park
the ground in access location over time, while the benefit of the yearly increase surged only among those with employment. Collectively, we conclude that these patterns lend strong support to insights drawn from the earlier works (Hindman, 2007, 2008; Napoli, 2011a) in the context of trend assessment. That is, the Internet diversity, when specified into discrete dimensions of individual access and use over time, seems to indicate the resilience of divides rather than widening new forms of the benefits. In the overall context of social disparity, the mediating role of Internet access between sociodemographic factors and Internet use may be fruitful to consider.4 This alternative route of stratification appears particularly important because the broadband connection, access location and type (which are affected by social disparities) are also likely to influence the breadth and types of Internet activities in which people engage. Another possible specification may involve the exposure metric in terms of actual time spent online. This is an interesting scenario to explore because the time spent can be a proxy of the initial step toward actual activities at the exposure of information, possibly as important as the devices or locations used for access. It is possible, for example, that the time exposure could be moderating the relation between sociodemographic variables and use diversity as the actual time exposure may be a critical tipping point that determines the likelihood of the diversity of online content people consume. To examine these, we conducted the two post hoc analyses of (1) the mediating role of access factors and (2) the moderating function of the time spent online. The first analysis revealed that one’s wealth was substantially mediated through Internet access factors in the dimension of news-information (i.e., the effect of income on use via the supply of Internet access, not only a direct route from income to use). This shows both direct and indirect (through access) effects of income, while the significance of income disappeared in the full model. In other words, with the same level of income, those with more access factors were more likely to enjoy a variety of online uses. For the second post hoc analysis, we added a variable of weekly hours spent online and dissected into the high and low time conditions to see changes in the full model that included sociodemographics and all access factors. The most consistent result is that the significance of broadband penetration entirely disappeared for all the three dimensions of use diversity in the high time condition. In the high time condition, the effects of age and gender also disappeared in the dimensions of economic-commerce and generic info and news.5 This highlights the importance of the actual time exposure and related experiences in developing diverse activities and ultimately, alleviating the disparities deriving from age and gender as well as the access factors. Here we can conceptualize the time spent as the first step of actual exposure that helps translate the access into diverse online uses. On the other hand, the finding regarding the mediation underscores the enduring role of access factors in incubating the diverse types of Internet uses (Hargittai, 2010; Hargittai & Hinnant, 2008), while access levels remained systematically divided by sociodemographic statues over the sampled periods.
Social and Policy Implications From the standpoint of social relevance, what remains a source of contention is whether the Internet in a meaningful sense plays a role in diversifying information
Downloaded from crx.sagepub.com at PENNSYLVANIA STATE UNIV on February 20, 2016
22
Communication Research
platforms by offering entirely new forms of production and consumption across different communities (e.g., Ball-Rokeach et al., 2001). The average users’ utilization—as actually exposed to individuals—(see Napoli, 2011a, for exposure diversity) seems limited even when the Internet may provide alternative sources of information or venues. While at the individual level we cannot fully expect each individual to use the full range of channels and contents in her or his online activity, we may still assess whether particular social groups and environments are beneficial for individuals. The core of this concern lies in the broader socialization that may incubate systematic differences in individual capital-enhancing activities in actualizing the net diversity (DiMaggio et al., 2001; Howard & Jones, 2004; Zillien & Hargittai, 2009). In the end, it seems wrong to assume the presence of potentially diverse materials will be within the actual reach of individual users. From the policy standpoint, our findings concerning the resilience of sociodemographic disparities over time suggest that the range of information needs are not truly met by new media platforms upon consumption, and there may be the need to qualify untested claims about the Internet’s potential to advance diversity. To put it differently, the development of “capital enhancing” activities in the net is not bound to increase monolithically (Schradie, 2012). In this vein, policymakers need to refine the notion of diversity that has been understood as the number of available sources or channels per consumer (at least in the United States; see Napoli, 1999, 2011a) because it is not just the volume of information capacity but also the actual use and how it is put into societal contexts. Furthermore, our findings indicate that even on the Internet access supply side, the broadband need can be better measured by going beyond simple binary assessment of adoption, but considering how the supply of access might be actually available by location and type. In this context, the European Union’s policy debates as to whether the multiplicity of new media platforms eases traditional diversity concerns is noteworthy because it rightly highlights the need that the policy principles established in the broadcasting industry may not categorically be extended into new media contexts. Albeit differences, the common concern in the United States and European policy contexts is to what extent the established policy priorities are often too outmoded to be in parallel with the technological transitions underway in new media systems (see Neuman, McKnight, & Solomon, 1993, for a policy paradigm shift). As the increased levels of the supply of Internet access availability continue to be stratified, the argument that there exists no need for promoting information diversity seems tenuous.
Conclusion Instead, policymakers will be better served by the understanding that user capacities remain constrained, which will make it hard for users to be actively engaged in par with the continuous explosion of technological supply. In this vein, whether the reliance on a handful of websites that tailor to individual activities will lead to the concentration in new media landscapes is another question. The future studies must tap into this discussion and raise questions about supply, demand, and economic viability (Neuman, 1991; Neuman, Bimber, & Hindman, 2012; Pareto, 1897; Webster, 2014), taking into
Downloaded from crx.sagepub.com at PENNSYLVANIA STATE UNIV on February 20, 2016
23
Park
consideration the constraints of time and cognitive capacities and consequences of such limits. In this regard, our data do not allow us to directly compare the pace of increase in access supply and use diversity. Additional past trends will further clarify the ratio between access rate and use diversity at the precise points of time.6 Needless to say, the longitudinal panel data are needed to track the changes among the same respondents over time. It would be particularly fruitful to have a composite data set of big traffic data (e.g., Hindman, 2008) and self-reported surveys which may be inherently open to potential bias (e.g., those used in this study) to validate the consistent findings. For instance, the limitation of self-report of online buying should stimulate future researchers to develop more sophisticated measures that may not be vulnerable to individual recall (Neuman et al., 2014). A more cautious interpretation in the civicgovernment activity is also due because the increase can be a product of increased attention to local council services online. It may be that during this period, there was an expansion of local political sites in the United Kingdom, so an alternative explanation is that the growth is fueled in part by the message as well as the medium. Finally, one further possibility for model specification is that we examine psychological factors, such as confidence in Internet use and skill,7 and how perceived selfconfidence will stack up against actual use diversity. This will entail more rigorous structural equation models (SEM) so that we can incorporate various psychological measures of individual efficacy and concern, as well as sociodemographics which base the social status measures as in much of digital disparity literature. No longer useful is a continuous reliance on the traditional notion of information diversity with no consideration of actual use, because the inability to make such a distinction would mask the rise of new sets of diversity concerns amid the hype regarding the transformative powers of the Internet. Acknowledgment The author is very grateful to two editors and reviewers of this journal for kindly recognzing the potential of this work. The author also wishes to express gratitude to a number of scholars who read this work and to the OII for kindly making datasets available publicly for acaemic research. Finally, to my mom, forever.
Declaration of Conflicting Interests The author declared no potential conflicts of interest with respect to the research, authorship, and/or publication of this article.
Funding The author received no financial support for the research, authorship, and/or publication of this article.
Notes 1. We also conducted alternative analyses of count models. Count models (Zero-Inflated Binominal analysis [ZINB]) are appropriate when the distributions of dependent variables
Downloaded from crx.sagepub.com at PENNSYLVANIA STATE UNIV on February 20, 2016
24
2.
3.
4.
5.
6.
Communication Research are overdispersed or more specifically, standard deviations in main variables are significantly larger than (conditional) means. We examined the appropriateness of ZINB (see Long, 1997; Yan & Napoli, 2006) for this study and found no evidence. Still, ZINB can provide useful reference points, given our main dependent variables are additive indexes based on binary variables. While we found no substantial difference from our regression models, some of the main results of ZINB are included for interested readers (income, β = 0.16, β = 0.07, β = 0.03, p < .000; education, β = 0.57, β = 0.17, β = 0.15, p < .000, for civic-government, economic-commerce, and general info/news). Means tests in general linear models estimate the differences between years (2007 vs. 2005, 2009 vs. 2007) and show the contrast in the trends. Two dimensions of use diversity (economic-commerce and generic info and news-related information activities) are increasing between 2005 and 2007 (−0.23, −0.22; −1.02, −1.05), but not in a linear fashion that keeps up with the pace at which the supply of broadband and access type continued to increase significantly between 2007 and 2009. We were puzzled over the anomaly in the hike of location access in 2007. While we speculate that this may derive from a peculiarity of 1 year, this also points to the nonlinear growth pattern of access. In other words, the increase in location access (Hargittai, 2002; Hargittai & Hinnant, 2008) is not drastically significant, but may be more incremental or sensitive to yearly idiosyncrasies than other access measures as this particular metric of access remains a critical hindrance. The lack of increase in generic info/news from 2007 to 2009 can be a function of selected index items. For instance, seeking humor online, which may represent the fads and humor sites in the United Kingdom during this period, entails careful interpretations. Here the path analysis is to unmask the mediating relations between the supply of access and use diversity. For this, we opted for a series of hierarchical regression analyses in separate dimensions (e.g., Hampton, Lee, & Her, 2011). This has several advantages: (1) It helps us to specify the main path effects (and indirect through access) from socioeconomic status (SES) to the use diversity in different foci and (2) it enables us to observe the changes in each model’s explanatory power as a block, as well as each variable. For instance, the substantial changes in R2 with the addition of the access block indicate the variances of mediation played by the access factors. For each variable in significance, we found that the effect of marriage in the civic-government dimension (β = 0.04, p < .05) appeared when access factors were entered as predictors, implying that married people, only through an appropriate level of the supply of access availability (i.e., the number of access location) are likely to invest in/benefit from the civic-government-related informational use. In the model for generic info and news, for instance, age and gender disparities were pronounced in the low time condition (β = −0.11, p < .001; β = −0.08, p < .001) indicating that men and the younger people were more actively engaged in diverse informational activities. For civic-government dimension, race (non-White) was significant in the high time condition (higher than median) as the actual time exposure moderated the race disparity to the extent to which non-White users became engaged with the increased level of time spent online (β = 0.05, p < .05). We standardized the 3-year aggregate into a 20-point scale in 2009 survey (1 = 1-15 minutes to 20 = over 30 hours, then dividing the total by each of home, school, and work hours; M = 4.01, SD = 1.59, 2005; M = 4.47, SD = 1.76, 2007; M = 5.19, SD = 3.26, 2009; M = 4.45, median = 5, SD = 2.33) because the time measure was not consistent throughout the sampled years. The measures of Internet (1) access location and (2) access type were modified from prior studies (e.g., Hargittai & Walejko, 2008) that consistently found Internet autonomy (the
Downloaded from crx.sagepub.com at PENNSYLVANIA STATE UNIV on February 20, 2016
25
Park
number of different locational accesses) was positively related to online skill sets at the individual level. While the access location and type (in the aggregate number of access varieties) may raise a well-grounded criticism for being overly simplistic, this also reflects the binary policy assumption that the information diversity is solely based on the capacities of access availability. The development of more effective alternative measures is overdue to capture the substantial contexts of diverse access facilities beyond binary measures of the individual range of different capacities. 7. We ran three-way interactions among year, sociodemographics, and Internet efficacy (as indicated by self-perceived skill confidence, M = 3.76, SD = 0.81) and the results show the consistent role of self-confidence in moderating actual use diversity. For instance, the interaction terms with education in all the use dimensions (β = 0.32; β = 0.42; β = 0.62, p < .001) displayed the sizable effects. That is, the yearly gains in the diversity of use favored those with the higher level of education as this trend accelerated among those with the higher efficacy in Internet skill. The insightful suggestion for this by the anonymous reviewer is kindly acknowledged here.
References Anderson, C. (2006). Long tail: Why the future of business is selling less of more. New York, NY: Hyperion. Asalama, M. (2009). Participation as position and practice: Rethinking media diversity and policy in the Web 2.0 era (Working Paper). Bronx, NY: The Donald McGannon Communication Research Center. Ball-Rokeach, S. J., Kim, Y. C., & Matei, S. (2001). Storytelling neighborhood: Paths to belonging in diverse urban environments. Communication Research, 28, 392-428. Benkler, Y. (2007). The wealth of networks: How social production transforms markets and freedom. New Haven, CT: Yale University Press. Bimber, B. (2001). Information and political engagement in America: The search for effects of information technology at the individual level. Political Research Quarterly, 54, 53-67. Bonfadelli, H. (2002). The Internet and knowledge gaps a theoretical and empirical investigation. European Journal of Communication, 17, 65-84. Bucy, E. (2000). Social access to the Internet. The Harvard International Journal of Press/ Politics, 5(1), 50-61. Burri-Nenova, M. (2007). The new audiovisual media services directive: Television without frontiers, television without cultural diversity. Common Market Law Review, 44, 1689-1725. Dielman, T. E. (1983). Pooled cross-sectional and time series data: A survey of current statistical methodology. The American Statistician, 37, 111-122. DiMaggio, P., Hargittai, E., Neuman, W. R., & Robinson, J. P. (2001). Social implications of the Internet. Annual Review of Sociology, 27, 307-336. Fallows, D. (2004). The Internet and daily life. Washington, DC: Pew Internet & American Life. Fox, S. (2002). Online banking (Pew Internet Report). Washington, DC: Pew Research Center. Freese, J. (2009). Secondary analysis of large social surveys. In E. Hargittai (Eds.), Research confidential (pp. 238-261). Ann Arbor: University of Michigan Press. Hampton, K. N., Lee, C. J., & Her, E. J. (2011). How new media affords network diversity: Direct and mediated access to social capital through participation in local social settings. New Media & Society, 13, 1031-1049. Hargittai, E. (2002). Second-level digital divide: Differences in people’s online skills. First Monday, 7(4). Retrieved from http://firstmonday.org/article/view/942/864
Downloaded from crx.sagepub.com at PENNSYLVANIA STATE UNIV on February 20, 2016
26
Communication Research
Hargittai, E. (2010). Digital Na(t)ives? Variation in internet skills and uses among members of the “Net Generation.” Sociological Inquiry, 80, 92-113. Hargittai, E. (2015). Is bigger always better? Potential biases of big data derived from social network sites. The Annals of the American Academy of Political and Social Science, 659 (1), 63-76. Hargittai, E., & Hinnant, A. (2008). Digital inequality differences in young adults’ use of the internet. Communication Research, 35, 602-621. Hargittai, E., & Walejko, G. (2008). The participation divide: Content creation and sharing in the digital age. Information, Community & Society, 11, 239-256. Helberger, N. (2008). From eyeball to creator—Toying with audience empowerment in the Audiovisual Media Services Directive. Entertainment Law Review, 6, 128-137. Hindman, M. (2007). A mile wide and an inch deep: Measuring media diversity online and offline. In P. Napoli (Ed.), Media diversity and localism: Meaning and metrics (pp. 327-347). Mahwah, NJ: Lawrence Erlbaum. Hindman, M. (2008). The myth of digital democracy. Princeton, NJ: Princeton University Press. Hindman, M., Tsioutsiouliklis, K., & Johnson, J. (2003). “Googlearchy”: How a few heavily linked sites dominate politics online. Presented at the Annual Meeting of the American Political Science Association, Philadelphia, PA. Retrieved from http://www.cs.princeton. edu/~kt/mpsa03.pdf Hoffman, D. L., & Novak, T. (2000). The evolution of the digital divide: How gaps in Internet access may affect electronic commerce. Journal of Computer Mediated Communication, 5. Retrieved from http://onlinelibrary.wiley.com/doi/10.1111/j.1083-6101.2000.tb00341.x/ full Howard, P. N., & Jones, S. (2004). Society online: The Internet in context. Thousand Oaks, CA: Sage. Katz, J. E., & Rice, R. E. (2002). Social consequences of Internet use: Access, involvement and interaction. Cambridge, MA: MIT Press. Kwak, N. (1999). Revisiting the knowledge gap hypothesis: Education, motivation, and media use. Communication Research, 26, 385-413. Lee, M. (2013). Information and finance capital. Information, Communication & Society, 16, 1139-1156. Long, J. S. (1997). Regression models for categorical and limited dependent variables. Thousand Oaks, CA: Sage. Napoli, P. (1999). Deconstructing the diversity principle. Journal of Communication, 49(4), 7-34. Napoli, P. (2011a). Diminished, enduring, and emergent diversity policy concerns in an evolving media environment. International Journal of Communication, 5, 1182-1196. Napoli, P. (2011b). Exposure diversity reconsidered. Journal of Information Policy, 1, 246-259. Negroponte, N. (1996). Being digital. New York, NY: Vintage. Neuman, W. R. (1991). The future of mass audience. Cambridge, UK: Cambridge University Press. Neuman, W. R., Bimber, B., & Hindman, M. (2011). The Internet and four dimensions of citizenship. In R. Y. Shapiro & L. R. Jacobs (Eds.), The Oxford handbook of American public opinion and the media (pp. 22-42). New York: New York University Press. Neuman, W. R., Guggenheim, L., Jang, S. M., & Bae, S. Y. (2014). The dynamics of public attention: Agenda-setting theory meets Big Data. Journal of Communication, 64, 193-214.
Downloaded from crx.sagepub.com at PENNSYLVANIA STATE UNIV on February 20, 2016
27
Park
Neuman, W. R., McKnight, L., & Solomon, R. J. (1993). The politics of a paradigm shift: Telecommunications regulation and the communications revolution. Political Communication, 10, 77-94. Neuman, W. R., Park, Y. J., & Panek, E. (2012). Tracking the flow of information into the home: An empirical assessment of the digital revolution in the United States, 1960–2005. International Journal of Communication, 6, 1022-1041. Pareto, V. (1897). Cours d’ Economique Politique. Professé a l’Université de Lausanne. Vol. II. Park, Y. J. (2013). Digital literacy and privacy behavior online. Communication Research, 40(2), 215-236. Park, Y. J., & Jang, S. M. (2014). Understanding privacy knowledge and skill in mobile communication. Computers in Human Behavior, 38, 296-303. Park, Y. J. (2015a). My whole world’s in my palm! The second-level divide of teenagers’ mobile use and skill. New Media & Society, 17(6), 977-995. Park, Y. J. (2015b). Do men and women differ in privacy? Gendered privacy and (in)equality in the Internet. Computers in Human Behavior, 50, 252–258. Prior, M. (2005). News vs. entertainment: How increasing media choice widens gaps in political knowledge and turnout. American Journal of Political Science, 49, 577-592. Rogers, E. M. (1986). Communication technology (Vol. 1). New York, NY: Simon & Schuster. Schradie, J. (2012). The trend of class, race, and ethnicity in social media inequality: Who still cannot afford to blog? Information, Communication & Society, 15, 555-571. Valentino, N., & Sears, D. (2005). Old times there are not forgotten: Race and partisan realignment in the contemporary South. American Journal of Political Science, 49, 672-688. Van Dijk, J. A. G. M. (2012). The evolution of the digital divide: The digital divide turns to inequality of skills and usage. In J. Bus, M. Crompton, M. Hildebrandt & G. Metakides (Eds.), Digital enlightenment yearbook, 2012 (pp. 57-75). Amsterdam, The Netherlands: IOS Press. Webster, J. G. (2014). The marketplace of attention: How audiences take shape in a digital age. Cambridge, MA: MIT Press. Yan, M. Z., & Napoli, P. M. (2006). Market competition, station ownership, and local public affairs programming on broadcast television. Journal of Communication, 56, 795-812. Zillien, N., & Hargittai, E. (2009). Digital distinction: Status-specific types of internet usage. Social Science Quarterly, 90, 274-291.
Author Biography Yong Jin Park is an associate professor at Howard University. His research interest centers on social and policy implications of new technologies, spanning the fields of communication policy, media institutions, and new media users. His works appear in New Media and Society, Social Science Computer Review, Telecommunications Policy, Journal of Broadcasting & Electronic Media, Journal of Communication, Communication Research, and more. In addition, he contributed to East Asian section of Privacy & Human Rights Report by the Electronic Privacy Information Center in DC. He obtained a PhD in communications from University of Michigan, Ann Arbor, and an MA in communication management from Annenberg School of Communication, University of Southern California.
Downloaded from crx.sagepub.com at PENNSYLVANIA STATE UNIV on February 20, 2016