. â¡e-mail:
selection of tracts. The main problem with point representations
Exploring brain connectivity with two-dimensional neural maps Radu Jianu∗
˘ C ¸ agatay Demiralp†
David H. Laidlaw‡
Brown University
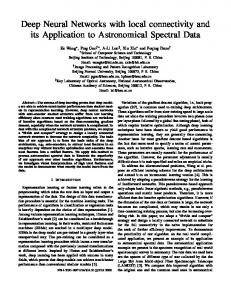
Figure 1: Schematic planar projections of DTI tractograms are distributed either as part of an interactive system (left) or as web-accessible digital maps (right). The digital map interface can easily incorporate any tract-associated information, including labels, links, metrics, and statistics. Shown in the pop-up window on the right is the “brain view” of the selected tract. A BSTRACT We introduce two-dimensional neural maps for exploring connectivity in the brain. For this, we create standard streamtube models from diffusion-weighted brain imaging data sets along with neural paths hierarchically projected into the plane. These planar neural paths combine desirable properties of low-dimensional representations, such as visual clarity and ease of tract-of-interest (TOI) selection with the anatomical familiarity of 3D brain models and planar sectional views. We also provide a web interface by integrating our representation into a geographical digital maps framework. We compare our method to a recently proposed two-dimensional point representation with help of experts. Expert feedback indicates that our new representation is more intuitive, and easier to use and learn. Also, feedback about the web interface provided with a digital-map-like interaction suggests it is useful for collaboration as well as quick exploration of data. Keywords: DTI fiber tracts, path immersion, coloring, interaction. 1
I NTRODUCTION
Low dimensional point representations have been proposed recently for better interaction with DTI fiber tracts [4, 8]. Driven by known embedding methods, these representations provide an interesting window into the manifold space of neural connectivity and ease fine ∗ e-mail:
[email protected] † e-mail:
[email protected] ‡ e-mail:
[email protected]
selection of tracts. The main problem with point representations is, however, that coordinate axes in the low-dimensional space do not have an anatomical interpretation. On the other hand, it is clear from evaluations that having a frame of reference, anatomical or otherwise, is important for potential users. Motivated by this problem, we are presenting two-dimensional neural maps which have the desirable properties of low-dimensional representations while preserving meaningful and familiar coordinates. To this end, we first obtain a hierarchy of two-dimensional neural diagrams from a whole brain tractogram. These can be considered immersions of neural connectivity graphs in the plane, resembling illustrations found in medical textbooks. We then link the two-dimensional neural maps with the three-dimensional streamtube representations. We also augment the interaction on these representations by integrating them into the Google Maps digital map framework, enhanced with labels and statistical data. We assess the usefulness of our approach in comparison to an anecdotal study with neuropsychologists. Expert feedback indicate that our new representation is more intuitive and easier to use and learn. Also, the digital map web interface is evaluated as useful for collaboration and quick exploration of data. 2
R ELATED WORK
By its ability to measure diffusion rate of water molecules, diffusion-weighted imaging (DWI) provides the means to study and visualize the microarchitecture of fibrous tissues such as brain white matter (i.e., collection of myelinated axons) in-vivo [12]. Models of diffusion such as the tensor model (DTI) [3] allow to quantify this anisotropic diffusivity computationally, opening the way to estimating fiber trajectories. These pathways are computed from DTI data by integrating along the principal eigenvector of the underlying diffusion tensor field bidirectionally. This process is called
“fiber tracking” and results in a dense collection of integral curves, called tractograms. These curves are often visualized with streamlines or variations of streamlines (streamtubes and hyperstreamlines) in 3D [10, 13]. Reflecting the intricacy of the connectivity in the brain, these 3D models are generally visually dense. Consequently, typical interaction tasks over tracts, such as fine bundle selection, are often difficult to perform and have been a focus of recent research [1, 2]. Low dimensional point representations have been proposed for improving interaction with DTI fiber tracts [4, 8].
ing questions and collecting participant’s feedback. Two of the experts also tried both interfaces themselves in selecting a set of major TOIs, the corpus callosum, cingulate bundle, uncinate anterior internal capsule, and the corticospinal tract. There was an agreement that our new interface is more intuitive and easier to use and learn than the 2D point representation. Also, they found the web interface with the digital map interaction to be useful for both quick data inspection and collaboration.
The representation introduced here is also a projection of fiber tracts into a plane, but as planar curves rather than single points. It has desirable properties of low-dimensional representations such as visual clarity, ease of tract-of-interest (TOI) selection, and preservation of anatomically familiar coordinates. Augmented with digitalmap-like interaction and linked with traditional three-dimensional streamtube representations, our framework combines advantages of low- and high-dimensional visualization with the functional power of digital maps.
6
3
M ETHODS
Given a whole brain tractogram obtained using fiber tracking (e.g., [10]), we create hierarchical immersions of the tractogram in the sagittal, coronal, and transverse planes. For each projection plane we perform the following operations. We cull out fiber tracts that have a minimal contribution to the projection using the following heuristic: eliminate tracts with a ratio of the projected tract length to the true tract length under a threshold value. We perform a minimum linkage hierarchical clustering algorithm on the remaining tracts in 3D. We then define coarse-to-fine cut thresholds on the dendrogram to produce discrete sets of tract-clusters at different granularity levels. These cut levels determine the hierarchy in our representation. For clustering, we use the weighted chamfer distance introduced in [5], capturing how much any given two tracts follow a similar path, while giving more weight to the points closer to tract ends. For each cluster, we first find the centroid tract, defined as the tract for which the maximum of its pair-wise distances to other tracts in the cluster is the minimum, and then project it onto the given projection plane. Projected centroid tracts define a schematic neural skeleton on which the remaining tracts in the cluster are scaffolded. We use a non-photorealistic rendering for drawing brain projections to produce a sketch look. Projections of centroid-curves are smoothed prior to rendering to achieve a schematic representation and to reduce clutter. This is done by sampling a number of evenly distributed control points along the tract projection and using them to generate a spline. The thickness of a centroid curve is proportional to the square root of the number of tracts contained in the cluster. 4
I MPLEMENTATION
We have implemented a prototype of our method in C++ using G3D, and Qt libraries [6, 11]. In our interactive prototype, we link planar views with the 3D streamtube model of the tractogram (see Figure 1). We also distribute our 2D projections as digital maps using the Google Maps API [7]. This web interface can be accessed at http://graphics.cs.brown.edu/research/sciviz/newbraininteraction/. 5
A NECDOTAL E VALUATION
We compared our method to 2D point based representation collecting feedback from three neuropsychologists. Our evaluation protocol was straightforward; we demonstrated the prototype while ask-
D ISCUSSION AND C ONCLUSIONS
It is important to note that our hierarchical representation relies on the anatomical fidelity of the clustering and similarity measure used. However, it is difficult for a single distance measure to fully capture the anatomical similarity. Furthermore, on the same data, what constitutes a good similarity measure for one purpose can be entirely irrelevant for another. While the choice of similarity measure makes clustering a subjective task, clustering algorithms themselves also have intrinsic limitations [9]. Intuitive low-dimensional and hierarchical representations are useful for exploring and interacting with the intricate brain connectivity, providing visual filtrations and simplifications. In this paper, we have introduced two-dimensional hierarchical neural connectivity maps for exploring the connectivity in the brain. These representations have desirable properties of low-dimensional representations such as visual clarity, ease of TOI selection while preserving anatomically familiar coordinates. Our web-based digital map interface combines the advantages of low- and high-dimensional representations with the functional power of online digital maps. Initial user evaluation indicates our representation using 2D neural maps is more intuitive, easier to use and learn than 2D point representations. R EFERENCES [1] D. Akers. Wizard of Oz for participatory design: Inventing an interface for 3d selection of neural pathway estimates. In Proceedings of CHI 2006 Extended Abstracts, pages 454–459, 2006. [2] D. Akers, A. Sherbondy, R. Mackenzie, R. Dougherty, and B. Wandell. Exploration of the brain’s white matter pathways with dynamic queries. In Proc. of Visualization, pages 377–384, 2004. [3] P. J. Basser, J. Mattiello, and D. LeBihan. Estimation of the effective self-diffusion tensor from the nmr spin echo. J Magn Reson B, 103(3):247–254, March 1994. [4] W. Chen, Z. Ding, S. Zhang, A. MacKay-Brandt, S. Correia, H. Qu, J. A. Crow, D. F. Tate, Z. Yan, and Q. Peng. A novel interface for interactive exploration of dti fibers. IEEE TVCG (Proc. of Visualization), 2009. [5] C. Demiralp and D. H. Laidlaw. Similarity coloring of dti fiber tracts. In Proceedings of DMFC Workshop at MICCAI, 2009. [6] G3D. Website. http://g3d-cpp.sourceforge.net/. [7] GoogleMapsAPI. Website. http://code.google.com/apis/ maps/. [8] R. Jianu, C. Demiralp, and D. Laidlaw. Exploring 3d dti fiber tracts with linked 2d representations. IEEE TVCG (Proc. of Visualization), 15(6):1449–1456, 2009. [9] J. M. Kleinberg. An impossibility theorem for clustering. In NIPS, pages 446–453, 2002. [10] S. Mori and P. Van Zijl. Fiber tracking: principles and strategies-a technical review. NMR in Biomedicine, 15(7-8):468–480, 2002. [11] Qt. Website. http://www.qtsoftware.com/. [12] J. E. Tanner. Transient diffusion in system partitioned by permeable barriers. Application to NMR measurements with a pulsed field gradient. Journal of Chemical Physics, 69(4):1748–1754, January 1978. [13] S. Zhang, C. Demiralp, and D. Laidlaw. Visualizing diffusion tensor MR images using streamtubes and streamsurfaces. IEEE TVCG, 9(4):454–462, 2003.