Exploring Large-Scale, Distributed System Behavior with a Focus on Information Assurance Aaron Helsinger
[email protected]
William Ferguson
[email protected]
Richard Lazarus
[email protected]
BBN Technologies, A Verizon Company 10 Moulton Street Cambridge, MA 02138 Abstract Large distributed, heterogeneous systems (LDHS’s) are increasingly critical to our computational infrastructure, but security research in this area has been difficult. Traditional approaches involve time-consuming and non-repeatable red-team attacks, where results are often incomplete and difficult to interpret. An alternative involves formal analysis of models, but this approach is not feasible with dynamic, heterogeneous systems. The Agent-Based Configurable (ABC) Testbed combines modeling and simulation with innovative visualization. In the ABC Testbed, researchers can model system components at suitable levels of fidelity, execute those models, and analyze the resulting data set, which captures all actions performed by system components, as well as the causes of these actions, or Events. The ABC Testbed’s visualization tool represents these Events as a directed graph, which permits powerful analysis, exploration, and drill-down capabilities. To date, we have developed a prototype of the ABC Testbed, and demonstrated its power by emulating a live experiment and exploring its detailed behavior.
comprehensive data collection, and through the analysis and visualization of this data as a directed graph. Section 2 begins with a description of the problem that we address: the limitations of current approaches to performing IA research on large complex systems. Section 3 provides an overview of our novel approach to this problem, which combines experimentation and simulation, and includes a process by which researchers use the ABC Testbed tools (simulation and visualization) to analyze their results. Section 4 describes the validation experiment that we performed, and our successful results from that experiment. Section 5 discusses the graph visualization and analysis of large, distributed, heterogeneous systems (LDHS’s), including the power of our graph visualization tool, the Event Graph Viewer. Section 6 has a discussion of extensions to our research and the limitations to our current efforts. Section 7 contains our conclusions.
2. Problem Statement: Developing methods for analyzing the behavior of LDHS’s
1. Introduction 2.1. Background The Agent Based Configurable (ABC) Testbed provides a simulation and analysis environment for understanding information assurance (IA) systems. Our goal is to extend basic IA science, rather than test the security of any particular system configuration. Executing the ABC Testbed simulator results in a collection of data structures that represents the relevant behavior of the system, including causes and effects. This data set, the Event Graph, forms a directed a-cyclic graph. The ABC Testbed provides powerful tools for exploring and understanding the simulation results, through visualization and analysis of this Event Graph data. This paper describes our novel approach to basic IA research, through system component models that indicate the causes of their actions, through simulation and
Large, distributed, heterogeneous systems (LDHS’s) play an increasingly critical role in computational infrastructure in both the commercial and the governmental realms. Software architectures that involve computational agents, mobile code, dynamic reconfiguration, distributed planning and execution, and other new capabilities promise to revolutionize the way that many geographically distributed activities are executed. Huge advances in the world’s communication and computational infrastructure are giving rise to a need and a capacity for large, self-controlling software systems. While these developments constitute potentially great news for the customers of distributed processing, they will also bring significant new risks to information security. As well as being vulnerable to all the attacks and
ISBN 0-7695-1212-7/01 $10.00 (C) 2001 IEEE
failures to which simpler systems fall pray, LDHS’s are vulnerable to a new set of attacks. Furthermore, since the capabilities of these new systems will surpass those of their predecessors, the organizations that employ LDHS’s will depend on them to a larger degree than they depend on software now. In particular, many users will rely on LDHS’s to function on a continual basis and to carry on in the face of component failure and component subversion. We define a Large Distributed Heterogeneous System (LDHS) as a system that has more components than are possible to control and monitor from one operator station or position without strong tool support. This often means systems with hundreds of “computing” nodes and many more client stations. By distributed, we mean a system that executes on multiple machines that are not solely accessible to or managed by a single set of trusted operators. By heterogeneous, we mean a system that is composed of many different kinds of software, as well as hardware, components or different kinds of relationships among its components. Agent-based systems are naturally heterogeneous because of the variety of interactions that exist among agents. Some emerging vulnerabilities that pose a particular threat to LDHS’s include the following. 1) Coordinated attacks against multiple, critical nodes. 2) Mission degradation due to individual disabled nodes or links. 3) Subversion of individual nodes and exploitation of the subversion to disable or spy on the entire LDHS. 4) Outsiders looking at large-scale traffic patterns to deduce activities of a “secure” LDHS. 5) False triggering of the LDHS’s security system, which might impede mission performance. Fortunately, LDHS’s allow for the incorporation of new security measures that can thwart some or all of these new vulnerabilities. For example: 1) shared negotiated networks of trust, 2) local modeling of remote components to act as stand-ins or recognizers of pathological behavior, 3) reallocation of tasks and dataflow to avoid compromised or damaged components, and 4) self modeling as a monitoring method. To use these methods effectively to combat new vulnerabilities, system architects require a deeper understanding of the operation of LDHS’s and would benefit greatly from tools that made examinations and insight more accessible.
2.2. The Dilemma Exploration, development and testing of IA mechanisms for LDHS’s is a daunting task. Even visualizing and understanding the behavior of an LDHS that is functioning normally is a challenging problem due to its nature (large, distributed and composed). These difficulties are compounded when assessing the performance of multiple security mechanisms that comprise the security system for an LDHS. This is because these components tend to interact in both
intended and unintended ways. A firewall may block the data that a detector needs in order to diagnose an attack. A trust-based monitor may shut down a component and thereby cause an abnormal traffic flow. The effectiveness of the IA subsystem of an LDHS depends on the security components interacting in the way that they were intended and not in destructive ways, yet the interactions among these components are complex and often cannot be predicted by any tractable method. The success or failure of the security system hinges on the emergent behavior of its components acting in concert. In general, the only way to discover this emergent behavior is to execute the software under various conditions and somehow record what transpires. What is a tractable method for exploring, testing and validating the IA aspects of LDHS’s? Before suggesting an answer to this question in the next section, we will posit that the current state-of-the-art in IA assessment is caught in a dilemma because the two classical methods for assessing system security – red teams and static analysis – possess limitations when applied to LDHS’s. The red-team approach involves setting up an actual instance of the target LDHS (an expensive undertaking) and employing a red team to expose vulnerabilities [1]. This process, while it often identifies weaknesses, is expensive, time-consuming and difficult to control well enough to run repeated experiments for assessing the effects of particular variables. Also, such live experiments are extremely fragile. Red teams often succeed in their goals without even exercising the aspects of the security systems that were supposed to be examined. While this outcome is often frighteningly useful in revealing unknown vulnerabilities, it fails to answer many questions posed by the experimenter. Such outcomes are also often the symptom of experiments that were not well specified. This is a problem that is common in situations where “dry runs” are prohibitively expensive, such as is the case when red-teaming LDHS’s. The second common approach to validating IA for software (and hardware) systems is to develop a formal model of the target system and to apply analytical metrics to this model to assess its weaknesses [2] [3]. This approach can yield meaningful results on moderate sized systems or for large systems that exhibit a great degree of uniformity. In the former case, the static properties of the system are tractable for analytic methods and adequate to delimit much of the system’s potential behavior. In the case of large, uniform systems, their behavior can often be explored by applying scaling factors to the repeated component configurations that are, in turn, amenable to the static methods used for assessing smaller systems. LDHS’s are neither small enough to be assessed statically nor uniform enough to be assessed with analytic generalizations over repeated components. The crux of the matter is that static and analytic methods have no access to the emergent behavior of a system, which is
ISBN 0-7695-1212-7/01 $10.00 (C) 2001 IEEE
critical in IA assessments. When a system reaches a certain complexity, the range of possible emergent behavior is no longer derivable from the static properties of the system. So if experiments and static modeling alone are inadequate, where do we go?
3. Our Approach: Experimentation through Agent-based Simulation The Agent Based Configurable (ABC) Testbed provides a simulation and analysis environment, with an initial focus on the information assurance domain that combines modeling and experimentation. In this Testbed, independent agents, whose detailed behaviors are modeled by “PlugIn” modules, represent all aspects of system behavior. Each model includes the fidelity necessary to represent the behaviors of interest. Execution of these models produces a detailed, time-based Event Graph that captures both the course of actions executed by modeled LDHS components and the evolving state of modeled system resources. For exploration and understanding of IA characteristics associated with LDHS’s, the ABC Testbed provides tools for visualization and analysis of the Event Graph data. The major output of an ABC experiment is a comprehensive Event Graph comprising all relevant actions of simulation entities and state histories of system resources. Example action events include requests for file access or requests to open/close a firewall port. Example state histories include the opening/closing of a firewall port or the escalation of policy. The Event Graph represents all relevant information for experiment comparison, for experiment control and “what-if” analysis, and for analysis tools that facilitate understanding system behavior. In addition, the Event Graph explicitly represents the cause-and-effect relationships as computed by the behavioral models (PlugIns). PlugIns specify all the previous events that are causes for each event that they publish, as part of the event data structure. These are the “little whys,” each of which is important. Together, these references and events comprise a causal network or graph of events. The combination of these individual explanations and the visualization of the “big picture” leads to an understanding of the security aspects of the system as a whole. This approach allows the researcher to make conclusions about the merits of the particular IA technique or component being evaluated. As appropriate for a scalable distributed system, the data behind the Event Graph is distributed across the agent society. Each agent contains appropriate local segments with links to other agents that maintain cause and effect relationships. This information allows either
dynamic or post-processing of these events to develop the metrics appropriate for understanding system behavior. By executing models of suitable fidelity, we produce data that varies only according to the factors of interest, limiting the data and simplifying the analysis. By collecting comprehensive data on the actions and behavior of individual components, as well as the reasons for each individual action, we create a comprehensive collection of data on the behavior of the LDHS’s, along with data on “why” the system behaves as it does. IA researchers can then investigate the workings of the LDHS’s and their IA attributes in particular, by analyzing the Event Graph. While we recognize that models can never be accurate enough for formal validation of the security of a system, our focus is on directed research to understand system level behaviors and component interactions. One method of incorporating additional fidelity with minimal effort is to incorporate actual software components in place of more limited fidelity models. However, this diminishes the researcher’s control over the experimental results. These issues are typical of any simulation-based analysis. Thus, we intend to complement live experimentation with ABC-based experimentation, not replace it. In addition, ABC modeling can amplify the value of live experiments both before and after the live runs: modeling beforehand allows experimenters the luxury of dry-runs to ensure that the data that is being gathered can answer the questions that motivate the experiment. After an experiment has been run, data from the experiment can be used to tune the model, which can, in turn, be used to simulate many variations on the experimental situation, which variations were too expensive to try live. It is our intention that the ABC approach address the dilemma presented in the last section from both sides, by expanding the value of live, red-team experiments, and by greatly extending the utility of models by “executing” them and providing tools for visualizing and exploring their behavior.
3.1. Analysis Methodology The basic methodology for ABC researchers follows a cyclic process. Step 1 is to define the key elements of the system to be investigated. Step 2 is to build models that factor in the variables of interest. Step 3 is to execute these models, producing the comprehensive Event Graph. Then, the ABC tools convert the collected event data into sets of nodes, with attributes, and links, expressing cause and effect, suitable for display as a directed graph. Step 4 is the visualization and analysis of the resulting data. Then, the researcher can repeat the process incorporating knowledge from the previous experiment for further exploration. A researcher analyzing ABC Testbed results starts with a high-level summary of system behavior, e.g., a
ISBN 0-7695-1212-7/01 $10.00 (C) 2001 IEEE
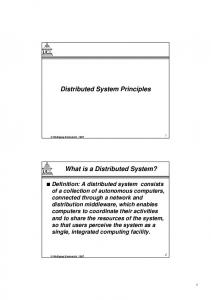
View B
View C View A Figure 1: Navigation among different information displays “quality of service” display. From these summary views, the researcher identifies regions of interest, and navigates to the appropriate regions of the Event Graph. Figure 1 illustrates this navigation process, showing how a user navigates from a tabular display of derived data (View A), to a temporal plot of a single variable (View B), to a display of the subset of events occurring during an observed anomaly (View C), where View C is the Event Graph view. With this Event Graph view, the researcher can identify interesting patterns and action/reaction event pairs. This view (detailed in Section 5) facilitates a highlevel understanding of “what” happened in the LDHS. This illustration can be used for comparing different experimental data sets, allowing quick identification of contrasting behaviors areas and of the effects of parameter variation. Importantly, ABC researchers can quickly reexecute the experiment with slightly different initial conditions or with models of different fidelity. This experiment variation is inexpensive and facilitates exploration. In addition to re-executing the full experiment, researchers can use the Event Graph to perform “what-if” analyses. To do so, the researcher identifies pivotal events, modifies their attributes, and reexecutes the simulation from that point. By building upon previous results, researchers can construct new experiment scenarios, execute those scenarios, and compare them with previous experimental results. Thus, our cyclic analysis methodology facilitates IA research in a manner not previously achievable. A model-based experiment can provide synergy with live experiments. First, the results of a live experiment
can raise confidence in the model if the model predicts the same results. Second, the model enables dry runs of the experiment and permits the researcher to run variations afterwards. Finally, the modeling process and the resulting model add rigor to the experiment design process. The ABC approach facilitates a cyclic analysis methodology. This approach allows researchers to learn from each experiment in novel ways, and readily apply that knowledge to new experiments.
3.2. Agent-Based Simulation Architecture The ABC Testbed employs a novel architectural approach to support distributed simulation. For our infrastructure, we use the open source Cougaar agent architecture [4]. As we are focused on simulating LDHS’s, our infrastructure is an inherently distributed and scalable system. In addition, an agent-based architecture such as this provides a natural metaphor for modeling the behaviors of systems in a distributed manner. During the course of simulation, we can study the effects of the actions of the attack and defense mechanisms on the underlying system behavior. Because we are using a simulation environment, we can measure and log all aspects of performance in order to explore and understand the behavior of large, distributed, heterogeneous systems without compromising the performance of the modeled components. The ABC Testbed utilizes a number of important Cougaar agent architectural features to enhance the simulation and investigation of the behavior of large-
ISBN 0-7695-1212-7/01 $10.00 (C) 2001 IEEE
scale, distributed systems. The ABC Testbed builds upon the basic Cougaar architecture to provide the following capabilities: A PlugIn-based component model: Within the ABC Testbed environment, all entities modeling behaviors or processes are considered “PlugIns” [5]. PlugIns encapsulate all domain aspects of the simulation, including modeled system behavior, wrapped actual software components (software in-the-loop), and human interactions (human in-the-loop). PlugIns are responsible for communicating their actions (as Events) as well as “why” they performed such actions. PlugIns adhere to a consistent API and object model that enables the composition of agents with arbitrary capabilities. A set of PlugIns comprises an agent and provides that agent with its particular behaviors and capabilities. For example, with a set of attack, telnet, detector, and firewall PlugIns, an investigator can construct experiments that analyze the deployment of distributed sensors or that analyze the effects of detector latency. Distributed, virtual Event Graph: PlugIns interact with the local agent blackboard through a publish/subscribe mechanism. Each PlugIn subscribes to events of interest, and then responds to these events (or a pattern of events) by publishing a subsequent event (or pattern of events). ABC events are different from “external” events and they represent only the manifestation of “external” events within the components and assets of the simulation environment. PlugIns indicate the causal relationships (when possible) of all the events that they publish, as references to other events. Thus, the Event Graph (which represents the collection of all simulation information) forms a directed a-cyclic graph (DAG) and encompasses the collection of local agent blackboards across the society of agents. This Event Graph information can become large and possibly intractable for a single computer. As the agents represent “self-sufficient” compute entities, the agents can be distributed over an arbitrary number of computer platforms (one to a computer, at the limit) without incurring additional modeling work. A composable object model: Our approach employs a hybrid class hierarchy and composable-object representation paradigm. In a composable object-based representation, one is concerned with the characteristics of an entity (what does it do) rather than the type of the entity (what it is). For example, the representation of software or applications as part of a system is difficult (possibly intractable) as there are many types and variations on those types. Consider a firewall application. One instantiation might contain http and ftp services while another instantiation could contain ftp and ssh services. In addition, these firewall applications could be developed by different vendors and possess different properties. Using a composable object-based representation, one could enumerate an application class
with a PortService property group or more specifically, a FTPPortService and a HTTPPortService. Another advantage of this approach is that the developer can dynamically instantiate objects with new or additional capabilities without recompiling the system – a great advantage in a world that is ill-defined and rapidly evolving. Mixed-fidelity modeling support: To support the simulation and investigation of large-scale systems without incurring an immense modeling effort, our simulation construction and model approach specifically supports mixed-fidelity modeling. Our simulation paradigm comprises the modeling of a small set of highfidelity components to support the specific investigation or hypothesis in conjunction with lower-fidelity models to provide the surrounding behavior of a large, distributed system. In this manner, actual software components can be incorporated into the simulation environment (as highfidelity PlugIns). While the Cougaar architecture provides us with an underlying agent infrastructure, it is an infrastructure that is optimized for performance with respect to the logistics domain, where the situation is constantly changing and time constants are relatively long [6]. For this environment, the Cougaar architecture design is inherently asynchronous and non-deterministic – there is no consistency of asset state nor ordering of message delivery. While this is acceptable (preferable from a performance perspective) in the logistics domain, it is not acceptable for a simulation environment where repeatability is of prime importance. Thus, we reimplemented some of the core Cougaar components to achieve repeatable and deterministic behavior. These implementations include a new PlugIn base class, object queue managers, and asset manager components to synchronize all PlugIn actions, asset state changes and message propagation.
4. Experimental Results: Emulation of a “live” experiment As we implemented the ABC Testbed system, we designed a series of experiments to validate our approach and implementation. We selected a previously conducted experiment that employed a traditional red-team approach, and set out to emulate it. By successfully modeling the significant system components and executing our models, we hoped to produce results consistent with those produced in the live experiment. Our goals in this effort were both validation and demonstration of value. As previously stated, the ABC Testbed is designed to augment traditional IA experimentation techniques, and provide visibility into the workings of LDHS’s. In particular, the ABC Testbed is intended to provide reproducible, low-cost experiments
ISBN 0-7695-1212-7/01 $10.00 (C) 2001 IEEE
P lu g In m o d e ls s o ftw a re c o m p o n e n ts
R o u tin g C lu s te rs m o d el h o s ts
F irew all
“lo g in ”
“lo g in ”
T e lne t C lie n t
A tta c k T re e N a vig a to r
OS
“lo g in s u cc e ss fu l”
A tta c k er R o u tin g
T e lne t S e rve r
V ic tim D e te c to r
R o u tin g
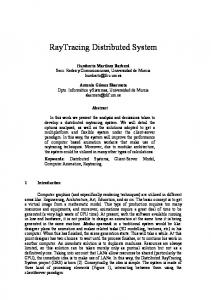
Figure 2. Experiment scenario and layout with clear, understandable results. To measure our success and validate our claims, we needed to demonstrate that experiments can be readily modeled on the ABC Testbed system, that those experiments are reproducible, that we produce comprehensive results, that the Event Graph viewer displays results clearly, and that such modeled experiments augment live experiments. These goals required selecting a scenario to model that is well understood, so that we could judge the validity of our results. In addition, we required well-documented results from the live experiment with which to compare our results and, perhaps, to which our model might add insights. Finally, we wanted a simple scenario with only a few well-understood components. We met these requirements and validated our approach by emulating the DARPA Information Assurance & Survivability (IA&S) program’s Autonomic Information Assurance experiment 001 (AIA-001).
4.1. Experiment Scenario AIA-001 met our requirements as a relatively simple experiment with a few well-understood software components and detailed recorded results. (Many other “live” experiments had incomplete or otherwise difficultto-interpret data.) While this section describes the AIA001 experiment, additional details are available on the project web page [1]. AIA-001 was conducted to test the hypothesis that slower response times make simple responses less effective. That is, the experiment is focused on a standard type of IA system with a built in defense mechanism that detects an attack in progress and takes some simple response action to prevent the attack, like killing the login session of the attacker. The response latency is defined as the time from a detectable attack action to the time that the resulting response is taken.
In this experiment an attacker exploits a known weakness in the Pluggable Authentication Module of RedHat Linux 6.0 to gain root access to a system. (The “pamslam” attack, CVE-2000-0052, published 1/4/2000.) The attack used an automated attack tool, which was configured to make repeated attempts to gain root access until either it was successful or the number of attempts exceeded some limit beyond which visibility and risk of exposure was too great. The “Victim” system included a detector programmed to look for the attack and implement a simple response. Since the purpose of the experiment was to investigate the effect of response latency, the detector was configured to be “omniscient” – the detector was informed, via an outof-band channel, of the exact moment when the attack began, such that it could then begin counting the latency for that trial run. The detector would then either kill the login session of the attacker, or both kill the session and remove the attack script that the attacker was building. Then, for each response type, the experimenters measured the percentage success rate (over 10 trials for a particular detector latency), time to success, and number of steps to success or failure, over varying latency values (where success is defined as gaining root privileges). For our experiment, we emulated the hosts used in AIA-001 and the services and behavior of the key software executing on the hosts during the live experiment. The experimental configuration followed the layout pictured in Figure 2. There were three hosts, modeled by three ABC agents: the Attacker, the Victim, and an intermediate Firewall. Each agent contained a few PlugIns, each modeling a specific software component executed during the AIA-001 experiment (e.g., telnet). The attacker script telnet’ed into the Victim using a known account, built the attack script, and executed it. The detector on the Victim looked for the beginning of
ISBN 0-7695-1212-7/01 $10.00 (C) 2001 IEEE
this sequence, waited during the prescribed latency period, and then performed the appropriate response.
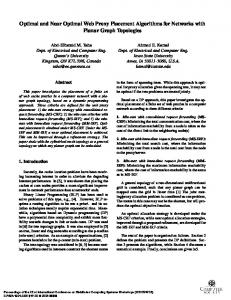
4.2. ABC Simulation and Analysis Results For our initial plumbing test, we manually executed multiple trials of our simulation scenario, varying the operation taken by the detector (kill the session, or kill the session and remove the attack script), and also varying the latency period between attack detection and attack response. In the future, we plan to build automated tools for conducting multiple trials with varying parameters. For each experiment configuration, we recorded some standard IA experimentation metrics: attack success or failure, number of attacker actions (a measure of attacker workload and risk), and attack duration (longer duration indicates increased attacker exposure and a more effective response). Each of these metrics is recorded by the attacker, and helps measure the effectiveness of the response measure versus that of the attack. Figure 3 provides an example of that recorded data. In this experimental trial, the reader can see that the attacker was successful in its first iteration, after 8 steps and 901 simulated milliseconds.
Figure 3. Successful attack statistics To verify the ability of the ABC Testbed to generate reproducible results, we executed each of our key scenarios multiple times and compared the results. As anticipated, the results were identical each time, confirming deterministic nature of our simulation architecture. We entered our data into a spreadsheet and produced line graphs that follow the same format used in the experimental data from AIA 001. We found that our results were nearly identical to those of the live experiment, as seen in Figure 4, for the case where the detector killed the attacker’s login session. When the detector responds quickly (small latencies), the attack
always fails – the attacker is logged out before he can execute the attack script to attain root access. When the detector responds slowly (large response values), the attacker achieved root access before the session was killed, with a clean transition between the two regions. These results clearly validate the viability of our approach and the possibility of producing the complex results of a live system by modeling only the few key software components of the live system. It is worth noting some points about our models. The fidelity of each model was chosen to support our specific experiment, rather than the general case. Each PlugIn included time response values for its operations. We derived these values from the response times observed in the original experiment when no detector was involved. The validity of those numbers under the stress of the detector’s response was not guaranteed, nor was the success for which we had hoped. We did note one difference between our results and the original results: the original results show a short increase in success percentage before regular success was possible, which we did not observe. Through the use of our modeled scenario, we were able to point out the anomalous nature of this rise, and the fact that it does not appear integral to the operation of any of the key components. Since we only modeled a limited set of variables, by exclusion we can determine that this short rise is not due to any of them. The original experimenters hypothesized that this rise might be due to background traffic through the firewall, which they did not measure and we did not model. Due to the expense of running such live experiments, it was relatively difficult for them to repeat the experiment to account for this and accurately measure its effect. But through the use of executing models, the ABC approach would allow a researcher to add another component to account for this variable and easily repeat the experiment to investigate this hypothesis. We gathered data and plotted other metrics that help in understanding the workings of this complex system. A common metric is attacker workload (how hard did the attacker have to work to succeed), as measured by the number of steps taken before succeeding or giving up the attack. In Figure 5, we have plotted this metric in blue, overlaid with the percent of successful attacks, in red. As expected, the attacker works hardest when it runs multiple times and completely fails. And when the latency is quite long, the attacker does not work very hard and always succeeds. But the transition from many attack steps to few turned out to be unexpectedly complex. This was a (relatively simple) case where the interaction among our simple models was complex and not readily predicted. In this case, the attacker’s overall workload changes depending on when the detector kills the login session. When the attacker is logged out while waiting for the attack script to execute, the attack graph dictates that the
ISBN 0-7695-1212-7/01 $10.00 (C) 2001 IEEE
Figure 4. Comparison to live results
Figure 5. Attacker workload (“kill” response) attacker take several additional steps before completing the attack. Therefore, there is a high plateau in the workload graph, as seen in Figure 5. By running our simple models we were able to discover results not predictable from previous analysis. All this was possible because of a few models of appropriate fidelity. By modeling the background network traffic on the router, we would understand that blip. We were able to model exactly the variables in which we
were interested, and in that way control what we measured in our experiment. We modeled only those components that were key to understanding the effectiveness of the response mechanism, and only to the level of fidelity required for this scenario. We did not model, for example, the full functionality of the operating system on the Victim machine, but only those operations required for our scenario. We determined the required fidelity of our models by examining the log files from the live AIA-001
ISBN 0-7695-1212-7/01 $10.00 (C) 2001 IEEE
experiment. From this data, we determined the operations that were performed, and timing data on how those operations were performed, for incorporation in our models. However, our models were not completely scripted based on those log files, but were built to be generic computing engines, albeit with limited and specific functionality. Of the components that we built, several had interesting and powerful features. Most significantly, we built a responsive scripted attacker component, which executes attack trees defined in XML files. Secondly, we built generic Telnet client and server components. Finally, we built a simple operating system model, with a fairly complex model of a file system. To connect these components, we built mechanisms for transmitting the simulation events between agents and for routing these events to the appropriate simulated hosts. For these limited fidelity models (PlugIns), we required approximately two person months of effort. It is our intention to build a library of such components that would greatly reduce the effort to conduct future experiments. In summary, we emulated the DARPA IA&S program’s AIA-001 experiment to validate the ABC Testbed approach of executing modeled components to understand LDHS’s. We additionally demonstrated the power of the Event Graph for system visualization and experiment analysis, particularly for such large complex systems and their information assurance properties.
5. Event Graph Visualization and Analysis Although data analysis and plotting gave us interesting results, the most powerful and intuitive view of the experiment was the Event Graph itself. Given a high-level picture of the overall system behavior and the ability to save past analyses, researchers were able to systematically vary initial conditions and compare the results. Researchers were able to detect patterns and identify anomalies, and by controlling the variables included in the models they could quickly identify variables responsible for observed output conditions. Once this high-level analysis is done, the researcher could drill down into other areas of interest. Support for this style of experimental investigation requires an array of visualization and analysis tools. Our work to date has focused on developing an Event Graph viewer and temporal plotting tools. These will be expanded to include other displays that emphasize particular properties and relationships among the data; for example, a logical network-based layout, a geographical display, an attack tree display, and other time-based graphs and animations for displaying derived characteristics such as attacker exposure over time. Linkages between data appearing in these displays will allow drill-down by moving from one display to another as one selects and highlights new relationships. This
linkage is illustrated in Figure 1, where we see the user moving from a tabular display of derived data (View A) to a temporal plot of a single variable (View B) to a display of the subset of events occurring during an observed anomaly (View C). The power of causal event graphs has been demonstrated in other research; for example, the Rapide project at Stanford University [7]. Rapide was developed to model software and hardware system architectures, and recently has been applied to intrusion detection research, about which it reports, “Because the context of events is maintained, user driven drill-down from a notification message back to the root cause is possible” [8]. Operations on causal event graphs that produce abstracted views of an architecture’s behavior are an important thrust of this research [9]. Future ABC research expects to apply the analysis techniques explored by Rapide to our own event structures and simulation infrastructure.
5.1. Visualization Tools The ABC researcher needs to see into the behavior of the modeled LDHS: what happened in the system, when did it occur, and why did it occur. To support this, each action or state change in the ABC system is recorded as a type of event, and this record includes supplementary information about the action (foremost being a list of other events representing immediate causes of the action or state change). The answer to why a particular event occurred is captured in the causal flow of the events leading up to it. The Event Graph viewer displays a directed graph of the events (nodes) and the causal links (edges) to aid in this visualization. The Event Graph data is retrieved, as required by the User Interface (UI) client, from the distributed society of agents, each of which contains a locally generated piece of the Event Graph [10]. The viewer was designed to address two complementary visualization goals: 1) to get all relevant information in front of the researcher in a dense but readily interpreted encoding, and 2) to provide tools to negotiate and transform the view to selectively and interactively explore the events and causal relationships depicted in the graph. The Event Graph viewer uses color and shape to encode the origin and type of events drawn. The color of a node indicates the agent in which the event was generated. This makes it possible to tell at a glance where in the system an event occurred (Victim, Firewall, or Attacker). The shape of a node distinguishes among the principal event types (Java classes) that were modeled. Naturally-paired event types (for example, Command and Command Response) have symmetric shapes to improve recognition. Figure 6 shows the legend for the Event Graph viewer. The shapes have proven to clearly
ISBN 0-7695-1212-7/01 $10.00 (C) 2001 IEEE
Event Graphs, which can grow to be very differentiate among the various types of large and unwieldy. Multiple windows can events within the system. be opened on the same graph to inspect The result is a highly intuitive display, disjoint portions of the graph. Subgraphs can allowing the user to simply read off the be selected and copied to other windows; behavior of the system from cause to effect. and selection and highlighting are reflected As seen in Figure 7, the arrows in the graph in all windows showing the same events. An facilitate tracing from cause to effect. In this overview window shows the entire graph example the analyst may more easily and provides a reference frame for creating understand that one event kicked off a large and identifying other views. Figure 8 chain of events, which began in the agent illustrates some of these operations. Manual coded green (the Attacker), went through the interaction is only the first step in making yellow agent (the Firewall), and then to the the Event Graph viewer tractable as an red agent (the Victim). analysis tool. We have experimented with The layout engine used in the Event Graph forms of filtering and transforming graphs to Viewer is part of the Graphviz package from simplify the task of detecting features in the AT&T [11]. The display is based on a Java causal relationships among events. implementation of the graph renderer (called A straightforward simplification is to not Grappa). display all the events in the graph. By The viewer supports several operations to selecting a set of events within the graph, an aid the researcher in tracing causality and analyst can isolate a processing region or identifying events or event patterns. From a event pattern for future comparison and selected node (or set of nodes) the user can analysis. Through a dialog, a user can limit highlight the transitive closure of the causal the display to events within a particular time links to better inspect chains of causes or window, events from a particular source (for effects. The user can also highlight events Figure 6: Event example, only look at events generated by occurring before or after a selected node (or Graph legend the Attacker) or by type of event (for set of nodes), whether or not they are causally example, ignore all Asset events). Of course, by related. The display can be zoomed in or out arbitrarily to completely omitting events one can produce broken see more detail or view large-scale patterns of events. chains of causality. Each node is labeled with minimal identifying A more robust scheme transforms the complete graph information. A slightly more expanded summary appears into a simpler graph but preserves the causality (at the beside the node as a “tool tip” when the cursor dwells on cost of having to compute and traverse the entire graph). an event. A double-click on a node pops up a dialog box In the current system, users can create a reduced graph by containing a complete description of an event, as in hiding events of a particular type. The causal links Figure 8. passing through a hidden node are still drawn (because Other operations in the Event Graph viewer are “cause” is a transitive relation). In Figure 9, events designed to help the researcher manage the complexity of
Figure 7: The Event Graph Viewer illustrates an experiment
ISBN 0-7695-1212-7/01 $10.00 (C) 2001 IEEE
Figure 8: Event Graph operations - zooming, selection, identification, drill-down
Figure 9: Hiding Routing Events simplifies the display indicating the routing of messages between simulated hosts have been hidden, as shown by the thicker arrows. Producing a reduced graph by hiding events is an instance of a more general capability planned for the Event Graph viewer; namely, the ability to define general mappings between subgraphs to produce abstract versions of the Event Graph for analysis and comparison. In the course of an experiment, the researcher may be interested in assessing the impact of a change in an input variable from run to run by comparing Event Graphs. In Figure 10, we compare the shape of the graph when the detector responds relatively quickly (top, 650ms. latency), against a much slower response (bottom, 1000ms.). A review of the Event Graphs indicates that they share an event labeled “Session-Handler; kill,” but the results of
this event vary widely. In fact, this event represents the response of the detector. When the detector is quicker, this results in the session being killed, and the attacker starts over by logging back into the Victim host. (Note that the layout of the graph in this view is strictly topological; it does not depict the time at which an event occurred. Therefore, two branches of the tree are laid out in parallel, although one, starting with the “kill” event, happened after the other had completed.) When the detector is slower, its response is completely ineffective, as the attack has already completed. This is a simple example of the kinds of analyses that become possible with this graphical representation of experimental results. The tractability of this kind of analysis requires support for detecting patterns and comparing Event
ISBN 0-7695-1212-7/01 $10.00 (C) 2001 IEEE
Graphs. We envision a mixed initiative approach that involves the user in bounding and directing the pattern search-and-comparison process. A graphical tool for defining patterns and mappings by example is planned.
6. Extensions of Research While we have made progress towards developing an environment and toolset for the testing and analysis of LDHS’s, there exist a number of enhancements for increasing usability, and a number of possible directions for expanding the exploration capabilities of the ABC Testbed. These enhancements include view navigation aids, data abstraction and filtering techniques, and scalability issues. We have given thought to a few of these issues that may increase the value of our current work: 1) In our first experimentation effort, we produced Event Graphs of approximately 3,000 nodes. We anticipate the need to scale to graphs that are orders of magnitude larger. Graphs of this size will pose two interesting challenges, one computational and the other in the user interface. The ABC tools will have to carry out graph manipulations – searching, extracting, summarizing, and matching – on very large data-structures. In order to accomplish this, we will exploit ABC’s distributed architecture and develop (or extend) distributed algorithms and heuristics for accomplishing these
functions. To our benefit, the data-structures representing the graph are distributed across individual ABC computational nodes. The user-interface challenge becomes critical as we scale to problems of large complex systems. A graph that contains 100,000 nodes (and even more links) is not humanly viewable in its entirety. Even “zooming out” is of little use, unless the layout algorithm automatically abstracts or summarizes some of the information. Rather than rely entirely on an automated approach, we plan a mixed-initiative approach to make the exploration of large graphs possible [12]. Our approach allows the user to guide graph summarization and pruning during data retrieval by the UI client, before presenting the whole graph or large sections of it. The challenge will be to provide the user with sufficient information to make good graph reduction choices. 2) A key aspect of modeling the actions of LDHS’s is modeling their environment. For IA subsystems the modeling focus is on attacks against the system and other events that might compromise the system’s operation or that might interact in other ways with the system’s security mechanisms. We intend to develop a taxonomy of external Events and a language for describing their effects over time and geography. This language will be versatile enough to express the course of attacks that react to the defensive actions of the victim LDHS. The language will also include a probabilistic component that will allow users to specify noise or chaotic events. The
Figure 10: Comparing two Event Graphs
ISBN 0-7695-1212-7/01 $10.00 (C) 2001 IEEE
ABC Testbed will include components that can interpret this language to generate and expand external events into specific, low-level impacts on the LDHS under investigation. 3) A strong tenet of our approach is the reliance on causal graphs as a basis for investigating behavior, but there exist limitations in comprehensively collecting the necessary information to understand every system action. First, causal graphs (as we have implemented them to date) do not capture the reasons that a particular behavioral model did not do something (as opposed to the reasons it did do something). This means that in order to answer questions like “why wasn’t this attack blocked” an investigator must have a similar case where the attack was blocked and compare it to the case where the desired action did not occur. This may not always be possible. Second, some system components will exhibit what we call “diffuse causation,” meaning that the component takes actions because of some cumulative reaction to many or all of the events that it has processed (e.g. a scheduling component that employed a genetic algorithm or a fuel level sensor that is responding to the sum of many fuel-outflow events). Components like this will reduce the value of the event graph. Finally, as we begin to mix modeled components and real components in our experiments, we will be incorporating components that were not designed to provide antecedent links on the events that they generate. We will either have to add these links in the case where they can be derived outside of the component or live without them, again reducing the power of the causal graph. 4) Our modeling approach is subject to the limitations shared with any modeling effort. That is the concern that models cannot have the fidelity to provide reliable knowledge about the behavior of real systems. While we acknowledge this difficulty and the cost of its attendant mitigations (the work needed to tune and validate models), we anticipate, and have demonstrated, the value of the ABC Testbed in exploring possible system behavior and elaborating human red-team experiments even with limited fidelity. As discussed earlier in this paper, the use of mixed-fidelity models and wrapped, actual software components may mitigate the cost of addressing this issue.
actions, and the visualization and analysis of this causal data collected in the form a large directed graph. The ABC Testbed team successfully demonstrated the power of our modeling plus experimentation approach to IA research, by emulating a live experiment on the prototype ABC Testbed and analyzing the simulation results. The resulting causal-based Event Graph data, not only illustrated the power of our visualization tool, the Event Graph Viewer, but also expanded on the results of the original experiment. The powerful ABC Testbed analysis methodology and tool will enable new exploration of LDHSs, combining modeling and traditional red-team investigations of IA. As this research extends to the design and verification of complex LDHS’s, tools such as the ABC Testbed will become increasingly critical in the successful deployment of these systems.
7. Conclusions
[3] Swiler, Laura Painton, Phillips, Cynthia, Gaylor, Timothy, “A Graph-Based Network-Vulnerability Analysis System”, Sandia Report SAND97-3010/1, Sandia National Laboratories, January 1998.
Exploration, development and testing of IA mechanisms for LDHS’s are emerging as challenges as these systems become more critical to our computation infrastructure. We have argued that experiments and static modeling alone are inadequate methods for contending with the IA aspects of LDHS’s. This paper introduces our novel approach to basic IA research, through the execution of models that record the causes of their
8. Acknowledgements This work is sponsored by the Defense Advanced Research Projects Agency (DARPA), Information Systems Office, and the Air Force Rome Laboratory as part of the Information Assurance and Survivability (IA&S) program under Contract F30602-00-C-0082. The authors acknowledge the ideas and efforts of the ABC project team that are described in this paper. The ABC project team members include Wilson Farrell, Brian Krisler, Bruce Roberts, Karen Sirois, Virginia Travers, and Todd Wright. The opinions expressed in this paper are those of the authors alone, and not those of DARPA, USAF, or Verizon.
9. References [1] Autonomic Information Assurance Experiment 001 results, https://ests.bbn.com/dscgi/ds/py/View/Collection-481/. [2] Jha, Somesh and Wing, Jeannette M., “Survivability Analysis of Networked Systems”, to appear in Proceedings of the International Conference on Software Engineering, Toronto, May 2001. Preliminary version available as CMU-CS-00-168, October 2000.
[4] Cougaar Open Source Web Site, http://www.cougaar.org. [5] ALPINE, Cougaar PlugIn Developers’ Guide, Version 6.4, September 2000. [6] ALPINE, Cougaar Architecture Document, Version 6.4, September 2000.
ISBN 0-7695-1212-7/01 $10.00 (C) 2001 IEEE
[7] Rapide project web site, http://pavg.standford.edu/rapide/. [8] Complex Event Processing for Intrusion Detection web site, http://pavg.stanford.edu/ID. [9] L. Perrochon, E. Jang, D.C. Luckham, “Enlisting Event Patterns for Cyber Battlefield Awareness,” DARPA Information Survivability Conference & Exposition (DISCEX’00), IEEE Computer Society Press, Hilton Head, South Carolina, 25-27 January 2000. [10] N. Combs, M. Brinn, and T. Carrico, “Every agent a web server: Every agent community an intranet …”, to appear in Agents 2001: Fifth International Conference on Autonomous Agents, Montreal, Canada, May 2001. [11] GraphViz Open Source Web Site, http://www.research.att.com/sw/tools/graphviz. [12] M. Burstein, and D. McDermott, “Issues in the development of human-computer mixed initiative planning,” Cognitive Technology, B. Gorayska and J.L. Mey (eds.), Elsevier, 1999, pp. 285-303.
ISBN 0-7695-1212-7/01 $10.00 (C) 2001 IEEE