Today the purchase of external data is necessary for most direct marketing applications. No company can refer to the internal data alone, especially when ...
Proceedings of the Sixth International Conference on Information Quality
External Data Selection for Data Mining in Direct Marketing (Practice-Oriented Paper) Dirk Arndt, Wendy Gersten DaimlerChrysler AG, Research & Technology, Data Mining Solutions, FT3/AD, PO BOX 2360 89013 Ulm, Germany {dirk.arndt, wendy.gersten}@daimlerchrysler.com
Abstract. Today the purchase of external data is necessary for most direct marketing applications. No company can refer to the internal data alone, especially when targeting new customers. This paper discusses an integrated approach detailing how to select external data sources properly. For that, we try to standardize the selection process, to make it repeatable and to give practical hints in order to overcome handling issues. Therefore, we talk about tools, experiences and perspectives. We start with a detailed problem description and then develop a general process model. In subsequent sections, we discuss how to collect, measure and aggregate the selection criteria without loosing too much information quality.
1
Introduction
Uniformed products, along with individualization of customers, has brought pressure for change in marketing practices. This implies that additional product benefits are generated by means of communication and services that are designed and delivered to match the customers’ individual expectations and needs. This is one of the main goals of direct or database marketing. “The new direct marketing is an information-driven marketing process, made possible by database technology, that enables marketers to develop, test, implement, measure, and appropriately modify customized marketing programs and strategies. [14]” Data Mining is the process of data exploration and analysis, which can be used to support these tasks [3]. In order to develop customized or even personalized dialogs and services in direct marketing, marketers use, e.g., attitude, lifestyle, behavioral, and usage information (data). Generally, these data are available from different data sources within and outside the company [1]. Although directly captured data (internal data) provides unique information concerning our own customers, brands and products, these data are not always available or of sufficient quality. In many cases, purchasing additional data from outside the enterprise (external data) can enhance the overall data situation for the direct marketing tasks on hand [2]. If a company intends to buy external data, it faces several difficulties. Since there are different types of data sources offered by multiple data providers, it is quite hard to find the best choice.
44
Proceedings of the Sixth International Conference on Information Quality
Today’s business practice often leans towards convenient and inconsiderate ad hoc decisions. Consequently, many attempts to develop problem solving data sources are sentenced to fail [7]. Therefore, we demand a standardized assessment approach, containing a process model and proper comparison criteria. In this paper, we introduce an approach that tries to fulfill this demand. It was developed and tested for the selection of external data by DaimlerChrysler. In section 2, we start with a problem description. Next, section 3 introduces the complete process model. The individual steps of this process are described in section 4. Here we discuss for each step, how to execute the tasks, what experiences we have made and what difficulties we were confronted with. In sub-section 4.3, we explain the most intensive process step (close-upexamination). For that reason, it is more detailed and includes a system of comparison criteria.
2
Problem Discussion
In this section, we aim to give a quick overview about the main complications of the overall problem, as we experienced them in practice. In sections 3 and 4, we return to these drawbacks and try to give hints on how to overcome them. One problem aspect is that the question we want to answer is not one-dimensional. If we want to buy external data, we need to make three relevant decisions, which largely influence each other. We have to choose among the different kinds of data (lifestyle, census, etc.), between the diverse providers of these data and, finally, we are required to pick the attributes within the data sources. In order to do so, we must first describe the primary objective of the project from a business perspective [5]. Often we face many competing objectives and constraints that are important for the decision. If we intend long term usage of the data (e.g. creation of permanent fields in the customer database), the situation gets even more complicated. Here we do not exactly know what future business problems we will face. But if we want to give the right answers in the future, we have to collect the necessary data today. After defining the business problem, it has to be transferred to a data mining goal. A data mining goal states the business objective in technical terms [5]. The data mining goal corresponds with the data mining algorithms we plan to use. And, these strongly depend on the data input [4]. As we do not know in advance whether the data mining results will solve the business problem, we might have to change the data mining goals and algorithms. This may cause that the chosen data to not fit anymore [8]. Talking about unfitting data, we are confronted with another problem. If we want to measure data quality, we need to find proper measures [11]. For example in [10] Data Quality Mining (DQM) is introduced as a new approach to address data quality issues by means of data mining methods. The overall intention hereby is to gather the information without mistakes or errors, to derive manageable scales for information measurement and to aggregate it for the final assessment. We will address these points in more detail in section 4. Besides the aspects mentioned above, typically the decision is made under pressure of time and resources (mainly human resources, money and hardware). Unfortunately, we are seldomly able to reduce the caused results by means of experience, because we cannot build on prior
45
Proceedings of the Sixth International Conference on Information Quality
knowledge, due to employees leaving the company and insufficient documentation. These effects are strengthened when there is just one person in charge. Additionally, here we cause high subjectivity of the decision.
3
The overall process model
As mentioned before, we now describe the overall process model, developed and tested by DaimlerChrysler. First, we consider the adaptation level of the model to the respective project. Second, we explain the connection between the single steps and why they are created at all and ordered in a particular way. We will have a closer look at the steps in section 4. When the idea for standardizing the data selection process was born, we aimed to create a detailed user guide. After a short time it became clear that such an approach is not possible. We realized that each project, even within the field of data mining for marketing, is much too specialized and too complex for this approach. Consequently, we changed the goal. Now we aim to provide a generic framework, which has to be adapted for each selection. The more detailed and the more accurate the adaptation is executed, the more time and budget is needed. The energy spent for that should match the relative importance of the project. There is a wide range of possible solutions. E.g. for the evaluation of our approach we had two people working 40% of their time over a period of six months. Additionally, we had a team of experts standing by. But when we helped to choose a data provider for a large but single acquisition campaign in the UK, we needed only three full work days for preparation and one workshop with five people in order to complete the task (over a period of two weeks). Now the question is how to determine the relative importance of the project and the corresponding effort. Again, the attempt to be very exact would be a waste of time, because there are too many influences. For that reason, we cannot give exact instructions. But we like to point out two major aspects. In practice, we found that one of the main aspects to consider is for how long we intend to use the data or the resulting information. The longer the usage is planned, the more expensive is the project and the more the future business will be influenced. Naturally, we would put more time and resources into the selection as the expected impact increases. Another important aspect is the strategic relevance of the business goal. Even if we use the data temporarily, the results may have long term effects if they are used for strategic decisions. That is why we prefer a more intensive selection of data in this case. In case of short-term operational goals, we would keep the selection process much simpler. In section 4, we will mention what precise choices we have to adapt the process and what the impacts of these choices are. For now, we want to look at the process model. For the most part, the model can be used independently of the fact that it was developed for the selection of data for direct marketing. We will outline the point where this comes into account later on.
46
Proceedings of the Sixth International Conference on Information Quality
The selection of (external) data sources is part of the overall data mining process. That is why we see our process model as one block of activities within the data mining project plan. For the execution of data mining projects we refer to the CRISP-DM process model, which is an open industry standard [6]. Fig. 1 illustrates our model for the selection process of external data sources.
preparation project plan
location of potential data providers
definition of relevant criteria incl. KO-criteria
coarse selection exclusion based on KO-criteria
close up examination enterprise
examination of: data service
summary and selection description of solution and project
Fig. 1. Overall process model for data selection
Each selection starts with preparation. The most important outcome is the initial project plan for the data selection, which corresponds closely to the project plan of the respective data mining project [5, 6]. The plan is necessary because we need both an internal status quo (e.g., the timelines for the project) and basic knowledge of the possible external data providers (e.g., addresses and phone numbers), before we can contact the latter. At the beginning, we consider all possible alternatives of potential data sources. Hence the funnel in Fig. 1 has its widest diameter. The next step is to contact all possible data providers. The aim is, first to gather information and, then if possible, to reduce the number of providers based on KO-criteria defined prior in the project plan. This is very important for saving time and money. This way we can exclude candidates, we would have excluded later anyway. We call the third step close-up examination. Independent of the process adaptation, this is the most time- and resources -consuming phase. Here we evaluate the data as well as the data providers. To do so, we need an intensive dialog and data transfer with the vendors. We developed an evaluation approach based on three dimensions. The outcome of this step is an evaluation portfolio, illustrating the position of all data providers (except the ones excluded in step two), as we will explain later on.
47
Proceedings of the Sixth International Conference on Information Quality
During the last step, we make the decision and produce the final report. The report is mainly a summary of the selection process and its experiences. It helps to understand the decision process in future projects and to store the knowledge gained. So we overcame one of the complications mentioned in section 2.
4
Detailed Model Description
4.1 Preparation The first task in preparation is the determination of the business and data mining goals. We can obtain the primary objectives from the data mining project plan and transfer them into sub-goals for our data selection. We recommend defining just one (or two corresponding) primary goal(s) and to submit all other goals strictly. This will help to avoid target conflicts as mentioned in section 2. If there are more key objectives we would handle them within separate projects. Note that this decision influences the expenditure we should spend for the whole selection (see section 3). Now we have to execute a situation assessment. Therefore, we list all resources available to the project (e.g. personal, software, hardware, data). Again, we can use lots of information from the data mining project plan and add our specifics. After defining the goal(s) and having assessed the situation, we derive and weight the selection criteria. We need these requirements in order to contact the potential providers properly, as we will explain in section 4.2. A general system of evaluation criteria is described in section 4.3, where the actual evaluation takes place. To derive and weight the criteria, we built a team of people from all relevant departments (e.g. Marketing, IT, Controlling, Management, etc.) and organize a workshop. Here we use common techniques like work groups, brainstorming, brown paper method or sensitivity analysis. Within the criteria found, we must name KO-criteria. If one KO-criterion is positive for a specific data source (provider), the source (provider) will be excluded for good early in the selection process. Because of that, we must be very careful when picking the right KO-criteria. We also should take into account that we can apply the criteria easily. This is necessary because we want to sort out adequate data sources with low expenditure (see section 3). In practice we experienced that KO-criteria are found straightforwardly by means of brainstorming. One example of a good criterion we found that way is the image of the data provider. For DaimlerChryslers premium brand Mercedes Benz it is very important not to work with data providers who have a bad reputation in public. Especially, if we work with data of private persons for marketing purposes. The criteria are relatively easy to apply as well (e.g. we can search press articles for the providers name). Another task to fulfill during preparation is to locate potential data providers (gathering of information like names, phone numbers, addresses etc.). For that we can use public information sources like the world wide web, yellow pages or business address providers.
48
Proceedings of the Sixth International Conference on Information Quality
From all the tasks described before, we develop the initial project plan for the data selection. It represents the intended plan for achieving the defined goals and lists the precise activities to be executed, together with duration, resources required, inputs, outputs as well as dependencies. All these tasks must be completed for every selection process. This means that there is no way to adapt the process here. The only difference is that we have varying intensity depending on the nature of the business goals and the intended time of data usage (see section 3).
4.2 Coarse Selection After preparation we start to contact the providers of potential data sources according to the project plan. We can accomplish this task through oral or written interviews. In any case, we suggest using an uniformed questionnaire. So it is less complicated to compare the results. The questionnaires should include basic information like date, contact, phone, etc., all KO-criteria as well as a first look at the most important criteria. Most important are these criteria which were highly weighted during preparation. The early evaluation of these criteria is essential for three reasons. First, if we do not have the time or resources to check all criteria derived, we are able to find the most promising ones (e.g. in terms of the degree of assessment, measurement, reliability, etc.) near the beginning. Second, if we gather the information during coarse selection, we can cross-examine it during close-up examination and, hence, increase reliability. Third, we are capable of using the gathered information for a first ranking of the data sources before entering close-up examination. The latter can help to speed up the whole process or save costs later on. The next step after making the first contact is the exclusion of data sources or providers based on KO-criteria. As mentioned before, we sort out a source or provider if one or several KOcriteria are positive (see section 4.1). But often, we can obtain only uncertain information. That is why we advise rechecking the results if we are about to exclude a presumed high potential source (provider). A source or provider is considered high potential, e.g., if there is a wide range of information offered, if it is a major company (e.g. in terms of market share, market experience, service offerings, etc.) or if we have good experiences from the past. We are not able to provide a certain and complete list of criteria, because again the criteria and the accesses to the corresponding information vary among different projects. Yet, to outline the importance of the recheck we want to give a short example from one of our projects. When we did the coarse selection for a long-term strategic marketing project, we were about to exclude one data provider (and therefore several data sources), because there was no service hotline offered. The whole coarse selection step lasted several weeks (because of internal difficulties by DaimlerChrysler). When we rechecked the criterion it came to our attention that a new service hotline was about to be established for free. The person who had given the information the first time did not know about this fact. Later in the process this provider was chosen exclusively. The outcome of this process step is a list containing all data providers to be evaluated in closeup examination. The list includes a first ranking and goes along with basic information about the most important criteria in best case.
49
Proceedings of the Sixth International Conference on Information Quality
In contrast to the first step, we have a variety of possibilities for process adaptation here. We can choose, at least for the type of interviews, the inclusion of most important criteria and the addition of the recheck task. Of course, there are several levels of intensity possible again.
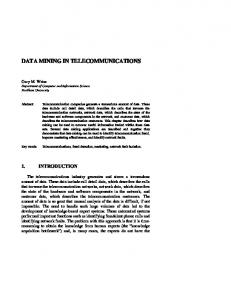
4.3 Close-Up Examination Entering the phase close-up examination we reach the core of our process model. In this section, we start with talking about the general tasks to fulfill, explaining the dimensions of the evaluation and discussing the problems of criteria measurement. Then, in sub-sections 4.3.1 through 4.3.3 we describe a framework for the arrangement of the criteria within the evaluation dimensions. The aim of the close-up examination is to evaluate and compare each data source (provider) with all others. Therefore, we go back to the providers and have a closer look than we had in step two. But of course, we use the information obtained before as a starting point and for reference. What tasks we have to complete in detail will be mentioned in the appropriate sub-sections. For the examination we suggest a three dimensional evaluation space. Since we talk about information quality and buying external data, naturally, the most important dimension is the data dimension. But in a business environment we have to consider other aspects as well. As our example in section 4.1 shows, there can be significant criteria concerning the enterprise which is offering the data. We found several such criteria and for that reason, we grouped them to yield our second dimension, the enterprise dimension. The last dimension we suggest is the service dimension. Here we combine all criteria regarding the service level of the data provider. The evaluation dimensions as well as the corresponding criteria are arranged after our needs and experiences. Because of that, the arrangement may be expanded, reduced or reorganized according to specific project demands and represents a general suggestion only. Here is much room for process adaptation. In practice we found that most criteria can be sorted into the framework and that it is therefore a helpful tool for organizing the evaluation. The three dimensional evaluation space can be illustrated through the portfolio technique [12]. Fig. 2 shows an example.
50
Service Dimension
Proceedings of the Sixth International Conference on Information Quality
1.0
4. Source C
1. Source A1 5. Source A2
0.75
0.5
0.25
6. Source E
2. Source B
5. Source D
3. Source H
7. Source G 1.
0
0.25
0.5
0.75
Data Dimension
1.0 Enterprise Dimension
Fig. 2. Final evaluation portfolio
The service and the enterprise dimensions are represented by the two axes. The data dimension is shown through the size of the circles and the corresponding numbers. This final evaluation portfolio is the outcome of the close-up examination. It illustrates the relative position of all data sources. If a certain provider offers more than one data source and if we want to view them separately, the circles will have the same center but probably different diameters (see Fig. 2). If there are two or more sources close together and we are uncertain which one to prefer, we advise making another recheck, at least concerning the data sources in question. During the recheck we can verify the former results, use new measures for the information gathered before or collect additional information. The recheck is necessary because there are several inaccuracies and uncertainties in the measuring and the combination of the criteria. Before going into the sub-sections we want to talk about these difficulties in general. The first challenge is to ask the right questions during the data (information) collection. That means we have to closely and correctly specify the wanted information in advance. Only this way we can be certain that we obtain the intended information and that it is comparable later. We want to explain the fact with an example from practice. If we ask a data provider for the turnover, he can state the turnover for the whole company. In the case of a diversified company like Bertelsmann (or GE) this would be a huge amount. But is this really the information we want to obtain and can we compare this number with the turnover of a much smaller data provider? The answer to both questions is no. Instead we should have asked for the turnover of the specific subdivision in question. The second challenge is to measure and aggregate real world information without distorting it too much. The data containing the information can be qualitative and quantitative in their nature
51
Proceedings of the Sixth International Conference on Information Quality
and thus, demand different types of measurements. Yet, they all have one feature in common: they are all made on some kind of scale. In detail, we distinguish the following main kinds of scales [11]: • • • • •
Nominal scale, Categorical scale, Ordinal scale, Interval scale, Ratio scale.
The list of scales above is ordered after the information content (amount of information) they carry and could be divided even further [13]. With the aim of producing an aggregated view at the data sources, we have to transfer information from one scale to another as well as to aggregate it. In order to make this task as simple as possible, we advise thinking about the scale for each criteria carefully before starting the data (information) collection. Again, there is no general approach for data collection or transformation. We have to find practical solutions in each case. We would like to give an example for scale transformation and aggregation of information. Fig. 3 shows a table containing two criteria measured with different scales: number of available addresses and overall completeness of records. Four potential data sources (A, B, C, D) are evaluated. In the example, both criteria are weighted equal (with 0.5). First, we transfer the scales (transformation rows; the biggest number corresponds with the highest rank) and then we calculate the aggregated value (as shown in the last row). The aggregated value is generated through the calculation of the relative value for each criterion and the summarization of all relative values (e.g. the calculation for Source A is: 1:3 * 0.5 + 1:4 * 0.5 = 0.29).
Name of Criterion Weight Source A 300,000 Number of addresses 0.5
Source B 304,000
Source C 600,000
Source D 1,220,000
Transformation 1 (ordinal scale) Transformation 2 (rank) Completeness of records Transformation 1 (rank) Aggregated Value
< 500,000
< 500,000
< 1,000,000
< 1,500,000
1
1
2
3
87%
90%
95%
99%
1
2
3
4
0.29
0.41
0.7
1.0
0.5
Fig. 3. Example for scale transformation and aggregation
This example shows that the transformation process is highly subjective and error-prone. In this case, e.g. we decided that the difference concerning the number of addresses in sources A and B
52
Proceedings of the Sixth International Conference on Information Quality
is not large and that we treat them as equal. But one may find reasons not to do so. It gets even more complicated if we have to aggregate qualitative and quantitative attributes. The transformation into ranks might be a working solution for this problem as well.
4.3.1 The Enterprise Dimension This dimension aims to evaluate general enterprise criteria of potential providers. As we will show, these criteria mainly refer to the characteristics of the data provider. Fig. 4 gives an example for possible evaluation criteria and how they can be arranged.
Fig. 4. Examples for criteria in enterprise dimension The cluster company facts summarizes information about the providers business. Here we consider criteria like business partners, turnover or number of employees. These help to estimate the available personnel and financial resources having an impact on the possibilities of collaboration. Furthermore, they give valuable hints if the provider has substantial power to develop innovative approaches or to react to our future demands (see section 2). Within the second group, experiences, we look at all possible reputations the data provider can have. We look from two broad perspectives: the image and the real experiences. If the image is bad we can face serious complications within our own company (e.g. acceptance problems) and outside (see section 4.1). The most reliable information within this cluster is the internal recommendation. Especially if there has been no collaboration in the past, we must ask for external references as a second criterion. Market experiences is the number of years, for which the provider has offered this kind of information sources. Typically, market and external experience are correlated highly. Nevertheless, we can get hints on how much internal knowledge about the relevant topics the data provider has already collected. International competence is especially important if we intend to use the data for direct marketing projects in various countries. But also if this is not actually planned, good international
53
Proceedings of the Sixth International Conference on Information Quality
competence could influence the providers ability to resolve domestic problems through the knowledge built elsewhere. In addition, we might do future business abroad and therefore check the possibilities. Although the collaboration with an international data provider seems promising at first, in practice we learned otherwise. Typically, there are remarkable differences concerning legal issues between the varying countries. Another problem is that even the same provider offers completely dissimilar data within different borders. This is, e.g., due to the data sources he can legally access, the various ways the basic data was collected or the differences in his own company development. For these reasons we cannot transfer marketing or data mining concepts easily. We experienced that differing data sources from different providers normally present the most appropriate solution for cross border projects. The offering portfolio of the provider is closely related to the business goals of our project and must be compared with the internal requirements. The examples of sub-criteria, as shown in the figure above, are linked to our direct marketing projects. Which ones are picked and how they are measured depends on the project’s specifics. Here we have a high need for adaptation. Now we leave the core enterprise criteria and take a broader view (dotted line). Pricing is often meant to be a very important criterion. But we learned that the price is only considered if two or more providers are very similar within other criteria. When including this criterion, not only the costs for data, but all process costs should be taken into account. These are, e.g., costs for preparing the data and in marketing for adding personnel addresses to the keys (often done by the provider). Another criterion we suggest asking for is the USP of a provider. Most providers offer one or more services or data sources exclusively. We check how they fit into our project and gather know how that might be used in future projects or give hints for new marketing possibilities and approaches. In case of short operational projects, offerings and prices must be checked especially. If a longterm partnership is planned, company facts as well as experiences and international competence play a bigger role. In case an enterprise just started to offer these products, it is uncertain whether it will still exist in two or three years. Then data from providers with a higher market experience are preferable. We can say that enterprise related criteria (compared to the other dimensions) are usually quickly to obtain but difficult to measure. They also act as KO-criteria very often and are used during coarse selection (see 4.2). Most of the information can be gathered through interviews with the provider (we recommend inviting them for presentations). Other valuable sources are companies called as references and public sources like journals, corporate reports and so on.
54
Proceedings of the Sixth International Conference on Information Quality
4.3.2 The Service Dimension The service dimension reflects the quality of the collaboration with the data provider independent of its products and its company characteristics. We focus on the service level. The role of service for a successful relationship is often neglected. When the data are not delivered in time and in the quality agreed upon, this leads to additional costs, delays, and incorrect results. Fig. 5 illustrates criteria that may be used for catching the service ability of the data providers.
Fig. 5. Examples for criteria in service dimension
The cluster contacting contains criteria that are directly related to personal contacts with the provider. We suggest measuring the accessibility, flexibility and competence of the contact people. So we obtain good indicators on how the provider can react to special needs and time restrictions or if he understands our problem and really wants to resolve it. Sometimes providers just want to sell standardized products that are hardly possible for direct marketing applications. For a good evaluation we advice using uniform questionnaires with multiple choice questions (interval scales), which should be filled out by as many people as possible. Another good idea to measure the service level of a potential provider is to invite him for a presentation. If we specify our expectations to him in advance, we can gather valuable information. Because even if the expected content has been clarified previously, the quality of the presentations often varies considerably. This group of criteria is strongly related to the contacting cluster but creates additional insights. Again we recommend using questionnaires and a team of interviewers. We assume compliance of agreements to be a separate category because of its importance for achieving the project goals. Especially when test data are examined timeliness and content of the delivery can be tested. If no test data are used, this criterion cannot be gathered according to its importance. The last category (criterion) we suggest gathering is the overall impression of the provider. Similar to customer satisfaction inquiries we can use this as separate overall criterion.
55
Proceedings of the Sixth International Conference on Information Quality
During our projects at DaimlerChrysler we learned that the service dimension is very important to practitioners and therefore gets high weights always. When we gather the information we have two main sources: information that we obtain directly from contacting the providers during the project and information we can collect from prior work (if there were any). For the first source we should make sure that the contacts (presentations) are within a short timeframe and that we have only one team of interviewers.
4.3.3 The Data Dimension Since we are up to the selection of external data sources, the data dimension is the core of our evaluation system and for that reason most important. As mentioned before, it is also most difficult, complex, and time consuming. Here, we also talk about the dimension that is most closely related to the business issue itself. For the measurement of this dimension we need to work with test data. We distinguish between specified and non specified test data. If we use specified data (in direct marketing), we send a sample of our own addresses to the providers and ask them to enrich the file with their data (attributes). If using unspecified test data, we just ask for a sample from the providers database(s). Of course, the latter method is less valuable. Fig. 6 shows that there are two main categories for evaluating the data dimension. The first category – data - deals with the product itself. The second category summarizes the quality of the documentation. Both are decomposed on the first level in substance and format, each consisting of various criteria.
Fig. 6. Examples for criteria in data dimension
56
Proceedings of the Sixth International Conference on Information Quality
We first want to discuss the documentation criteria. In our projects we realized that an incomplete documentation may make good data worthless because their potential cannot be identified and exploited. Moreover, lacking documentation necessitates more communication with the provider and faults become more probable. Generally, we distinguish documentation substance and formal fit. Within the substance we have to check if all demanded information is delivered and exists in an appropriate quality. Within formal fit, we suggest investigating structure, format, and understandability. Most documentation criteria are qualitative in their nature. But scales can be applied which enable us to capture whether the respective criterion is completely, mostly, partly or not fulfilled. This evaluation has to be done by the people working with the data. In practice we learned that there really is a huge difference in documentation quality. The differences can occur concerning all criteria listed above. We had to face things like wrong language, wrong descriptions or inaccessible documentation at all. These difficulties ended mostly in extended data understanding and preparation phases [2]. Now we want to look at the second category, data quality. Fig. 7 shows the sub-categories and related criteria in detail.
Fig. 7. Examples for data criteria
Completeness, accuracy, and timeliness are common criteria for data substance [10]. They can only be measured through analyzing the test data. Fig. 7 shows that completeness can be related e.g. to attributes, records and population. In the marketing context the latter means how the data source covers the target market (in percent of the overall population) [1]. Accuracy can be related to different referring points as well (e.g. to reality, to definition, etc.) [7]. Accuracy between fields measures how the data corresponds within the same record. We distinguish between hard and soft correspondence. Hard correspondence means a fixed
57
Proceedings of the Sixth International Conference on Information Quality
relationship (e.g. between zip code and area code). A soft relationship refers to information that is possible, but most likely to be untrue (e.g. age: 18, monthly income: 120,000 USD). Timeliness is viewed from diverse perspectives as well [15]. We can measure when the delivered data has been collected the last time (backward measurement) and when the data will be updated the next time (forward measurement). We can also look at the turn in which it is usually collected. Note that there is not just one timeliness within a data source. Some fields (attributes) might be updated differently within the same source or there might be a time lag between distributed data sources (measured e.g. through concurrency) [7]. Completeness, accuracy and actuality can be collected directly. Completeness is available as proportion of 100%. Accuracy is more difficult to gather. One possibility consists in defining levels of accuracy from very accurate to hardly accurate. Typically, actuality is measured on a ratio scale. In case of the usual update turns we use an interval scale. For aggregating, all criteria scale transformations might be necessary. Before explaining the next criterion we would like to take the opportunity to talk about the usefulness of specified test data in order to measure the data oriented criteria mentioned above. First of all, we can improve the reliability of all criteria, since we have control over the records to be enriched (the provider cannot just send his “best” data). Second we can check correctness and actuality for addresses where the true value is known. And last but not least, we can check how the provider handles dirty data. E.g. for direct marketing purposes it is highly interesting to see how the provider works with incorrect addresses. Significance for business relevance is the most important criterion within data substance and even within the data dimension. Actual and accurate data are useless if they don’t contain information meeting the business goals. Unfortunately, this criterion is very difficult to obtain. On the one hand, this is due to the fact that not all details of the project are known in advance (see section 2). On the other hand, the internal data situation and the project goals can change in a way that influences the business relevance of the data. The third problem is that even if we know the business and data mining goals in advance, we often do lack a proper evaluation system [8]. In practice, we tried to simulate the real situation. E.g., we generated test models (using the real target variable) for predicting potential customers. But this procedure was very time consuming. Because of the variety of available data, it did not show satisfying results by now. When dealing with many and large data sources, we face the problem of attribute selection as mentioned in section 2. Data format is the second sub-category to examine within the data dimension and its importance is underestimated frequently. First, we check if the format type of the data files corresponds to our specified demands. This will help to process the data later. The second criterion – the number of data files or tables – must be specified for each project individually. Usually, we like the provider to process the data as far as possible. Because, the more tables or files are delivered, the more work we must undertake to join them. Sometimes,
58
Proceedings of the Sixth International Conference on Information Quality
the different files even correspond to different aggregation levels, and matching the files is very laborious. But there may be reasons to prefer in-house processing. The reasonable file size as third criterion is important for handling the data. The bigger the file, the slower is the data processing and the more resources are necessary. Examples for common mistakes concerning the file size are doubled information, wrong data type specifications or fields containing useless data (e.g. keys from former matching).
4.4 Summary and Decision The first step of this phase is to make the final decision about the data sources (providers). For that we use the outcome of the prior phase, the final evaluation portfolio. As we have seen in 4.3, the portfolio seldom shows an absolutely clear favorite. More often we have the choice between several alternatives. Therefore, it becomes clear, that often after close-up examination we do not have a final solution but we reduce the possibilities. In case of very close positioned data sources (even after the recheck in close-up examination), we can attempt to weight the relative importance of the evaluation dimensions. Another possibility is to combine the data sources or to use them successively. For making the final decision we recommend organizing a last workshop with all (ore most) persons which have been involved. This way we can overcome the subjectivity mentioned in section 2. The project ends with the production of the final report where all the threads are brought together. For that, we carefully review the project. Besides the results obtained, the report should also describe the process, define the deviations from the original plan and note the assumptions and uncertainties. Consequently, it is a summary of all experiences, but should also make recommendations for future work. Within our department at DaimlerChrysler we gathered a collection of 5 such reports. They are all structured similarly (since we improve the structure continuously). We use this document to collect different experiences and to spread them widely within the company. We also see promising developments in cost and time efficiency.
5
Conclusion
5.1 Summary We presented a practical approach for the selection of external data sources. It was not possible to generate a detailed process model but to provide a framework with manageable tools. However, the approach needs correct adaptation for each project. Hence, the amount of time and resources we have to put in for the selection varies extremely. Clearly we can not overcome all problems mentioned in section 2 but we have shown feasible solutions and ways to alleviate the effects. E.g. we cannot generate objective decisions but replace subjectivity by “inter subjectivity”.
59
Proceedings of the Sixth International Conference on Information Quality
Moreover, we showed that we also have to look at enterprise and service criteria not at data quality alone. Additionally, we learned that there is no real data (information) quality without proper documentation. If we cannot understand and access the data rightly there is little information to gain. Finally, we state that in most cases there is no one and only final solution. Because of the problems pertaining to collecting, measuring and comparing the selection criteria we just reduce the possibilities. But from experience we know that the outcome is normally worth the effort.
5.2 Further Research/ Open Issues As we tried to illustrate in this paper, it is hard to standardize the selection process. The suggestions made by us help to make the process repeatable and give hints on how to overcome handling issues. Further development could broaden the framework for organizing the selection criteria, and advance the process model or the standardization of tools like, e.g., questionnaires, check lists or rating scales. For selection processes which last over a long time (e.g. 10 months) we must consider how we handle the issue that the information obtained about data sources and providers can change dramatically during this time. From our point of view, the area of information processing leaves the most room for improvement. We need more advanced approaches properly integrating all steps (collection, measurement, aggregation and comparison of data (information)) in order to aggregate the information to a high level without loosing too much detail.
6
References
1. Arndt, D.; Gersten, W.: Data Management in Analytical Customer Relationship Management. In: Workshop Data Mining for Marketing Applications, In: Proceedings of the ECML/PKDD 2001. Springer, Heidelberg (2001) (to appear) 2. Arndt, D., Gersten, W., Wirth, R.: Kundenprofile zur Prognose der Markenaffinität im Automobilsektor. In: Hippner, H., Küsters, U., Meyer, M., Wilde, K. (eds.): Handbuch Data Mining im Marketing. Vieweg, Braunschweig Wiesbaden (2001) 591-606 3. Berry, M.J.A., Linoff, G.S.: Mastering Data Mining. Wiley, New York (2000) 4. Berthold, M.; Hand, D.J.: Intelligent Data Analysis. Springer, Heidelberg (1999) 5. Chapman, P. et al.: CRISP-DM 1.0. SPSS Inc., München (2000) 6. CRISP-DM: Cross-Industry Standard Process Modell for Data Mining. In: http://www.crispdm.org/home.html (2001) 7. English, L.P.: Improving Data Warehouse and Business Information Quality. Wiley, New York (1999)
60
Proceedings of the Sixth International Conference on Information Quality
8. Gersten, W., Wirth, R., Arndt, D.: Predictive Modeling in Automotive Direct Marketing: Tools, Experiences and Open Issues. In: Proceedings of the 6th International Conference on Knowledge Discovery and Data Mining. ACM, New York (2000) 398-406 9. Heinrich, L.P.: Informationsmanagement: Planung, Überwachung und Steuerung der Informationsinfrastruktur. München, Wien (1999) 10. Hipp, J., Günzer, U., Grimmer, U.: Data Quality Mining – Making a Virtue of Necessity. In: Workshop on Research Issues in Data Mining and Knowledge Discovery (DMKD 2001), In: Proceedings of the 6th ACM SIGMOD. Santa Babara, CA (2001) 52-57 11. Pyle, D.: Data preparation for data mining. Morgan Kaufmann Publishers, San Francisco (1999) 12. Schul, F.: Neue Konzepte des strategischen Portfolio-Managements im diversifizierten Unternehmen. Stuttgart (1981) 13. Schwarze, J.: Grundlagen der Statistik I. Verlag Neue Wirtschafts-Briefe, Berlin (1998) 14. Shepard, D. et al.: New direct marketing. McGraw-Hill, New York (1991) 15. Strong, D., Lee, Y., Wang, R.: Data Quality in Context, Communications of the ACM, Vol. 40 (5), 1997
61