Abstract. Open source software systems are becoming increas- ... Many large companies are invest- ... a description of the form of the data in terms of a set of en-.
Extracting Facts from Open Source Software Rudolf Ferenc, Istv´an Siket and Tibor Gyim´othy University of Szeged, Department of Software Engineering {ferenc|siket|gyimi}@inf.u-szeged.hu
Abstract Open source software systems are becoming increasingly important these days. Many companies are investing in open source projects and lots of them are also using such software in their own work. But because open source software is often developed without proper management the quality and reliability of the code may be uncertain. The quality of the code needs to be measured and this can be done only with the help of proper tools. In this paper we will describe a framework called Columbus with which we calculate the object oriented metrics validated by Basili et al. for illustrating how fault-proneness detection from the open source web and e-mail suite called Mozilla can be done. We will also compare the metrics of several versions of Mozilla to see how the predicted fault-proneness of the software system changed during its development. The Columbus framework has been further developed recently with a compiler wrapping technology that now gives us the possibility of automatically analyzing and extracting information from software systems without modifying any of the source code or makefiles. We will also introduce our fact extraction process here to show what logic drives the various tools of the Columbus framework and what steps need to be taken to obtain the desired facts.
Keywords Fact extraction, metrics, reverse engineering, open source, fault-proneness detection, Mozilla, compiler wrapping, schema, C, C++, Columbus, CAN, CANPP
1. Introduction Open source software systems are becoming evermore important these days. Many large companies are investing in open source projects and many of them are also using such software in their own work. As a consequence, many of these projects are being developed rapidly and are quickly becoming very large. But because open source software is usually developed outside companies – mostly by
volunteers – the quality and reliability of the code may be uncertain. Thus its use may involve big risks for a company that uses open source code. It is vital to get more information out of these systems. Various kinds of code measurements can be quite helpful in obtaining information about the quality and fault-proneness of the code. These measurements can be done with the help of proper tools. In this paper we describe a framework called Columbus [8] with which we are able to calculate the object oriented metrics validated in [1], [2], [3] and [4] for fault-proneness detection (similar results were presented also in [10] and [16]) from the source code of the well-known open source web and e-mail suite called Mozilla [13, 14]. We then compare our results with those presented in [1]. One of our aims was to supplement their work with metrics obtained from a real-size software system. We also compare the metrics of the seven most recent versions of Mozilla (1.0–1.6), which covers over one and a half years of development, to see how the predicted fault-proneness of the software system changed during its development. The Columbus framework has been further improved recently with a compiler wrapping technology that allows us to automatically analyze and extract information from practically any software system that compiles with GCC on the GNU/Linux platform (the idea is applicable as well to other compilers and operating systems). What is more, we can do this without modifying any of the source code or makefiles. We describe this technique in detail later in this paper. We also introduce our fact extraction process to show what logic drives the various tools of the Columbus framework and what steps need to be taken to obtain the desired facts. By fact we mean any information that describes different properties of the system being studied. One fact might be, for instance, the size of the code. Another fact might be whether a class has base classes. Actually any information that helps us better understand unknown source code is called a fact here. It is obvious that collecting facts by hand is only feasible when relatively small source codes are investigated. Real-world systems that contain several million lines of source code (Mozilla, for instance) can only be processed with the help of tools. In the Columbus framework the form of the extracted
facts conform to predefined schemas. By schema, we mean a description of the form of the data in terms of a set of entities with attributes and relationships. A schema instance is an embodiment of the schema which models a concrete software system (or part of it). This concept is analogous to databases, which also have a schema (described usually by E-R diagrams) that is distinct from the concrete instance data (data records). The Columbus framework defines two schemas: (1) the Columbus Schema for C/C++ Preprocessing [15] (for describing preprocessing related facts) and (2) the Columbus Schema for C++ [7] (for describing the C++ language itself). It should be mentioned here that we performed full analyses of the seven versions of Mozilla and built up the full schema instances of them, which can be used for any reand reverse engineering task like architecture recovery and visualization. In this work we used them only for calculating metrics, but their use is not limited to this case. We proceed as follows. In the next section we describe our fact extraction process and the used analyzer tools. We also explain in detail our new compiler wrapping technique. In Section 3 we compare our results to those published in [1] and also study the changes of the metrics over different releases of the well-known Mozilla internet suite. Afterwards, in Section 4, we describe some works similar to ours. Finally, in Section 5, we conclude the paper and outline directions for future work.
2. Fact Extraction Fact extraction is a process which defines different steps that describe the way information about the source code can be obtained. These steps include the acquisition of project/configuration information, the analysis of the source files with analyzer tools, the creation of some kind of representations of the extracted information, the merging of these representations and different processings performed on this merged representation to put the collected information into a useable form. The most difficult steps in the process are the acquisition of project/configuration information and the proper analysis of the source files. In this section we will describe a process by which these tasks can be done. But first we will describe the tools we developed to support the process.
2.1. The Columbus Framework Columbus [8] is a reverse engineering framework that has been developed in cooperation between the University of Szeged, the Nokia Research Center and FrontEndART [11]. The main motivation behind developing the Columbus framework was to create a toolset which supports fact
extraction and provides a common interface for other reverse engineering tasks as well. The main tool is called Columbus REE (Reverse Engineering Environment), which is the graphical user interface shell of the framework. All C++ specific tasks are performed by different plug-in modules of the REE. Some of these plug-in modules are present as basic parts, but the REE can be extended to support other languages and reverse engineering tasks as well. The framework contains several command line tools, which actually do the C++specific tasks like analyzing the source code and further processing the results. In the following we briefly present what they are and do. CANPP (C/C++ ANalyzer-PreProcessor) is a command line program for analyzing C/C++ preprocessing related language constructs and for preprocessing the code. The input is a C/C++ source file with various settings (like include paths and macro definitions), and the outputs are the preprocessed file and the built-up instance of the Columbus Schema for C++ Preprocessing [15] of the source file. CAN (C++ ANalyzer) is a command line program for analyzing C++ code. The input of CAN is one complete compilation unit (a preprocessed source file) and the output is the built-up instance of the Columbus Schema for C++ [7] of the analyzed unit. Besides ANSI C++, CAN supports the Microsoft dialect used in Visual C++, the Borland dialect used in C++Builder and the GCC dialect used in g++. CANLink (CAN Linker) is a C++ schema instance linker tool. Similar to compiler linkers, it merges the instances of the Columbus schemas into larger instances. This way, C++ entities that logically belong together (e.g. libraries and executables) are grouped into one instance. These merged instances have the same format as the original instances, so they can of course be further merged into one single schema instance to represent the software system as a whole. CANFilter (CAN Filter) is a GUI program that makes the filtering of the (linked) schema instances possible through a visual interface. The filtered instances have the same format as the original instances. CAN2*. With the help of these command line tools the (filtered) schema instances built from the extracted facts can be further processed. Some of these procedures apply transformations on the instances to convert them to other formats in order to promote tool interoperability, while others do different computations on the instances, such as calculating metrics, recognizing design patterns and code auditing. CANGccWrapper toolset. The GCC compiler-wrapper toolset supports our new compiler wrapping technique, as described in Section 2.3.
� � ���/.
� � ���"!
��� �����
�� � � � �� � �� 3 � � 2 � �* 0� � 1
* � 2 � � ( � * �* � ' ( � * � � * 0 � � ' ( � � �� � � � �� �
�������
���
� �
�
���
���
� �
��� ����%
� � �
� �*0� � 1
* � 2 � � ( � * �* � ' ( � * � � �
��� ���$#
���
� � �
��� + �� � ')�
� � � ')� ���
� �
� �
��� ��� + , � � � �
� � � � � &�' ( � � ( � �
� �� � � � � � & � ')( � � ( � �
� � � ������ �
� �
����� � � � �
� � -
���
�
� � � � * � ( ( �4 � �
� &� ' ( � � ( � �
� �* � � � � � � & � ')( � �( � �
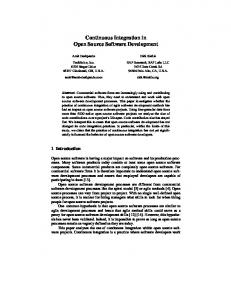
Figure 1. The fact extraction process
2.2. Fact Extraction Process The general outline of the extraction process within the Columbus framework can be seen in Figure 1. The process consists of five consecutive steps where each step uses the results of the previous one. These steps may be performed in two different ways: using the visual user interface of the Columbus REE, or using the command-line programs directly. In this paper we use the CANGccWrapper toolset to perform the extraction process. The steps of the fact extraction process are elaborated on in the following. An important advantage of the steps presented is that they can be performed incrementally, that is, if the results of certain steps are available and the input of the step has not been altered, these results need not be regenerated each time. Step 1: Acquiring project/configuration information Acquiring project/configuration information is indispensable when carrying out the extraction process. The source code of a software system is usually logically split into a number of files and these files are arranged into folders and subfolders. Furthermore, different preprocessing configurations may apply to them. The information on how these files are related to each other and what settings apply to them are usually stored either in makefiles (in the case of building software with the make tool), or in different project files (in the case of using different IDE-s – Integrated Development Environments). In this paper we introduce our new, so-called compiler wrapping technique for using makefile information (see Section 2.3).
Step 2: Analysis of the source code – creation of schema instances Here the input files are processed one at a time using the project information acquired in the first step (for instance macro definitions to be used and paths to different header files to be included). First, the preprocessing and the extraction of preprocessing related information is done with the CANPP tool. Second, the preprocessed file is analyzed using the CAN tool, which extracts C++ language-related information. Both tools create the corresponding schema instances and save them to appropriate files. This step is performed for every single input file. Step 3: Linking of schema instances After all the schema instance files have been created the linking (merging) of the related schema instances is done with the CANLink tool. Then, similar to real compiler linkers that create different files which contain entities that logically belong together (for example libraries and executables), the related entities are grouped accordingly. The outputs of this step are the merged schema instances for each logical unit (subproject) of the analyzed software system. These merged instances can, of course, be further merged into one single schema instance to represent the software system as a whole. Step 4: Filtering the schema instances In the case of really large projects the previous steps can produce large schema instances that contain huge amounts of extracted data. This is hard to present in a useful way to the user (he/she is usually interested only in parts of the whole system at any given time). Different filtering methods in the Columbus REE and in the CANFilter tool can help in solving this problem.
Step 5: Processing the schema instances Because different C++ re- and reverse engineering tools use different schemas for representing their data, the (filtered) schema instances must be further processed. In this case the processing step consists of transforming the schema instance to other formats. The following formats are currently available: four XML formats (CPPML, GXL, UML XMI and Famix XMI), RSF and HTML. It is also possible to do further calculations on the schema instances. The framework contains tools for calculating object oriented metrics, recognizing object oriented design patterns and code auditing.
2.3. Compiler Wrapping As already mentioned in Section 2.2 when discussing the topic “Acquiring project/configuration information,” the source code of a software system is usually logically split into several files and these files are arranged into folders and subfolders. Furthermore, different preprocessing configurations may apply to them. In this section we deal with the case when the information on how these files are related to each other and what settings apply to them are stored in makefiles (used by the make tool). An important issue that we addressed was to not change anything in the subject system (not even the makefiles). The technique described in the following successfully deals with this issue. It was tested with the GCC compiler in the GNU/Linux environment, but the idea is applicable as well to other compilers and operating systems. The make tool and the makefiles represent a powerful pair for configuring and building software systems. Makefiles may contain not only the references to files to be compiled and their settings, but also various commands like those invoking external tools. A typical example is when the source file to be compiled is generated on-the-fly from IDL descriptions by another tool. These powerful possibilities are a headache for reverse engineers because every action in the makefile must somehow be simulated in the reverse engineering tool. This may be extremely hard or even impossible to do in some cases. We approached this problem from the other end and solved it by “wrapping” the compiler. This means that we temporarily hide the original compiler by a wrapper toolset. This toolset consists of several scripts and a program called CANGccWrapper. Among the scripts there is a key one called CANGccWrap, which is responsible for hiding the original compiler by changing the PATH environment variable. Actually, all the user has to do is to run this script. The script inserts the path of the folder in which the other scripts can be found to the beginning of the PATH environment variable. The names of the other scripts correspond to the executable files of the compiler (for instance gcc, ar
and ld). If we want to execute a program, the operating system searches for it in the folders given in the PATH variable in the same order. This means that if the original compiler should be invoked, our wrapper scripts will start instead of it because they appear first in the PATH variable. If we do not want to use the wrapper anymore it can be simply switched off. The other scripts are quite similar to each other, the only difference being that they “hide” different tools of the compiler. The scripts first execute the original compiler tool (for instance g++) with the same parameters and in the same environment so the output remains the same; therefore, we do not notice that not the original compiler was called originally. The scripts also examine whether the original program terminated normally or not and they terminate with the same value. This is very important because complex systems usually run different kinds of tests before compilation, which determine the compiler capabilities and environment settings. They usually do this by trying to compile small programs containing the issues needed to be tested and examine the termination of the compiler. If the scripts do not take into account the results of the compiler and always terminate normally even when the compilation failed, say, the compilation will be misled and this will probably cause problems later on during compilation. After calling the original compiler, the scripts also call the program CANGccWrapper, which in turn calls the corresponding analyzer tool (CANPP, CAN or CANLink). Since the parameters of the CANPP/CAN/CANLink tools are not the same as the compiler’s, they cannot be easily called directly from the scripts like the compiler. Another problem is that we use different tools for different tasks (for instance CANPP can be used only for preprocessing related issues), while gcc can be used for different purposes like preprocessing, compiling and linking depending on with which parameters it is invoked. So we must examine the parameters to choose the tool(s) that must be called (for instance, “gcc -E . . . ” means “do not compile the file just preprocess it”). The CANGccWrapper program deals with such problems. The scripts call CANGccWrapper with the same parameters as the compiler and CANGccWrapper will call the appropriate analyzer tools. CANGccWrapper first examines which tool of the compiler was called because the parameters will be examined based on this. In different cases it focuses on different parameters. We will only describe its workings in the case of gcc because this is the most complex (it can be used for preprocessing, compiling and linking as well). For instance, if gcc is used for both compiling and linking, it first preprocesses the files, compiles them and finally links them together, so CANGccWrapper has to simulate the same steps. Since the parameters can be grouped according to which tool uses them, CANGccWrapper has to group them simi-
larly as well. We examined only the most frequently used parameters for all the three tools but it could easily be extended. CANGccWrapper collects mainly the “define” and “include” parameters for CANPP, the “libraries” for CANLink and several others for CAN. Where necessary, CANGccWrapper modifies the relative paths to full paths to avoid potential ambiguities.
2.4. Fact Extraction Process with Compiler Wrapping In this section we describe how our fact extraction process (see Section 2.2) works in practice when using the CANGccWrapper toolset. As can be seen in Figure 1, it consists of five consecutive steps. Step 1 (Acquiring project/configuration information) is implicitly handled by our wrapper toolset because it is integrated into the usual build process. Step 2 (Analysis of the source code) is done using the CANPP/CAN tools, which are invoked through CANGccWrapper when the source files are compiled (as described previously). One of the issues with which we had to deal in this step was that the outputs of CANPP (the preprocessed file and the corresponding schema instance) are not present in the makefiles of the real build process. The first is needed immediately by CAN, so there is no problem in handing it over, but the schema instances are needed later in Step 3 when they must be linked to each other. In that step only the compiled (object) and linked filenames are available in the parameters and we have to find the files containing the associated schema instances. We solved this problem by using the same filename for the outputs but with different extensions. These files are always stored next to the original output (in the same directory). CANGccWrapper first calls CANPP with the appropriate parameters and the input file. CANPP analyzes and preprocesses it then saves the extracted schema instance to a file with the extension “.psi” and the preprocessed file to a file with the extension “.i”. Afterwards, CANGccWrapper invokes CAN with the appropriate parameters and input/output files. CAN uses the preprocessed file created by CANPP, analyzes it then saves the extracted schema instance to a file with the extension “.csi”. In Step 3 (Linking of schema instances) we have two kinds of schema instances as inputs. These are linked in parallel with the linking of the regular object files. CANGccWrapper invokes CANLink to perform this step. As a result there will be only a few files which contain all the extracted information that belong to the different subsystems of the subject system. The function of the wrapper ends here in this step, where all the extracted information is available for further processing. Step 4 (Filtering the schema instances) deals with filtering the schema instances that were obtained. Since this step is optional (the linked schema instances can be used as they are without any filtering as well) and we wanted to analyze
the whole system, we did no filtering at all. The extracted information can be used for many purposes. In this work we calculated object oriented metrics in Step 5 from the schema instances with the help of the CAN2Metrics command line tool (the output is a simple CSV–Comma Separated Value file which can be easily processed by spreadsheet editors). Our approach is still not fool-proof because we found some configuring examples in makefiles that seem quite “sneaky.” For instance, objects may be moved to another directory before linking, so our wrapper will not find the files containing the associated schema instances in Step 3 (it searches for them next to the original location of the object files). One solution might be to wrap the cp (file copy), mv (file move) and ln (file link) commands in a similar way as that done by the compiler. To test our wrapping approach we successfully extracted facts from the open source real-world system Mozilla [13, 14] and calculated various metrics from the schema instances that we obtained.
3. Experiments In this section we analyze Mozilla using metrics. We collected metrics from seven different versions of Mozilla from 1.0 released in August of 2002 to 1.6 released in January of 2004. We did not classify the metrics according to their purpose or usability nor did we search for correlations between them. Instead, we used the results of Basili et al. and studied the metrics according to [1]. Basili et al. studied object oriented systems written by students in C/C++. They carried out an experiment in which they set up eight project groups consisting of three students each. Each group had the same task – to develop a small/medium-sized software system. Since all the necessary documentation (for instance, reports about faults and their fixes) was available, they could search for relationships between the fault density and metrics. They used a metrics suite that consists of six metrics and analyzed the distribution and correlations between them. Afterwards, they used logistic regression – a standard technique based on maximum likelihood estimation – to analyze the relationship between metrics and the fault-proneness of classes. In this paper we refer to their projects as the reference project. In the following we define the six metrics they investigated. WMC (Weighted Methods per Class). The WMC is the number of methods defined in each class. More precisely, WMC is defined as being the number of all member functions and operators defined in each class. However, “friend” operators (C++ specific construct) are not counted. Member functions and operators inherited from the ancestors of a class are also not counted. DIT (Depth of Inheritance Tree). The DIT measures the number of ancestors of a class.
RFC (Response For a Class). This is the number of methods that can potentially be executed in response to a message being received by an object of that class. The RFC is the number of C++ functions directly invoked by member functions or operators of a C++ class. NOC (Number Of Children). This is the number of direct descendants for each class. LCOM (Lack of Cohesion on Methods). This is the number of pairs of member functions without shared instance variables, minus the number of pairs of member functions with shared instance variables. However, the metric is set to zero whenever the above subtraction is negative. CBO (Coupling Between Object classes). A class is coupled to another one if it uses its member functions and/or instance variables. The CBO gives the number of classes to which a given class is coupled. We should mention here that some of these metrics have different names in Columbus (for instance DIT is called NOA–Number Of Ancestors) but, for simplicity, we use their corresponding names in this work. Table 1 lists some size metrics of the analyzed versions of Mozilla. ver. 1.0 1.1 1.2 1.3 1.4 1.5 1.6
NCL 4,770 4,823 4,686 4,730 4,967 5,007 4,991
TLOC 1,127,391 1,145,470 1,154,685 1,151,525 1,171,503 1,169,537 1,165,768
TNM 69,474 70,247 70,803 70,805 72,096 72,458 72,314
TNA 47,428 48,070 46,695 47,012 48,389 47,436 47,608
NCL: Number of Classes. TLOC: Total number of non-empty lines of code. TNM: Total Number of Methods in the system. TNA: Total Number of Attributes in the system.
Table 1. System level metrics In the following we compare some statistical data and the distribution of metrics collected from Mozilla and the reference project. Afterwards, using the findings of the reference project in [1], we investigate how Mozilla changed over a seven-version evolution.
3.1. Comparing the Reference Project and Mozilla In this subsection we compare the metrics obtained from Mozilla 1.6 with those of the reference project. Since in the reference project there are only 180 classes, while in Mozilla 1.6 there are 4,991 of them, we decided to normalize the distribution of the metrics. This means that we compared the rate of the metrics instead of the measured values.
Figure 2 shows a comparison of the distribution of the metrics. It can be seen that the distributions of WMC, RFC, NOC and LCOM are quite similar in both cases. On the other hand, the distributions of DIT and CBO are quite different. We also compared the statistical information we obtained. Table 2 shows the basic statistical information about the two systems. The Minimum values are almost the same but the Maximum values increased dramatically. This is not surprising because Mozilla has about 30 times more classes than the reference project. Since LCOM is proportionate with the square of the size (number of methods) of a class, its very large value is to be expected. In Mozilla there are about five thousand classes, so the extremely high value of NOC may seem surprising at first. But the second biggest value of NOC is just 115, hence we think that the class with the largest value is probably a common base class from which almost all other classes are inherited. Median and Mean express “a kind of average” and they are more or less similar, except for the LCOM value (similarly to the Max. value). Since in Mozilla there are many more classes and these are more variegated, the metrics change in a wider range. The Standard Deviation values suggest this bigger variety of the classes. Basili et al. [1] also calculated the correlations of the metrics (see Table 3), which is also an important statistical quantity. They found that linear Pearson’s correlation (R2 : Coefficient of determination) between the studied OO metrics are, in general, very weak. Three coefficients of determination appear somewhat more significant. But they conclude that these metrics are mostly statistically independent. We also calculated the same correlations in the case of Mozilla 1.6 but we obtained different results. NOC is independent of the other metrics as it is in the reference project, but all the others have a correlation with each other. There are three very weak correlations but the rest represent more or less significant correlations. What is more, there are some very large values (for instance between WMC and LCOM), so it follows that these metrics are not totally independent and represent redundant information. This is surprising because they found that some of these metrics could be used for detecting fault-proneness while the others are not significant. Unfortunately, we could not verify this for Mozilla, because we did not have such good documentation about the faults they had. (We should mention that the reported faults about Mozilla are available from Bugzilla [5], but it is difficult to collect and group the necessary data. In the future we will try to use this information to validate the metrics for fault-proneness prediction based on it.) We did not find any information that contradicted [1], so we accepted their hypotheses and results and investigated the changes of Mozilla over its seven-version development.
60
60
50
50
40
40
30
30
20
20
10
10
0
0 0
10
20
30
40
50
60
70
80
90
100
0
1
2
3
4
5
WMC
6
7
8
9
10
6
7
8
9
10
18
21
24
27
30
DIT
30
90 80 70 60 50 40 30 20 10 0
20
10
0 0
11
22
33
44
55
66
77
88
99
110
0
1
2
3
RFC
4
5
NOC
100 90 80 70 60 50 40 30 20 10 0
60 50 40 30 20 10 0 0
45
90
135
180
225
270 315
360
405
450
0
3
6
9
LCOM
12
15
CBO
The X axes represent the values of the metrics. The Y axes represent the rate of the number of classes. The darker columns represent the original values of the reference project from [1], while the brighter ones represent the values calculated from Mozilla 1.6.
Figure 2. Distribution of the metrics
Ref. | Moz. Max. Min. Median Mean Std. dev.
WMC 99.00 337.00 1.00 0.00 9.50 7.00 13.40 14.12 14.90 22.16
9.00 0.00 0.00 1.32 1.99
DIT 33.00 0.00 2.00 2.39 2.90
105.00 0.00 19.50 33.91 33.37
RFC 1074.00 0.00 21.00 48.95 81.99
13.00 0.00 0.00 0.23 1.54
NOC 1213.00 0.00 0.00 1.06 17.44
LCOM 426.00 55198.00 0.00 0.00 0.00 15.00 9.70 273.82 63.77 1597.53
CBO 30.00 70.00 0.00 0.00 5.00 2.00 6.80 5.11 7.56 7.49
The bold numbers represent the values from Mozilla 1.6 while the normal ones are the values from the reference project.
Table 2. Descriptive statistics of the classes
3.2. Studying Mozilla’s Changing Basili et al. [1] drew up six hypotheses (one for each metric) that represent the expected connection between the metrics and the fault-proneness of the code. They tested these hypotheses and found that some of the metrics were very good predictors, while others were not.
Since we wanted to examine how Mozilla has changed in the last one and half years, we first calculated these metrics for each version of Mozilla from 1.0 to 1.6. The results can be seen in Table 4. Now we are able to use the conclusions drawn in [1] to characterize the changing of Mozilla. We present all the hypotheses and conclusions about the “good-
Reference WMC DIT RFC NOC LCOM CBO Mozilla WMC DIT RFC NOC LCOM CBO
WMC 1
DIT 0.02 1
RFC 0.24 0 1
NOC 0 0 0 1
LCOM 0.38 0.01 0.09 0 1
WMC 1
DIT 0.16 1
RFC 0.53 0.54 1
NOC 0 0 0 1
LCOM 0.64 0.08 0.31 0 1
CBO 0.13 0 0.31 0 0.01 1 CBO 0.39 0.23 0.51 0 0.16 1
The bold numbers denote significant correlations.
Table 3. Correlations ness” of the metrics for detecting fault-proneness as presented in [1] and examine the changes of Mozilla based on their conclusions. WMC hypothesis: “A class with significantly more member functions than its peers is more complex and, by consequence, tends to be more fault-prone.” The WMC was found to be somewhat significant in [1]. In Mozilla the rate of classes with a large WMC value decreased slightly but not significantly. We can only say that Mozilla did not get worse according to this metric. DIT hypothesis: “A class located deeper in a class inheritance lattice is supposed to be more fault-prone because the class inherits a large number of definitions from its ancestors.” The DIT was found to be very significant in [1], which means that the larger the DIT, the larger the probability of fault-proneness. In Mozilla the rate of classes with more than seven ancestors increased slightly, but the number of these classes is tiny compared to the classes as a whole. On the other hand, the rate of classes which have no ancestors or only one or two increased significantly, while the rate of classes with more than two but fewer than seven ancestors decreased markedly. This suggests that in the newer versions of Mozilla there might be fewer faults. RFC hypothesis: “Classes with larger response sets implement more complex functionalities and are, therefore, more fault-prone.” The RFC was shown to be very significant in [1]. The larger the RFC, the larger the probability of fault-proneness. In Mozilla the rate of classes whose RFC value is larger than eleven decreased (more than 70% of the classes fall into this group), while the rate of the rest of the classes increased. Overall, this suggests an improvement. NOC hypothesis: “We expect classes with large number of children to be more fault-prone.” The NOC appeared to be very significant but the observed trend is contrary to what was stated by the hypothesis. The larger the NOC the
lower the probability of fault-proneness [1]. In Mozilla the number of classes with three or more children is negligible and it did not change significantly. Hence, we only examined the other classes. The rate of classes with no or two children decreased while the rate of classes with one child increased. According to this Mozilla slightly improved in this respect. LCOM hypothesis: “Classes with low cohesion among its methods suggests an inappropriate design which is likely to be more fault-prone.” The LCOM was stated to be insignificant in [1], but according to the hypothesis Mozilla got slightly worse because the rate of classes with the value eleven or more increased slightly while the rest remained about the same. CBO hypothesis: “Highly coupled classes are more fault-prone than weakly coupled classes.” The CBO was said to be significant in [1] but it is hard to say anything about Mozilla using this metric. The rate of classes whose CBO value is one, two or three increased and the rate of classes whose CBO value is four, five or six decreased, which is good and may suggest an increase in the quality. On the other hand, the rate of classes with large CBO values increased, which suggests more faults. So far we compared the distribution of the metrics collected from seven different versions of Mozilla. This is very useful if we are interested in learning how the whole system changed but it means little if we want to examine only some classes of interest. In that case, we have to study the changes in the metrics for the given class. We may illustrate this using one of the biggest classes. We chose nsHTMLEditor because three out of the six of its metrics are maximal in the whole system (see Table 5). As we can see, more than a hundred new methods have been added and its response set grew by more than two hundred. The DIT also grew by 30%. But LCOM changed the most significantly because it is twice as big as it was in version 1.0. According to these values, this class became much more fault-prone.
ver. 1.0 1.1 1.2 1.3 1.4 1.5 1.6
WMC 235 238 250 256 295 337 337
DIT 13 13 13 14 15 17 17
RFC 843 852 885 902 1005 1071 1074
NOC 0 0 0 0 0 0 0
LCOM 27233 27939 30805 32262 42529 55200 55198
CBO 50 50 51 51 57 56 57
Table 5. Metrics of class nsHTMLEditor
WMC 1.0 1.1 1.2 1.3 1.4 1.5 1.6 DIT 1.0 1.1 1.2 1.3 1.4 1.5 1.6 RFC 1.0 1.1 1.2 1.3 1.4 1.5 1.6 NOC 1.0 1.1 1.2 1.3 1.4 1.5 1.6 LCOM 1.0 1.1 1.2 1.3 1.4 1.5 1.6 CBO 1.0 1.1 1.2 1.3 1.4 1.5 1.6
0 0.75 0.77 0.75 0.85 0.85 0.88 0.88 0 15.87 16.03 16.82 16.77 17.13 17.30 17.35 0 0.69 0.70 0.68 0.70 0.66 0.66 0.66 0 63.19 63.03 62.27 62.05 62.63 62.63 62.67 0 17.40 17.42 16.30 16.17 16.87 16.98 16.99 0 42.01 42.07 40.52 40.38 40.14 40.24 40.29
1 5.28 5.31 4.57 4.63 5.05 5.15 5.11 1 30.21 30.27 32.18 32.43 32.05 32.14 32.32 1 1.53 1.58 1.62 1.61 1.65 1.68 1.72 1 24.40 24.49 25.63 25.86 25.81 25.80 25.81 1 10.04 9.91 8.28 8.50 8.94 8.77 8.82 1 5.95 5.70 6.15 6.45 7.31 7.27 7.47
2 11.68 11.51 9.67 9.81 10.61 10.49 10.54 2 18.70 18.66 19.40 19.56 20.56 20.61 20.46 2 1.19 1.20 1.24 1.23 1.43 1.42 1.48 2 6.02 6.03 5.68 5.69 5.21 5.23 5.19 2 0.38 0.39 0.38 0.21 0.18 0.20 0.18 2 4.49 4.67 4.67 4.90 4.63 4.99 4.95
3 7.95 7.78 7.75 8.10 8.25 8.31 8.56 3 11.22 11.07 10.76 10.57 10.51 10.51 10.62 3 0.99 0.89 0.96 0.99 1.15 1.22 1.22 3 2.33 2.36 2.50 2.45 2.38 2.34 2.34 3 6.86 6.84 6.81 6.87 7.15 7.23 7.35 3 3.40 3.34 3.69 3.70 3.76 3.69 3.75
4 7.15 7.22 7.68 7.51 7.39 7.43 7.43 4 8.41 8.29 7.15 7.21 6.54 6.45 6.15 4 2.18 2.26 2.43 2.39 2.36 2.38 2.28 4 1.01 1.04 0.94 0.95 0.87 0.92 0.98 4 1.51 1.60 1.24 0.91 0.99 0.96 0.94 4 4.72 4.71 3.56 3.26 3.22 3.08 3.15
5 6.39 6.47 6.12 6.07 6.00 5.97 5.75 5 4.61 4.67 3.59 3.59 3.00 2.96 2.89 5 4.88 4.96 5.25 5.64 5.66 5.55 5.65 5 0.65 0.66 0.73 0.80 0.95 0.96 0.94 5 0.25 0.23 0.21 0.17 0.14 0.18 0.18 5 5.51 5.72 6.02 3.68 3.72 3.69 3.55
6 5.51 5.62 5.89 6.03 5.92 5.99 6.03 6 4.49 4.46 2.86 2.62 2.23 2.16 2.24 6 4.53 4.42 4.69 4.69 4.83 4.89 4.89 6 0.55 0.50 0.38 0.40 0.38 0.42 0.38 6 5.70 5.68 6.42 6.26 6.02 6.03 6.19 6 6.71 6.49 6.87 5.60 5.76 5.75 5.65
7 5.66 5.64 5.95 5.90 5.92 5.89 5.89 7 1.34 1.41 1.94 2.01 2.19 1.80 1.86 7 3.02 3.11 3.37 3.28 3.36 3.36 3.39 7 0.38 0.35 0.38 0.32 0.34 0.30 0.34 7 0.52 0.56 0.49 0.44 0.36 0.44 0.42 7 4.47 4.37 4.37 5.79 5.86 5.85 5.77
8 5.03 5.16 5.16 5.14 5.29 5.35 5.31 8 1.28 1.33 1.34 1.31 1.79 1.18 1.18 8 2.98 3.11 3.41 3.49 3.52 3.63 3.43 8 0.17 0.21 0.19 0.15 0.10 0.12 0.14 8 0.61 0.62 0.66 0.93 0.95 1.04 1.08 8 3.31 3.30 3.39 3.95 3.78 3.56 3.67
9 4.97 4.93 5.29 5.22 4.99 4.89 4.91 9 0.65 0.60 0.64 0.63 0.77 0.96 0.92 9 2.16 2.20 2.26 2.33 2.48 2.40 2.54 9 0.10 0.15 0.17 0.19 0.20 0.16 0.16 9 1.47 1.51 1.54 0.66 0.66 0.66 0.62 9 2.94 3.09 3.14 3.21 3.34 3.40 3.23
10 3.23 3.32 3.59 3.45 3.50 3.50 3.47 10 0.92 0.93 0.94 0.97 0.91 1.44 1.44 10 2.58 2.55 2.84 2.75 2.64 2.76 2.79 10 0.19 0.17 0.11 0.11 0.10 0.12 0.06 10 4.49 4.46 4.37 4.14 4.11 4.09 3.87 10 2.68 2.63 2.77 3.21 2.92 2.84 2.93
11-20 18.81 18.74 19.23 19.20 18.90 18.97 18.95 11-20 2.18 2.16 2.26 2.16 2.05 2.26 2.32 11-20 19.87 19.72 18.84 18.52 19.23 19.79 19.82 11-20 0.63 0.66 0.70 0.72 0.70 0.70 0.68 11-20 7.63 7.67 7.87 9.03 9.12 9.07 9.14 11-20 9.77 9.79 10.50 11.52 11.54 11.68 11.58
21-30 6.71 6.66 7.00 7.00 6.78 6.73 6.63 21-30 0.13 0.12 0.13 0.15 0.24 0.24 0.22 21-30 15.77 15.82 13.70 13.55 13.69 13.82 13.84 21-30 0.19 0.15 0.15 0.15 0.14 0.12 0.12 21-30 7.74 7.84 8.28 8.22 8.23 8.29 8.19 21-30 2.41 2.41 2.65 2.54 2.46 2.36 2.32
31-40 3.61 3.63 3.76 3.72 3.48 3.52 3.53 31-40 0.00 0.00 0.00 0.02 0.02 0.02 0.02 31-40 7.74 7.59 7.49 7.74 7.63 7.31 7.23 31-40 0.04 0.06 0.06 0.04 0.06 0.06 0.08 31-40 3.86 3.92 3.99 4.14 4.15 3.95 3.93 31-40 0.99 1.04 1.00 1.10 0.91 1.02 1.08
41-50 2.08 2.11 2.09 2.05 1.99 1.86 1.92 41-50 0.00 0.00 0.00 0.00 0.00 0.00 0.00 41-50 5.70 5.66 6.06 5.98 5.98 5.59 5.43 41-50 0.04 0.02 0.00 0.02 0.02 0.02 0.00 41-50 2.87 2.90 3.24 3.21 3.06 3.08 3.05 41-50 0.40 0.44 0.41 0.42 0.40 0.34 0.38
505.20 5.14 5.51 5.35 5.05 5.07 5.09 500.00 0.00 0.00 0.00 0.00 0.00 0.00 5024.19 24.24 25.14 25.12 23.74 23.55 23.62 500.13 0.12 0.11 0.11 0.10 0.10 0.10 5028.68 28.45 29.90 30.13 29.07 29.04 29.05 500.25 0.25 0.28 0.27 0.24 0.24 0.24
The numbers represent the rate of classes having the metric value in its column header.
Table 4. Changing of the metrics over the seven versions of Mozilla
4. Related Work Mozilla was investigated earlier by Godfrey and Lee [12]. They examined the software architecture model of Mozilla Milestone-9. The authors used the PBS [9] and Acacia [6] reverse engineering systems for fact extraction and visualization. They created the subsystem hierarchy of Mozilla and looked at the relationships among them. Their model consists of 11 top-level systems which may be divided into smaller subsystems. They created the subsystem
hierarchy by taking into consideration things like source directory structure and software documentation. It turned out that the dependency graph was near complete, which means that almost all the top-level systems use each other. Fioravanti and Nesi [10] took the results of the same projects as Basili et al. in [1] to examine how metrics could be used for fault-proneness detection. They calculated 226 metrics and their aim was to choose a minimal number relevant for obtaining a good identification of faulty classes in medium-sized projects. First they reduced the number of
metrics to 42 and attained very high accuracy score (more than 97%). This model was still too large to be useful in practice. By using statistical techniques based on logistic regression they created a hybrid model which consists of only 12 metrics with an accuracy that is still good enough to be useful (close to 85%). The metrics suite they obtained is not the same as the one used in [1] but there are many similarities. Yu, Syst¨a and M¨uller chose eight metrics in [16] (actually ten because CBO and RFC was divided into two different kinds) and they examined the relationship between these metrics and the fault-proneness. The subject system was the client side of a large network service management system developed by three professional software engineers. It was written in Java and consisted of 123 classes and around 34,000 lines of code. First they examined the correlation among the metrics and found four highly correlated subsets. Then they used univariate analysis to find out which metrics could detect faults and which could not. They found that three of the metrics (CBO in, CBO out and DIT) were unimportant while the others were significant but to different extents (NMC, LOC, CBO out, RFC out, LCOM, NOC and Fan-in).
5. Conclusion and Future Work This paper makes three key contributions: (1) we presented a method and toolset with which facts can be automatically extracted from real-size software; (2) using the collected facts we calculated object oriented metrics and supplemented a previous work [1] with measurements made on the real-world software Mozilla; and (3) using the calculated metrics we studied how Mozilla’s predicted faultproneness has changed over seven versions covering one and a half years of development. When checking the seven versions of Mozilla we found that the predicted fault-proneness of the software as a whole decreased slightly but we also found example classes with an increased probability of fault-proneness. In the future we plan to validate the object oriented metrics and hypotheses presented in [1] (and here as well) on Mozilla for fault-proneness detection using the reported faults which are available from the Bugzilla database [5]. We also plan to scan Mozilla (and also other open source systems) regularly for fault-proneness and make these results publicly available.
References [1] V. R. Basili, L. C. Briand, and W. L. Melo. A Validation of Object-Oriented Design Metrics as Quality Indicators. In IEEE Transactions on Software Engineering, volume 22, pages 751–761, Oct. 1996.
[2] L. C. Briand, W. L. Melo, and J. W¨ust. Assessing the Applicability of Fault-Proneness Models Across Object-Oriented Software Projects. In IEEE Transactions on Software Engineering, volume 28, pages 706–720, 2002. [3] L. C. Briand and J. W¨ust. Empirical Studies of Quality Models in Object-Oriented Systems. In Advances in Computers, volume 56, Sept. 2002. [4] L. C. Briand, J. W¨ust, J. W. Daly, and D. V. Porter. Exploring the Relationships between Design Measures and Software Quality in Object-Oriented Systems. In The Journal of Systems and Software, volume 51, pages 245–273, 2000. [5] Bugzilla for Mozilla . http://bugzilla.mozilla.org. [6] Y.-F. Chen, E. R. Gansner, and E. Koutsofios. A C++ Data Model Supporting Reachability Analysis and Dead Code Detection. In IEEE Transactions on Software Engineering, volume 24, pages 682–693, Sept. 1998. ´ Besz´edes. Data Exchange with the Colum[7] R. Ferenc and A. bus Schema for C++. In Proceedings of the 6th European Conference on Software Maintenance and Reengineering (CSMR 2002), pages 59–66. IEEE Computer Society, Mar. 2002. ´ Besz´edes, M. Tarkiainen, and T. Gyim´othy. [8] R. Ferenc, A. Columbus – Reverse Engineering Tool and Schema for C++. In Proceedings of the 18th International Conference on Software Maintenance (ICSM 2002), pages 172–181. IEEE Computer Society, Oct. 2002. [9] P. Finnigan, R. Holt, I. Kalas, S. Kerr, K. Kontogiannis, H. Mueller, J. Mylopoulos, S. Perelgut, M. Stanley, and K. Wong. The Software Bookshelf. In IBM Systems Journal, volume 36, pages 564–593, Nov. 1997. [10] F. Fioravanti and P. Nesi. A Study on Fault-Proneness Detection of Object-Oriented Systems. In Fifth European Conference on Software Maintenance and Reengineering (CSMR 2001), pages 121–130, 2001. [11] Homepage of FrontEndART Software Ltd. http://www.frontendart.com. [12] M. W. Godfrey and E. H. S. Lee. Secrets from the Monster: Extracting Mozilla’s Software Architecture. In Proceedings of the 2nd International Symposium on Constructing Software Engineering Tools (CoSET 2000), June 2000. [13] The Mozilla Homepage. http://www.mozilla.org. [14] C. R. Reis and R. P. de Mattos Fortes. An Overview of the Software Engineering Process and Tools in the Mozilla Project. In Proceedings of the Workshop on Open Source Software Development, pages 155–175, Feb. 2002. ´ Besz´edes, and R. Ferenc. Columbus Schema [15] L. Vid´acs, A. for C/C++ Preprocessing. In Proceedings of the 8th European Conference on Software Maintenance and Reengineering (CSMR 2004), pages 75–84. IEEE Computer Society, Mar. 2004. [16] P. Yu, T. Syst¨a, and H. M¨uller. Predicting Fault-Proneness using OO Metrics: An Industrial Case Study. In Sixth European Conference on Software Maintenance and Reengineering (CSMR 2002), pages 99–107, 2002.