946
IEEE TRANSACTIONS ON INFORMATION FORENSICS AND SECURITY, VOL. 6, NO. 3, SEPTEMBER 2011
Extrinsic Signature Embedding and Detection in Electrophotographic Halftoned Images Through Exposure Modulation Pei-Ju Chiang, Jan P. Allebach, Fellow, IEEE, and George T.-C. Chiu
Abstract—Printer identification based on printed documents can provide forensic information to protect copyright and verify authenticity. In addition to intrinsic features (intrinsic signatures) of the printer, modulating the printing process to embed specific features (extrinsic signatures) will further extend the encoding capacity and decoding accuracy. One of the key issues with embedding extrinsic signatures is that the embedding should not degrade the image quality, but needs to be detectable by a detection algorithm. In this paper, we will demonstrate the feasibility of embedding code sequences in electrophotographic halftone images by modulating dot size through laser intensity modulation. We have developed corresponding embedding and detection algorithms to embed and extract information. Experimental results indicate that using a 600 dpi native resolution printer’s default halftone algorithm, we can encode 5 bits of information in every 310 printer scan-lines or approximately every 0.5 inches. Index Terms—Electrophotographic (laser) printer, extrinsic signature embedding, halftoned images, laser intensity modulation, printer identification.
I. INTRODUCTION A. Scenario for External Signature Embedding ESPITE the digital age in which we live, paper documents continue to play an important role in our daily lives. In many cases, it is necessary to confirm the veracity of a paper document in order to authorize the completion of a transaction [1]–[3]. Less frequently, but no less importantly, it may be desirable to trace a paper document back to the specific device that was used to print it [1], [2], [4]. Both these scenarios can be
D
Manuscript received September 07, 2010; revised April 22, 2011; accepted April 28, 2011. Date of publication May 19, 2011; date of current version August 17, 2011. This work was supported in part by the National Science Foundation under Grant CCR-0219893 and Grant CNS-0524540 and in part by the National Science Council of Taiwan under Grant NSC99-2218-E-194-004. Any opinions, findings, and conclusions or recommendations expressed in this material are those of the authors and do not necessarily reflect the views of the National Science Foundation or the National Science Council of Taiwan. Research partially conducted while P.-J. Chiang was a graduate student at Purdue University, West Lafayette, IN. The associate editor coordinating the review of this manuscript and approving it for publication was Dr. Min Wu. P.-J. Chiang was with Purdue University, West Lafayette, IN 47906 USA. She is now with the Advanced Institute of Manufacturing for High-tech Innovations and Department of Mechanical Engineering, National Chung Cheng University, Taiwan (e-mail:
[email protected]). G. T.-C. Chiu is with the School of Mechanical Engineering, Purdue University, West Lafayette, IN 47906 USA. J.-P. Allebach is with the School of Electrical and Computer Engineering, Purdue University, West Lafayette, IN 47906 USA. Color versions of one or more of the figures in this paper are available online at http://ieeexplore.ieee.org. Digital Object Identifier 10.1109/TIFS.2011.2156789
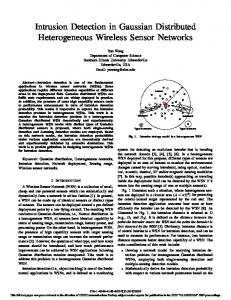
Fig. 1. Scenario for external signature embedding.
viewed within the general framework shown in Fig. 1. Here the information to be printed originates within the trusted domain of a service provider. In the use case of document authentication, for instance, the service provider may be selling either a product or a service, for which the paper document acts to define what is that item or service. An obvious example is a coupon or ticket of some sort. When the user orders and pays for this item via the Web, he or she receives two kinds of information. The first kind is the overt information that the user sees, and which will be visibly printed in the document. This information might describe what is the item or service that has been purchased, where the user should go to complete the transaction, and what is the cost of the product or service. The second kind of information is hidden from the user. It forms the basis for validating the transaction, i.e., verifying that the bearer of this document is indeed entitled to the product or service that is described in the document. This information will be embedded in the document as an extrinsic signature. It will not be visible in the printed document. In order to secure this information, it may be encrypted. Once these two modules of information leave the service provider, they enter an unsecured, open domain over which the service provider has no control. The user prints the document, and during this process, unbeknownst to the user, the hidden information is also printed in the document as an extrinsic signature. The user then takes the printed document to a point of fulfillment of the purchased product or service. Here the document is scanned, possibly to extract information about the product or service to be provided, and certainly, to authenticate the document and the transaction that it authorizes. The scanner, the scanned data, and everything beyond this point are assumed to be again within a trusted domain. The objective of this paper is to present one possible method whereby the hidden information may be embedded in the printed document. When we consider the options here, it is helpful to envision the document as a form that contains a
1556-6013/$26.00 © 2011 IEEE
CHIANG et al.: EXTRINSIC SIGNATURE EMBEDDING AND DETECTION
947
Fig. 2. Block diagram of the proposed laser intensity signature embedding system. In the signature embedding controller, the bi-level image (video) signal is obtained from the rasterizing image processor (RIP); and the beam detect signal is obtained from the print engine controller. The beam detect signal flags the start of each new line. In the signature embedding controller, the signature code is converted to an analog signal that augments the laser intensity control signal sent to the laser diode to drive the writing system.
number of elements or fields that could be text, graphics, or images. Some of these elements are fixed, and do not vary from instance to instance of the form, whereas others comprise variable data that is unique to each instance of the form. However, even the variable data may have common characteristics from instance to instance. Any one of the three types of elements can be used for embedding of information. For example, coordinates of B-spline control points of curves or graphics [5] can be tuned, character placement can be perturbed [6], or the edges of character strokes [7] or straight lines on the border of a form [8] can be modulated. B. Signature Embedding for Images Of particular interest in this paper is the embedding of information within images that comprise either the fixed or variable. Within this more restricted context, a number of possibilities come to mind. Perhaps the first is to watermark the continuous-tone image [9]–[12]. This is certainly a viable option; and it would typically be done at a fairly early stage in the imaging pipeline of the printer. To be successful, the watermark would have to survive the print-scan cycle; but methods are known that have this capability. In addition, watermarking methods can have very high capacity of embedded data per square inch of image area. A primary weakness of traditional watermarking approaches is that by virtue of the fact that they are applied to the continuous-tone image, they are more susceptible to hacking. Another option would be to embed the signature in the digital halftone version of the image. As with watermarking of the continuous-tone image, a number of approaches have been proposed to do this [13]–[29]. Since the halftone image is essentially binary, such methods should be very robust to the printscan cycle. In addition, the methods that have been proposed in this domain can also have large capacity. However, in contrast to the watermarking of a continuous-tone image, the methods that have been proposed for embedding a signature within a digital halftone may not be well suited to the target marking engine technology and imaging pipeline. In addition, many of these approaches cause a perceptible reduction in the quality of the printed image.
In this paper, the marking engine technology that we consider is an electrophotographic (EP) system in which the latent image is written on a rotating organic photoconductor (OPC) drum using a laser scanner, as illustrated in Fig. 2 that shows a block diagram for our specific system. The laser scanner is one of the most common technologies used with EP printers that can be purchased in the marketplace today. With modern digital printers, design of the halftoning process is an integral part of the overall product development [30]. The choice of the basic halftoning architecture is mediated by characteristics of the target marking process and the characteristics of the hardware/firmware pipeline, within which the halftoning is to be performed. With laser EP printers, the overwhelming choice of halftoning algorithm is a screen-based algorithm that generates periodic, clustered dots. Algorithms, such as error diffusion or dot-diffusion [31], [32], that generate aperodic or stochastic, dispersed-dot textures are eschewed because of the complexity of their implementation and the fact that such textures cannot be stably printed with an EP marking process [33]. The exception to this rule is that in scan-to-print applications, such as a copier, multifunction peripheral (MFP), or all-in-one (AIO) device, a stochastic, partially clustered-dot halftone texture may be used to prevent beating between the native screen of the printer and the periodic halftone pattern already present in the scanned content that is to be reproduced [34]. Our application scenario shown in Fig. 1 does not involve printing scanned content, although this could potentially arise in an antiforensics situation, as will be discussed in Section V at the end of this paper. Even within the context of a specific halftoning architecture, such as periodic, clustered-dot screening, the halftoning algorithm design is highly customized to take advantage of the features of the target marking engine technology and hardware/ firmware imaging pipeline, as well as to minimize the appearance of artifacts that may be a consequence of the behavior of the target marking technology and imaging pipeline. For example, the laser EP printer that we used for the work reported in this paper achieves subpixel addressability in the laser scan direction by switching the laser beam on and off within each pixel.
948
IEEE TRANSACTIONS ON INFORMATION FORENSICS AND SECURITY, VOL. 6, NO. 3, SEPTEMBER 2011
To exploit this capability, the halftone data sent to the marking engine is not binary-valued, but rather consists of one byte per printer-addressable pixel. Within each byte, the lower six bits set the laser pulse width; and the upper two bits determine the justification of the laser pulse within the pixel boundaries [35]. It may be left, right, centered, or split. The design of a color, periodic, clustered-dot screen set requires the selection of a set of tile vectors, followed by the definition of rules for dot growth for each of the colorant screens [30], [33]. These choices are governed by many target-printer-specific factors, including the need to avoid moiré artifacts causing by beating of the periodic screens with residual periodicities in the process (cross-scan) direction due to imperfections in the rotating laser scanner mirror shown in Fig. 2, the similar need to avoid moiré artifacts caused by beating of the colorant screens against each other, and the manner in which the marking technology behaves in the presence of specific dot growth rules. Once the screens are designed, it is then necessary to develop the color transformations and tables that determine the appropriate CMYK combination that will be sent to the marking engine for each particular sRGB combination in the input document. If the halftone screens are modified, this characterization process must be redone. As a consequence of all the factors discussed above, the number of native screen sets supported by a given digital printer is, in fact, quite small and is highly optimized for that particular printer. This is in contrast to the workflow for analog, commercial offset printing in which the halftoning is done in a stand-alone rasterizing image processor (RIP), relatively independently of the press on which the document is to be printed. C. Extrinsic Signature Embedding and Detection Scheme Among the methods [13]–[29] proposed for embedding an external signature in a halftone image, our method is unique in three important aspects: (1) It works down-stream from the native halftoning process of the target printer. Thus, it requires no modification to that halftoning process, although the parameters of the embedding process would need to be separately optimized for each such printer-halftoning-algorithm combination. (2) Our embedding method introduces no visible change to the printed halftone image. (3) The modulation is done at a very low-level in the hardware near the end of the imaging pipeline. We believe that this will make our approach inherently more resistant to tampering. Each one of these advantages may also be viewed as a constraint that restricts the manner in which the modulation may be performed. Consequently, our method has the disadvantage of a lower data embedding capacity than other methods for embedding an external signature in a halftone image. For these same reasons, it may also be more suspectible to attack, as discussed in Section V. Our embedding method is based on modulating the intensity of the scanning laser beam shown in Fig. 2, and hence the absorptance of the printed content, on a line-to-line basis. The embedded signature may be recovered by scanning the printed page, deskewing it, and projecting the data in the scan direction. Although the entire page is modulated in this fashion, we consider here only those regions of the page that contain halftones of continuous-tone image data. Thus, a first step in the pro-
cessing of the scanned page would be to segment it to separate image and non-image regions. In other work, we have considered the extraction of information embedded by laser intensity modulation in the strokes of characters [7] and the borders of forms [8]. Because of the inherently noisy nature of the EP process, we implement an error correction strategy based on Gold codes [36], [37]. The specific printer on which our work is based is the HP Color LaserJet 4500. Fig. 2 shows a block diagram of the system. Although this is a color printer, in our work we use only the black (K) channel to embed signatures in monochrome halftone images. The remainder of the paper is organized as follows. Laser intensity modulation is summarized in Section II-A followed by a discussion in Section II-B of the image quality metric used in this study. Information embedding and extraction will be presented in Section III followed by experimental verification in Section IV. Section V examines issues of antiforensics with respect to our embedding method. A summary and conclusions are given in Section VI. II. PRELIMINARIES A. Electrophotographic Process and Laser Intensity Modulation Fig. 2 shows the basic process block diagram for embedding signals by modulating the laser intensity during the EP process [38], [39]. Modulating the laser intensity effectively modulates the exposure energy and changes the level of discharge on the surface of the photoconductor. With a constant bias voltage, the amount of discharge determines the amount of toner attracted in the development step and consequently the size of the dots formed by the toner particles. The changes in dot size result in changes in effective reflectance as viewed by the human observer. Introducing a designated modulation in laser intensity will result in a corresponding change of reflectance in the image that can be detected after the image is captured with a calibrated scanner. To maintain process stability, the range of laser intensities that can be used to embed extrinsic signatures is limited. Ideally, the laser intensity can be modulated pixel-by-pixel. However, to generate banding-like features as extrinsic signatures, the laser intensity modulation is done on a scan-line by scan-line basis, i.e., the laser intensity is constant in the scan direction and is changed from scan-line to scan-line in the process direction. Let be the index of the scan-line in the process direction , then the laser intensity modulation is accomplished by modulating the laser intensity control signal as (1) denotes the nominal intensity control signal correwhere sponding to normal operation and denotes the modulation signal. B. Evaluation of Image Quality One of the key issues with embedding an extrinsic signature is that the embedded signature should not degrade the print/ image quality, but needs to be detectable by a suitable detection algorithm. To evaluate image quality, a well defined metric
CHIANG et al.: EXTRINSIC SIGNATURE EMBEDDING AND DETECTION
949
is needed. Since banding perception depends on the relative change in luminance (contrast) of the image, the contrast sensitivity function (CSF), which characterizes the ability of the HVS to discern small luminance variations at different spatial frequencies, will be used as the basis for the image quality metric. Many representations of the CSF have been reported [40]–[42]. For example, Mannos and Sakrison [40] parameterized the normalized CSF as follows: (2) , and . Here is where the spatial frequency in cycles/deg subtended at the retina. The conversion from frequency in cycles/in on a print viewed at distance in inches is given by . The bandpass characteristic of the CSF implies that high and low spatial frequency modulation are less noticeable than mid-frequency modulation. Based on the characteristics of scan-line by scan-line modulation, the reflectance of a scanned image with width pixels and height pixels is projected in the scan direction to obtain a 1-D reflectance profile (3) is then filtered by Mannos and The 1-D reflectance profile Sakrison’s CSF with viewing distance 12 inches, i.e.,
(4) where is the frequency index of the discrete Fourier transform (DFT), is the sampling frequency in cycles/in, is the -point DFT and is the -point inverse DFT. The standard deviation of the CSF filtered reflectance profile can be calculated as
(5) The value of characterizes the variation of the printed image, and will be used as the metric to determine the level of print quality degradation for signature embedding. To maintain print quality, the value calculated from an image with an embedded signature should not exceed the value for that same image without any embedded signature. III. INFORMATION EMBEDDING In this work, security information is embedded in the printed halftone images of continuous-tone content by modulating the laser intensity. To detect the hidden information, the printed image is captured by a scanner; and the digital image is processed with an appropriate method to be discussed later. From
Fig. 3. Example for the generation of Gold sequences of length 31.
a communication systems point of view, a printer, the data-embedded print, and a document scanner form the physical layer of a communication channel, where information can be hidden in a halftone image with a laser printer and reliably transmitted and extracted from the image captured by a document scanner. Since the data may be embedded anywhere in the page image, the decoding procedure cannot depend on knowledge of the position of the beginning of a code word with respect to the page. To retrieve the embedded code, Chiang et al. [1] proposed to embed multiple frequency banding signals and to apply the DFT to extract the embedded signals. However, since the frequency resolution of the DFT depends on the extracted data length, this approach will constrain the applicable image size and decoding performance. Moreover, the nonlinear characteristics of the printer process will introduce harmonics and visual artifacts due to frequency beating that will negatively impact decoding performance and perceived image quality. To use the communication channel analogy, a better channel codec is needed. In this work, we will exploit the properties of pseudo-random binary sequences, which are commonly used in spread-spectrum communication [36], and show that they comprise a suitable codec for extrinsic signature embedding. For conventional spread spectrum watermarking, a noise-like pseudo-random sequence with random entries chosen independently from a normal distribution with mean zero and variance one, is embedded throughout the spectrum of a digital image [43]. Both the watermark sequence and original host signal are treated as real numbers and quantized to a fixed degree of precision. The noise-like codes used for spreading have low cross correlation values and are unique to every user. Since the halftoned images are composed of dots, instead of spreading the sequence throughout the spectrum of the image, we will perturb the dot sizes according to the spreading sequence. However, the inherently noisy nature of the EP process results in fluctuation in the corresponding dot sizes. This feature means that the embedding sequence cannot be stably presented and decreases significantly the signal-to-noise ratio. To resolve this problem, pseudo-random binary sequences will be used in this work. A pseudo-random binary sequence is a bipolar sequence taking on values or with equal probability. It ideally has correlation properties that are similar to those of white noise [10], which are attractive for decoding. There are many classes of pseudo-random binary sequences that provide different set sizes and different correlation properties. The size of the set represents the number of admissible embedding sequences satisfying the required correlation properties. Higher autocorrelation value compared to the crosscorrelation value for pairs of different sequences in the set will help identify the code contained within the set. The sequence that yields the largest peak value when correlated with the embedded data
950
IEEE TRANSACTIONS ON INFORMATION FORENSICS AND SECURITY, VOL. 6, NO. 3, SEPTEMBER 2011
Fig. 4. Block diagram of system for embedding a Gold sequence code in the printed image.
TABLE I PERIOD , CORRELATION RATIO, AND NUMBER OF SEQUENCES IN THE CODE SET CORRESPONDING TO DIFFERENT LENGTHS OF THE SHIFT REGISTER
is more reliable. As the number of sequences increases, the sequence period also increases, which implies that more data is needed to represent one complete cycle of each sequence. B. Embedding Algorithm and Procedures
is the most likely embedded code. For more details regarding pseudo-random binary sequences, see [44]. A. Embedding Algorithm: Code Generation—Gold Sequence Gold sequences, one type of pseudo-random binary sequence, are of interest for this application primarily because the size of the set is large; and the periodic crosscorrelation values for each pair of sequences are relatively small compared to the sequence period , which is the maximum value of the autocorrelation. With this correlation property, one need only compute the correlation between the actual data and the candidate sequences in the code set. The most likely code sequence is the one with the largest correlation value. Gold sequences of period can be generated by two linear feedback shift registers with storage elements. Fig. 3 shows an example for . The symbol denotes XOR operation. With an initial value of 1 0 0 0 0 for both shift registers, the sequence 0000001011111100010110111101100 will be generated. This sequence of 0’s and 1’s may be readily transformed to the bipolar sequence of 1’s and ’s that is used for mathematical convenience. A more thorough discussion of Gold sequences and the method for generating them is given in [44]. The set of Gold sequences generated by two -bit registers has the following properties [10], [36]: • The length of each sequence or the period is . • There are different sequences in one code set. • The maximum autocorrelation for each sequence is equal to . • The cross-correlation value for any pair of sequences in the set belongs to the set , where denotes the integer part of . The maximum absolute value of the cross-correlation for any pair of sequences from the sequence set is ; and the maximum auto-correlation value is the sequence period . For different lengths of the shift register, Table I shows the sequence period , the ratio between the maximum cross correlation and the maximum autocorrelation, and the number of sequences in the code set. Generally, as shown in Table I, as increases, the correlation ratio decreases. Therefore, for a correlation-based detection algorithm, a longer length Gold sequence
With two -bit registers, there are sequences in the code set. Each sequence can be used to represent one message such as the printer serial number. Let the th Gold sequence code be denoted by , where , and . Fig. 4 shows the block diagram of the system for embedding the th Gold sequence code in the printed image. To embed the code sequence or codeword via the physical embedding system, a modulator maps each binary code letter to a base-band waveform, which is referred to as a chip. The sequence of chip waveforms translated from the binary code letter stream by the modulator is referred to as the base-band signal . The baseband signal is then modulated by a sinusoidal carrier to a higher frequency band to form the carrier-modulated code sequence . The carrier-modulated code sequence is then amplified to obtain the applicable laser intensity control signal . With laser intensity modulation, the code is embedded when the image is printed. A chip can consist of multiple scan-lines. The number of scan-lines in a chip is referred to as the chip duration . In general, the chip waveform can have any shape. Typically, it is a rectangular pulse [36]. One period of the base-band embedding sequence can be written as (6) is the chip waveform. where is the scan-line index and In this study, a rectangular pulse, where , and otherwise, is used. Since the length of each code sequence is and the number of scan-lines in a chip is , the total length for the base-band embedding sequence will be . For the special case where , each chip is represented by only one scan-line. In this case, the smallest number of scanlines needed to represent one complete code sequence is equal to the length of the code sequence . However, since the overall exposure at any given point on the photoconductor surface is the sum of exposures contributed from each neighboring pixel, adjacent scan-lines overlap one another by an amount that depends on the relative spot size and scan-line separation. This will limit the ability of the printer to render fine details, as is characterized by the printer’s modulation transfer function (MTF) [39]. Suppose the embedding sequence is and let the code letter be represented by the higher laser intensity (bigger dots),
CHIANG et al.: EXTRINSIC SIGNATURE EMBEDDING AND DETECTION
Fig. 5. Illustration of how the printer modulation transfer function (MTF) limits the ability to detect an extrinsic signature embedded with a very short , (b) chip duration . (a) MTF effect for sequences with chip duration . MTF effect for sequences with chip duration TABLE II NUMBER OF SCAN-LINES AND VERTICAL LENGTH NEEDED TO REPRESENT ONE COMPLETE CODE SEQUENCE AS A FUNCTION OF SHIFT REGISTER LENGTH AND CHIP DURATION FOR A 600 DPI PRINTER
951
Fig. 6. Illustration of the modulation process for the binary code sequence with chip duration 011110110100, (a) base-band embedding sequence , (b) carrier signal with frequency cycles/in and printer reso, (c) carrier modulated embedding sequence with chip lution and carrier frequency cycles/in which preserves the duration chip integrity of the base-band embedding sequence.
sinusoidal carrier signal at frequency ulated signal is given by
in cycles/in, the mod(7)
is given by (6). where the base-band embedding sequence To maintain the integrity of the base-band embedding sequence after modulation according to (7), the chip duration must be an integer multiple of the carrier period . Thus (8) and the code letter be represented by the lower laser intensity (smaller dots). Then the will not be printed clearly because of the overlap by surrounding larger dots, as illustrated in Fig. 5(a), for the case of a one pixel-wide line parallel to the process direction. To address this effect, the chip duration can be increased. For example, with can be expanded to , as shown in Fig. 5(b). With the longer chip duration, the period of the base-band embedded sequence increases to . For a code set produced by two 5-bit shift registers and a chip duration of five scan-lines/chip , at least scan-lines are needed to represent one complete code sequence. For a 600 dpi printer, this is about 0.26 inches. Table II summarizes the number of scan-lines needed to represent one complete code sequence for different shift register lengths and chip durations . Since the base-band embedding sequence consists of rectangular chips of duration , the spectrum of the corresponding continuous-parameter waveform has an envelope which is a sinc function with first zero crossing at frequency (cycles/in), where is the printer resolution in the process direction in scan-lines per inch. To exploit the reduced sensitivity of the HVS to high frequency luminance variation, it is desirable to modulate this base-band signal to higher frequencies. Using a
Note that is an integer number of scan-lines per chip. The carrier-modulated embedding sequence in (7) can thus be rewritten as follows: (9) and the Comparing (9) and (6), the base-band signal modulated signal have the same form, but with different chip wave forms—a rectangular pulse and a sinusoidal wave, respectively. Fig. 6 illustrates the modulation process for a particular binary code sequence. Fig. 6(a) shows one of the base-band embedding sequences with and . Fig. 6(b) shows the carrier signal at frequency cycles/in. Fig. 6(c) shows the carrier-modulated embedding sequence obtained by modulating the base-band embedding sequence in Fig. 6(a) with the carrier signal in Fig. 6(b). As shown in Fig. 6(c), the chips have the same polarities as the base-band embedding sequence; but the wave form is now sinusoidal. Fig. 7 shows the power spectra corresponding to these waveforms. Fig. 7(a) shows the power spectrum of the base-band sequence in Fig. 6(a). Fig. 7(b) shows the power spectrum of the modulating waveform in Fig. 6(b).
952
IEEE TRANSACTIONS ON INFORMATION FORENSICS AND SECURITY, VOL. 6, NO. 3, SEPTEMBER 2011
IV. INFORMATION EXTRACTION
Fig. 7. Spectra of signals shown in Fig. 6. (a) Spectral magnitude of base-band shown in Fig. 6(a), (b) spectral embedding sequence with chip duration magnitude of modulating waveform shown in Fig. 6(b), (c) spectral magnitude and of carrier modulated embedding sequence with chip duration cycles/in shown in Fig. 6(c). carrier frequency TABLE III FOR VARIOUS CHIP DURATIONS ADMISSIBLE CARRIER FREQUENCY WITH 600 DPI HP LASERJET 4500. HERE IS THE INTEGER NUMBER OF CYCLES OF THE CARRIER WAVEFORM CONTAINED IN THE CHIP DURATION
In the following experiments, all printed images were printed with the default halftone screen and printer resolution dpi. To detect the sequence, the printed images were scanned with a calibrated EPSON Perfection 3200 Photo flatbed scanner at resolution dpi. The scanned image is then processed and correlated with the set of embedding sequence candidates. However, not every printed document is printed with an embedded sequence. If it is not known whether or not the printed document contains an embedded sequence, the procedure is different. For a document that is known to have an embedded signature, an appropriate detection algorithm can be applied directly to detect and discriminate the embedded code. However, for a given printed image where it is not known if a signature has been embedded, a determination algorithm to decide whether or not an embedded signature is present needs to be developed. Through the determination algorithm, the unknown printed document can be determined as signature embedded or no-signature-embedded. If the document is determined as signature embedded, the same detection procedure for a document known to be signature embedded will be applied to detect the code. In this work, the embedding sequence is repeatedly embedded throughout the printed halftone image of the continuous-tone content. For Gold sequence codes, to correctly retrieve the embedded code in the image, correlation analysis between the extracted data and the entire code set will be applied. A. Detection Procedure for Images Known to Have an Embedded Signature
Fig. 7(c) shows the power spectrum of the carrier modulated sequence in Fig. 6(c). Theoretically, the carrier frequency can be as high as the Nyquist sampling frequency of the printer. However, due to the limited bandwidth of the embedding system, the achievable carrier frequency is usually lower than the ideal value depending on the specific printer. For the HP LaserJet 4500 printer used in our experiments, we determined experimentally that the maximum achievable carrier frequency is around 140 cycles/in. According to (8), Table III shows the admissible carrier frequencies for various chip durations for our experimental 600 dpi printer. As can be seen, the set of admissible frequencies is limited due to the finite resolution of the print engine and the requirement that the chip waveform contain an integer number of cycles of the carrier waveform. The carrier-modulated code sequence is then embedded into the halftoned image by modulating the laser intensity control signal given by (1) according to
For images known to have an embedded signature, Fig. 8 outlines the detection procedure. To detect and correct potential skew in the printing and/or scanning process, the scanned image with continuous-tone content is rotated by various angles starting from and increasing to with interval , where . The rotated image is then segmented into sub-images, each with pixels. Note that each sub-image needs to contain at least one period of the embedded sequence in the process direction, that is lines ( dpi). Based on experimental data that will be presented later in this section, the detection of embedded signals in highlight and shadow areas is not as accurate as it is in the midtone areas, therefore only a subset consisting of sub-images with midtone reflectance are selected, i.e., . A 1-D zero-mean signal is obtained from each sub-image by projecting it in the scan direction and subtracting the mean value as follows:
(10) where is the actual modulation amplitude, is the normalized modulation amplitude, and . In the above equation, is the nominal value for the laser intensity control signal, and and are the upper and lower bounds of the laser intensity control signal, respectively.
(11) The projection according to
is normalized to lie between
and 1
(12)
CHIANG et al.: EXTRINSIC SIGNATURE EMBEDDING AND DETECTION
953
Fig. 8. Detection procedure.
The extracted data segment is then correlated with every candidate sequence in the code set. The circular cross correlation between the th candidate sequence , where , and the extracted data segment is computed according to
(13) is treated as being periodic with period where maximum correlation over is given by
. The
within the range are calculated. The maximum vote ratio among various rotation angles and sequence candidates can be expressed as follows: (17) The angle and the sequence candidate with the maximum vote ratio are used as the deskew angle and the decoded sequence , respectively, as follows: (18) (19)
(14) denote the percent For each sequence candidate , let of the sub-images for which the maximum correlation value is greater than or equal to the maximum correlation value for every other one of the sequence candidates. Thus (15) , if where is true and if is false. We refer to as the vote percentage for sequence candidate with index . Ideally, the embedded sequence candidate will receive the maximum vote percentage. The more prominent is the vote received by the embedded sequence, the more certain it is that it will be selected during the decoding process. However, the skew of the image may decrease the energy of the embedded signal and decrease the relaibility of the decoding process. To eliminate the effect of image skew, the vote ratio of each sequence candidate is used to evaluate the prominence of the voting result for different rotation angles . The vote ratio is defined as the ratio of the difference between the vote percentage for the sequence candidate and the average vote percentage of the other sequence candidates, to the standard deviation of the vote percentages of the other sequence candidates. (16)
To search for the deskew angle with the most prominent vote result, the vote ratios for all values of with interval
In this work, we assume that only one code is embedded. If there is more than one sequence with the maximum vote ratio , the code cannot be uniquely decoded, and will be considered as incorrectly decoded. To examine the computational complexity of the detection procedure, we break it into four steps, and compute estimates of the number of operations for each step. These are: (1) generation of rotations to optimally deskew the scanned images , (2) computation of projections and mean sub-image values (11), (12) , (3) computation of correlations (13) , and (4) selection of optimal deskew angle and detected sequence index (14)–(19) . Here is the number of different deskew angles tested, and and are the height and width of the complete scanned image. The values chosen for the embedding parameters: modulation amplitude , chip duration , and carrier frequency will affect the detection performance. To ensure that the signature would be detectable without image quality degradation, some preliminary experiments with uniform mid-tone test pages were conducted to select the values of these parameters. The detection performance with general printed images containing fine details was then evaluated. 1) Preliminary Experiment—Selection of Embedding Parameters: It is well known that the banding artifact is more visible in mid-tone areas compared to highlight and shadow areas. This phenomenon is also reflected in terms of the image quality degradation as computed by (5). Fig. 9 shows the measured image quality degradation for 0.5 9.55 inch constant images with various reflectance values embedded with the sequence using chip duration lines/chip, carrier frequency cycles/in, and normalized modulation amplitude , 0.15, and 0.2 volts, respectively. The image quality degradation is largest in mid-tone areas. If the image
954
IEEE TRANSACTIONS ON INFORMATION FORENSICS AND SECURITY, VOL. 6, NO. 3, SEPTEMBER 2011
Fig. 11. (a) Printed and scanned image of a 1.25 1.25 inches uniform image with reflectance 0.3 without any modulation, (b) Printed and scanned image of a 1.25 1.25 inches uniform image with reusing parameter values flectance 0.3 embedded with sequence , (b) Printed and scanned image of the 1.25 1.25 inches uniform image with reflectance using parameter values (1 0.3 embedded with sequence volt, 10 lines/chip, 120 cycles/in).
Fig. 9. Image quality degradation (see (5)) for constant images with various using chip duration , carrier reflectances embedded with sequence cycles/in, and normalized modulation amplitude , frequency 0.15, and 0.2 volts, respectively.
Fig. 10. Image quality degradation (see (5)) for uniform images with reusing different values for chip flectance 0.3 embedded with the sequence , and normalized modulation amplitude . duration , carrier frequency The dashed line indicates the standard deviation for an image with uniform reflectance 0.3 that contained no embedded signal.
quality with an extrinsic signature embedded in mid-tone areas is preserved, then the quality of the whole image will be preserved. The values are chosen to preserve image quality while maintaining high detection performance. To select the values , a 0.5 9.55 inch uniform test page with reflectance was used. The arbitrarily selected 5-bit ( Gold sequence was embedded using all the values listed in Table III with modulation amplitude varying from 0.025 to 0.1 volts with interval 0.025 volts. The printed images were scanned and cropped to 150 5518 pixels . The corresponding image quality degradation (5) of the scanned images corresponding to the different values of the embedding parameters were calculated and are shown in Fig. 10. As can be seen in Fig. 10, for each fixed pair , a higher modulation amplitude
results in a higher standard deviation , while a higher carrier frequency reduces the value of . The mean value of for images with no embedded signal was also measured, and is indicated by a dashed line. If the image is modulated with the embedding signal to a level such that the standard deviation of the image with the embedded signal does not exceed the standard deviation of the image without any embedded signal, then the quality of the image with embedding is deemed to be no worse than that of the image without embedding. In particular, for lines/chip, 120 cycles/inch) and modulation voltage volts, the values are all below the value for the image without embedding. Fig. 11(a) shows the printed and scanned image of the 1.25 1.25 inch uniform image with reflectance 0.3 without any modulation. Figs. 11(b) and (c) show the printed and scanned image of the 1.25 1.25 inch uniform image with reflectance 0.3 embedded with sequence using parameter values and (1 volt, 10 lines/chip, 120 cycles/in), respectively. As can be seen in Fig. 11, there is no visible degradation of image quality when the modulation amplitude volts. But when the modulation amplitude volt, the coded message results in visible banding, and significantly degrades the image quality. The scanned images were then divided into sub-images with pixels, where pixels and pixels depending on the selection of the embedding parameters . Since the sub-images did not overlap, there were 35, 29, 22, and 17 sub-images for , 6, 8, and 10, respectively. To correct the skew, the scanned image is rotated by various angles starting from degrees and increasing to 0.12 degrees with interval 0.01 degrees. For each set of embedding parameters, the vote ratio for the embedding sequence with the corresponding deskew angle (16) is shown in Fig. 12. The average value of the skew correction angle for the scanned images is 0.06 degree with standard deviation 0.01. Fig. 12 shows that the vote ratio increases as the modulation amplitude increases, and decreases as the carrier frequency increases. The vote ratio for some sets of embedding parameters reaches infinity. This is because the embedding sequence received all the votes, and the standard deviations of the vote percentages of the other sequence candidates became zero (see
CHIANG et al.: EXTRINSIC SIGNATURE EMBEDDING AND DETECTION
Fig. 12. Received vote ratio of sequence embedded in a uniform image with reflectance 0.3 as a function of chip duration , carrier frequency , and normalized modulation amplitude . The average value for the skew is 0.06 degrees with standard deviation 0.01 degrees. correction angle
Fig. 13. Vote ratios of all 33 sequence candidates when is embedded in a uniform image with reflectance 0.3 using the parameter . values
(16)). For these sets of parameters, the voting result is prominant; but the image quality is degraded as shown in Fig. 10. Among those sets of parameter values that according to Fig. 10 preserve the image quality, choosing (10 lines/chip, 120 cycles/in) and volts yields the largest vote ratio for the embedded code . Fig. 13 shows the vote ratio for all 33 sequence candidates for this set of parameter values. To be elected from the voting result as the decoded sequence, the vote ratio of the sequence candidate has to be no less than 1. In Fig. 13, none of the 33 sequences other than received a vote ratio larger than 1. To investigate the vote ratios of the embedding sequence for different reflectance values and sub-image widths , a 5.83 8.87 inch uniform test page with reflectance was used. The vote ratios corresponding to different sub-image widths for different uniform reflectance images embedded with using were measured, and are shown in Fig. 14. Here, the scanned images were divided to sub-images with width , 300, 450 and 600 pixels, respectively, and height pixels. As seen in Fig. 14, the vote ratio tends to increase when the sub-image width increases. However, the increase rolls off when the sub-image width is greater than 450 pixels. For the values of greater than
955
Fig. 14. Vote ratios as a function of reflectance and sub-image width for the sequence embedded in constant-reflectance images using the pa, rameter values pixels, processed by dividing the scanned images into sub-images with , 300, 450 and 600 pixels, respectively and where pixels.
300 pixels, the vote ratios for reflectance between 0.10 and 0.65 are higher than 5, which is relatively high, compared with the vote ratio of 1 that would be associated with an uncorrelated noise sequence. This indicates that with and a sufficiently large sub-image width , the embedded signatures will not degrade the image quality while maintaining a relatively high vote ratio (high detection rate) in mid-tone areas. This set of embedding parameters, sub-image width pixels, and range of pixel reflectance values were used to investigate the detection performance for general grayscale images in the next sub-section. In this work, one arbitrarily selected sequence was used to determine the values for the embedding parameters. Since each element in the Gold sequence takes on values or with equal probability and is relatively uncorrelated with the value of any other elements, the image quality degradation resulting from all sequences should, in principle, be nearly the same. In addition, the maximum absolute value of the crosscorrelation for any pair of sequences from the sequence set is identical. Therefore, the detection performance is same as any other pairs from the same set. That means that the image quality degradation and detection performance of selected sequences can be representative of the results that would be obtained with other sequences from the same sequence set. Accordingly, only three arbitrarily selected sequences were used to evaluate the detection performance. 2) Experiment-Code Detection Performance for General Grayscale Images: Using the parameter values determined in the previous subsection, we evaluated the performance of our embedding scheme with a set of ten different general grayscale images that had a range of contents. The results are shown in Table IV. We see that, overall, our embedding method performs quite well. Fig. 15 shows 600 dpi scans of one of the images in our test set with and without an embedded signature including a zoomed-in area of the smooth sky region. As expected, there is no apparent difference in the quality of these two images. Here, we revisit the computational complexity analysis presented earlier in this section using the chosen parameter values and image statistics from Table IV. Our estimates are: (1) , (2) ,
956
IEEE TRANSACTIONS ON INFORMATION FORENSICS AND SECURITY, VOL. 6, NO. 3, SEPTEMBER 2011
TABLE IV DECODING ACCURACY FOR A SET OF TEN GENERAL GRAYSCALE IMAGES. THE TABLE SHOWS THE SIZE OF THE TEST IMAGES, THE MEAN NUMBER OF ADOPTED SUB-IMAGES WITH SIZE 450 310 PIXELS ON EACH OF THE 30 TEST PAGES, AND THE FRACTION OF THE 30 TEST PAGES THAT WERE CORRECTLY DECODED FOR EACH OF THE TEST IMAGES
TABLE V EFFECT OF SCANNER RESOLUTION ON DETECTION PERFORMANCE: MAXIMUM VOTE RATIOS OF THE TEST IMAGE BIRD EMBEDDED WITH SEQUENCE USING PARAMETER VALUES CORRESPONDING TO SCAN RESOLUTIONS OF 600, 1200, AND 1800 DPI, RESPECTIVELY Fig. 15. (a) Printed and scanned image of Lighthouse embedded using parameter values with sequence , (b) Magnified portion of (a) indicated by box, (c) Printed and scanned image of Lighthouse without any modulation, (d) Magnified portion of (c) indicated by box. Note that the smooth areas of both images show grain, banding, and streaking artifacts that are typical for this printer [45], [46].
(3)
, (4) . The total computation is . With a quad core Intel i7 CPU running at a 2.67 GHz clock speed, the average time to analyze each of the images in Table IV was 5.72 min. It is also of interest to determine the impact on detection performance of the resolution at which the printed signature-embedded document is scanned. For this investigation, we embedded one sequence in one image (Bird) and printed this page. We then scanned this page at three different resolutions and computed the maximum vote ratio . As can be seen in Table V, increases with increasing scanner resolution. So we would expect an improvement in detection performance at higher scanning resolutions. B. Determination Procedure for Unknown Images For unknown images, an additional test needs to be performed to determine whether or not an embedded signal is present. For images with no embedded signal, the extracted data should be
uncorrelated to any of the sequence candidates, and the vote ratio should be low. Conversely, for images with an embedded signal, the extracted data is likely to be correlated to an embedded code, and the vote ratio should be high. By comparing the vote ratios with the vote ratio threshold that is a value between the minimum and maximum vote ratios for images with and without an embedded signal, respectively, it can be determined whether or not the image contains an embedded signal. The details for this procedure can be found in [47]. In this work, the same test images listed in Table IV were used to evaluate the discrimination performance, and the results are shown in Table VI. These data are based on printing 30 pages containing each image with an embedded signature and printing 30 pages of each image without an embedded signal. As was the case with the performance of the decoding algorithm (see Table IV), Table VI shows that the procedure for detecting whether or not a signature has been embedded performs better for Lighthouse, Bird, Apple, and Bird than for Portrait, Beach and Mountain. This is because the mid-tone regions of the images in the second group are not as flat as the mid-tone regions of the images in the first group. Thus, we conclude that the proposed embedding and detection algorithms work better on images with more uniform mid-tone areas.
CHIANG et al.: EXTRINSIC SIGNATURE EMBEDDING AND DETECTION
TABLE VI HIT RATE (THE RATE OF CORRECTLY INTERPRETING A PAGE AS CONTAINING AN EMBEDDED SIGNAL) AND FALSE ALARM RATE (THE RATE OF INCORRECTLY INTERPRETING A PAGE AS CONTAINING AN EMBEDDED SIGNATURE) FOR TEST IMAGES LISTED ON TABLE IV WITH AND WITHOUT AN EMBEDDED SIGNATURE
V. ANTIFORENSICS To evaluate the anti-forensic aspects of our external signature embedding method, we first consider several possible attack objectives. Then we examine how these objectives could be achieved at the different points in the signature embedding process shown in Fig. 1. Not all the attack objectives would necessarily make sense for the application scenario that was discussed in Section I. The attack objectives that we consider are: (1) Make a copy of the signature-embedded paper document using an ordinary copier, or by scanning the paper document and reprinting it with an arbitrary printer. (2) Generate a document in which the visible content is altered; but the signature is not altered. (3) Generate a document in which the visible content is not altered; but the signature is altered. This case could include insertion of a signature where none existed previously, or removal of a signature; so that the document appears to not have been signature-embedded. These attacks could be directed at three different points in the signature embedding process shown in Fig. 1: (1) the application that generates the visible content of the digital document, and passes the signature to be embedded to the marking engine, (2) the marking engine that performs the signature-embedding, and (3) the printed document that contains the visible content and embedded signature. For this third point of attack, it is interesting to note that many of the attacks that are valid for a watermarked digital image, such as a marking or cropping attack, do not make sense with a physical document. Generally speaking, the printed document will be robust to most forms of attack because physical alterations to it, such as human marking, cutting, or pasting would be visible. On the other hand, the physical document may be susceptible to a scan-print attack as discussed below. Let us start with first attack objective—the copy or scanprint attack. Since this is a simple type of attack that almost anyone can do, we conducted two experiments to evaluate the susceptibility of our method to it. First, we made copies of 30 printed, signature-embedded pages containing the image Bird using a Canon imageRUNNER 5055 (600 600 dpi scanner/ 1200 1200 dpi printer) under Photo mode and Text mode, respectively. Then we scanned those copies at resolution 600 dpi to perform the signature extraction. The measured correct detection rates for these copies are shown in Table VII. For our second test, we printed the scanned pages obtained in Section IV-A.2 with another printer (HP LaserJet 1300) at 600 dpi resolution.
957
TABLE VII CORRECT DETECTION RATES FOR BIRD UNDER COPY ATTACK AND SCAN-PRINT ATTACK. HERE THE COPIER WAS OPERATED UNDER PHOTO MODE AND TEXT MODE, RESPECTIVELY; AND THE PRINTER IS OPERATED UNDER DEFAULT SETTINGS
The images were printed with a HP 2613 A toner cartridge using the HP universal print driver for Windows PCL6 (version 5.2.5.9108) with default settings. These printed pages were then scanned at resolution 600 dpi. The correct detection rates for these printed pages are also shown in Table VII. As seen from Table VII, the correct detection rate for images copied under Text mode are lower than those copied under Photo mode. This is because the images copied under Text mode are darker, and have lower image quality than those copied under Photo mode. For those pages scanned and printed by another printer, the correct detection rate is zero. Here, the failure to be able to correctly detect the embedded signature appears to be due to some aspect of how the original halftone pattern in the scanned image was re-rendered by the imaging pipeline of the driver and printer. We conclude from these two small experiments that it is indeed possible to successfully attack our embedding method with a copy or scan-print attack, but the attack will not always succeed. However, in many use-cases, being able to copy the document with the embedded signature may not be an issue. For example, in the scenario discussed in Section I, the user prints the document and goes to the point of fulfillment. Here the paper document is scanned to verify that the user is entitled to the item or service that has been purchased. However, this transaction takes place in a trusted domain. The fact that it has already occurred can be recorded in a back-end database, thereby nullifying further instances of this particular document with its particular embedded signature. The second attack—altering the visible content, could be attempted by creating a digital image of the digital document to be printed, altering some part of its visible content, and then printing it. However, since the subsequent printing would not be performed from within the application that created the document, the embedded signature would presumably be missing. The second attack could be successfully performed by hacking into the application that generates the document to be printed. Another way to carry out this type of attack would be to scan the properly printed document, digitally alter it in such a way that the embedded signature is preserved, and reprint the altered document with an ordinary printer. As discussed above in the context of the copy or print-scan attack, this attack could succeed, presuming that the visible area that was altered did not contain the embedded signature. If the altered area did contain the embedded signature, the attacker would have to successfully extract the signature, and re-insert it in the continuous-tone image as a modulation of its digital gray-value. The third attack—altering the embedded signature seems more difficult. It would require hacking into the application
958
IEEE TRANSACTIONS ON INFORMATION FORENSICS AND SECURITY, VOL. 6, NO. 3, SEPTEMBER 2011
that creates the document, or the laser intensity modulation circuit in the marking engine. The fact that the signature would be presumed to be encrypted, might also interfere with this type of attack. A scan-print attack might enable an attacker to transfer the embedded signature from one document to another one; but creation of a new signature at this attack point seems very difficult. Even transfer of an existing signature is complicated by the fact that the image content within which the signature is embedded would also have to be transferred to the new document. The exception, as discussed above, would be to extract the embedded signature from the scanned paper document, and reinsert it in a continuous-tone image. Finally, we note that security of the printed document is not an issue for many scenarios in which our external signature embedding scheme could be deployed. For example, in printed marketing or informational content, the signature could serve as bridge to electronic media. Capturing and analyzing the printed page with a scanner or a smartphone camera could take the user to a Web page with additional information about a product or service. VI. CONCLUSION We have demonstrated the feasibility to embed and extract extrinsic signatures into halftoned images at the printer mechanism level with a laser electrophotographic printer without degrading image quality. By embedding the signature at the printer mechanism level rather than in the electronic document itself, the overall system becomes more resistant to tampering. Exploiting properties of PN sequences, no a priori information about the original image is required. Nor is synchronization needed during decoding. Repeatedly embedding the same code sequence throughout the image can avoid a marking or cropping attack at the expense of reduced payload capacity. To increase the capacity, the image can be divided into row images with height higher than the sequence length, and each row image can be embedded with a different sequence. To decode each embedded sequence, each row image obtained from the partitioning of the scanned image is processed separately according to the procedures described in Section IV. Since each row image is decoded as an individual image, the search for the optimal deskew angle and corresponding maximum vote ratio is also processed independently and does not affect the detection performance of other row images. In our experiments, we have shown that 10 bits per inch can be embedded in the cross-scan direction. In principle, this capacity can be further increased by changing the embedded signature in the scan direction. But due to limitations in our hardware for laser amplitude modulation, we did not explore this option. REFERENCES [1] P.-J. Chiang, N. Khanna, A. K. Mikkilineni, M. V. O. Segovia, S. Suh, J. P. Allebach, G. T.-C. Chiu, and E. J. Delp, “Printer and scanner forensics—Examining the security mechanisms for a unique interface,” IEEE Signal Process. Mag., vol. 26, no. 2, pp. 72–83, Mar. 2009. [2] P.-J. Chiang, N. Khanna, A. K. Mikkilineni, M. V. O. Segovia, J. P. Allebach, G. T.-C. Chiu, and E. J. Delp, “Printer and Scanner Forensics: Models and Methods,” in Intelligent Multimedia Analysis for Security Applications. Berlin, Germany: Springer-Verlag, 2010, pp. 145–187.
[3] S. J. Simske, S. B. Pollard, and G. B. Adams, “An imaging system for simultaneous inspection, authentication and forensics,” in Proc. 2010 IEEE Int. Conf. Imaging Systems Techniques (IST), Thessaloniki, Greece, July 2010, pp. 266–269. [4] E. Kee and H. Farid, “Printer profiling for forensics and ballistics,” in Proc. 10th ACM Workshop on Multimedia and Security, Oxford, UK, 2008, pp. 3–9. [5] H. Gou and M. Wu, “Data hiding in curves with application to fingerprinting maps,” IEEE Trans. Signal Process., vol. 53, no. 10 II, pp. 3988–4005, 2005. [6] J. T. Brassil, S. Low, and N. F. Maxemchuk, “Copyright protection for the electronic distribution of text documents,” in Proc. IEEE, July 1999, vol. 87, no. 7, pp. 1181–1196. [7] A. K. Mikkilineni, G. T. C. Chiu, J. P. Allebach, and E. J. Delp, “Highcapacity data hiding in text documents,” in Proc. SPIE Int. Conf. Security, Steganography, and Watermarking of Multimedia Contents XI, San Jose, CA, 2009, vol. 7254, pp. 72 540X-72–540X-10. [8] M. V. O. Segovia, G. T.-C. Chiu, and J. P. Allebach, “Using forms for information hiding and coding in electrophotographic documents,” in Proc. 1st IEEE Int. Workshop Inf. Forensics Security, London, U.K., Dec. 2009, pp. 6–9. [9] M. Barni, C. Podilchuk, F. Bartolini, and E. Delp, “Watermark embedding: Hiding a signal within a cover image,” IEEE Commun. Mag., vol. 39, no. 8, pp. 102–108, Aug. 2001. [10] M. Barni and F. Bartolini, Watermarking Systems Engineering: Enabling Digital Assets Security and Other Applications. New York: Marcel Dekker, 2004. [11] X. Zhao and A. T. S. Ho, “An Introduction to Robust Transform Based Image Watermarking Techniques,” in Intelligent Multimedia Analysis for Security Applications. New York: Springer-Verlag, 2010, pp. 337–364. [12] A. D. Ángelo, G. Cancelli, and M. Barni, “Watermark-Based Authentication,” in Intelligent Multimedia Analysis for Security Applications. New York: Springer-Verlag, 2010, pp. 365–402. [13] Z. Baharav and D. Shaked, “Watermarking of dither halftoned images,” in Proc. SPIE, 1999, vol. 3657, pp. 307–316. [14] H. Z. Hel-Or, “Watermarking and copyright labeling of printed images,” J. Electron. Imag., vol. 10, no. 3, pp. 794–803, July 2001. [15] M. S. Fu and O. C. Au, “Data hiding watermarking for halftone images,” IEEE Trans. Image Process., vol. 11, no. 4, pp. 477–484, Apr. 2002. [16] D. Kacker and J. Allebach, “Joint halftoning and watermarking,” IEEE Trans. Signal Process., vol. 51, no. 4, pp. 1054–1068, Apr. 2003. [17] M. S. Fu and O. C. Au, “Steganography in halftone images: Conjugate error diffusion,” Signal Processing, vol. 83, no. 10, pp. 2171–2178, 2003. [18] Z. Fan, “Information embedding using two-layer conjugate screening,” in Proc. SPIE, 2004, vol. 5310, no. 1, pp. 170–175. [19] S.-K. Yip, O. C. Au, C.-W. Ho, and H.-M. Wong, “Pi-preserve data hiding for halftone image,” in Proc. ISPACS 2005, Hong Kong, Dec. 2005, vol. 2005, pp. 125–128. [20] J.-M. Guo, S.-C. Pei, and H. Lee, “Watermarking in halftone images with parity-matched error diffusion,” in Proc. 2005 IEEE Int. Conf. Acoustics, Speech, and Signal Processing, Piscataway, NJ, 2005, vol. 2, pp. 825–828. [21] N. Damera-Venkata, J. Yen, V. Monga, and B. L. Evans, “Hardcopy image barcodes via block-error diffusion,” IEEE Trans. Image Process., vol. 14, no. 12, pp. 1977–1989, Dec. 2005. [22] S.-C. Pei and J.-M. Guo, “Novel data hiding and blind decoding in dithering halftone images,” in Proc, 5th Int. Conf. Inf., Commun. Signal Process., Bangkok, Thailand, 2005, vol. 2005, pp. 1006–1009. [23] B. Oztan and G. Sharma, “Continuous phase modulated halftones and their application to halftone data embedding,” in Proc. IEEE Int. Conf. Acoustics, Speech, and Signal Processing, Toulouse, France, May 2006, vol. 2, pp. II333–II336. [24] A. M. Attar, O. Taheri, S. Sadri, and R. A. Fattahi, “Data hiding in halftone images using error diffusion halftoning with adaptive thresholding,” in Proc. Can. Conf. Electrical Computer Engineering, CCECE’06, Ottawa, ON, Canada, 2007, pp. 2029–2032. [25] S. Suh, J. P. Allebach, G. T.-C. Chiu, and E. J. Delp, “Printer mechanismlevel information embedding and extraction for halftone documents: New results,” in Proc. IS&T’s NIP23: Int. Conf. Digital Printing Technologies, Anchorage, AK, Sept. 2007, pp. 549–553. [26] B. Oztan and G. Sharma, “Clustered-dot color halftone watermarks,” in Proc. SPIE Int. Conf. Color Imaging XV: Displaying, Processing, Hardcopy, and Applications, Portland, OR, 2008, pp. 99–104.
CHIANG et al.: EXTRINSIC SIGNATURE EMBEDDING AND DETECTION
[27] V. Shah, “Embedding and detecting machine readable data in images printed by electrophotographic printer,” Master’s thesis, Electrical and Computer Engineering, Purdue University, West Lafayette, IN, 2008. [28] O. Bulan, G. Sharma, and V. Monga, “Orientation modulation for data hiding in clustered-dot halftone prints,” IEEE Trans. Image Process., vol. 19, no. 8, pp. 2070–2084, Aug. 2010. [29] R. Ulichney, M. Gaubatz, and S. Simske, “Encoding Information in Clustered-Dot Halftones,” HP Laboratories Technical Report, no. 136, 2010. [30] S. G. W. C. Haines and K. Knox, “Digital Color Halftones,” in Digital Color Imaging Handbook. Boca Raton, FL: CRC Press, 2002, pp. 385–490. [31] D. E. Knuth, “Digital halftones by dot diffusion.,” ACM Trans. Graph., vol. 6, no. 4, pp. 245–273, Oct. 1987. [32] M. Mese and P. Vaidyanathan, “Optimized halftoning using dot diffusion and methods for inverse halftoning,” IEEE Trans. Image Process., vol. 9, no. 4, pp. 691–709, Apr. 2000. [33] C. Lee and J. P. Allebach, “The hybrid screen—improving the breed,” IEEE Trans. Image Process., vol. 19, no. 2, pp. 435–450, Feb. 2010. [34] Z. He and C. A. Bouman, “AM/FM halftoning: Digital halftoning through simultaneous modulation of dot size and dot density,” J. Electron. Imag., vol. 13, no. 2, pp. 286–302, 2004. [35] D. Kacker, T. Camis, and J. P. Allebach, “Electrophotographic process embedded in direct binary search,” IEEE Trans. Image Process., vol. 11, no. 2, pp. 234–257, Feb. 2002. [36] M. B. Pursley, Introduction to Digital Communications. New York: Pearson Education, Inc., 2005. [37] M. Barni and F. Bartolini, Watermarking Systems Engineering: Enabling Digital Assets Security and Other Applications. New York: Marcel Dekker, 2004. [38] L. B. Schein, Electrophotography and Development Physics. Morgan Hill, CA: Laplacian Press, 1996. [39] E. M. Williams, The Physics and Technology of Xerographic Processes. New York: Wiley, 1984. [40] J. L. Mannos and D. J. Sakrison, “The effects of a visual fidelity criterion on the encoding of images,” IEEE Trans. Inf. Theory, vol. 20, pp. 525–536, Jul. 1974. [41] F. W. Campbell, R. H. S. Carpenter, and J. Z. Levinson, “Visibility of aperiodic patterns compared with that of sinusoidal gratings,” J. Physiol., vol. 204, pp. 283–298, 1969. [42] P. G. J. Barten, “Physical model for the contrast sensitivity of the human eye,” in Proc. SPIE, San Jose, CA, Feb. 1992, vol. 1666, pp. 57–72. [43] I. J. Cox, J. Kilian, F. Leighton, and T. Shamoon, “Secure spread spectrum watermarking for multimedia,” IEEE Trans. Image Process., vol. 6, no. 12, pp. 1673–1687, 1997. [44] D. V. Sarwate and M. B. Pursley, “Crosscorrelation properties of pseudorandom and related sequences,” Proc. IEEE, vol. 68, no. 5, pp. 593–619, May 1980. [45] W. Jang and J. Allebach, “Simulation of print quality defects,” J. Imaging Science Technol., vol. 49, no. 1, pp. 1–18, Jan./Feb. 2005. [46] N. Burningham, Z. Pizlo, and J. P. Allebach, , J. P. Hornak, Ed., “Image Quality Metrics,” in Encyclopedia of Imaging Science and Technology. New York: Wiley, 2002, pp. 598–616, iSBN 0-471-33276-3. [47] P.-J. Chiang, “Extrinsic signatures embedding and detection in electrophotographic halftoned images through exposure modulation,” Ph.D. dissertation, Mechanical Engineering, Purdue University, West Lafayette, NJ, 2009.
959
Pei-Ju Chiang received the B.S. degree in mechanical and marine engineering from National Taiwan Ocean University, Taiwan, in 1999, and the M.S. degree in mechanical engineering from National Central University, Taiwan, in 2001. She received the Ph.D. degrees in mechanical engineering from Purdue University, West Lafayette, IN, in 2009. Since 2010, she has been an Assistant Professor with the Department of Mechanical Engineering, National Chung Cheng University, Taiwan. Her research interests include image processing, printer forensics, and print image quality analysis. Dr. Chang is a member of IS&T and ASME.
Jan P. Allebach (F’03) is Hewlett-Packard Distinguished Professor of Electrical and Computer Engineering at Purdue University. His current research interests include image rendering, image quality, color imaging and color measurement, printer forensics, and digital publishing. Prof. Allebach is a Fellow of the IEEE, the Society for Imaging Science and Technology (IS&T), and SPIE. He has served as Distinguished or Visiting Lecturer for both IS&T and the IEEE Signal Processing Society. Allebach received the Senior (best paper) Award from the IEEE Signal Processing Society, the Bowman Award from IS&T, was named Electronic Imaging Scientist of the Year by IS&T and SPIE, and was named Honorary Member of IS&T, the highest award that IS&T bestows. From Purdue University, he has received six teaching awards, and separate awards for team leadership, mentoring, and research.
George T.-C. Chiu received the B.S. degree in mechanical engineering from the National Taiwan University, Taiwan, in 1985 and the M.S. and Ph.D. degrees in mechanical engineering from the University of California at Berkeley, in 1990 and 1994, respectively. He is a Professor in the School of Mechanical Engineering with a courtesy appointment in the School of Electrical and Computer Engineering at Purdue University, West Lafayette, IN. Before joining Purdue in 1996, he was an R&D engineer at the Hewlett-Packard Company developing high performance color inkjet printers and multi-function machines. Dr. Chiu’s current research interests are mechatronics and dynamic systems and control with applications to digital printing and imaging systems, digital fabrications, motion and vibration control and perception, and human motor control. He has authored and co-authored more than 140 journal and refereed conference papers and is the co-inventor of 3 US patents and 4 international patent applications. Dr. Chiu is the co-recipient of the 2010 IEEE TRANSACTIONS ON CONTROL SYSTEM TECHNOLOGY Outstanding Paper Award and the Purdue College of Engineering 2010 Faculty Engagement/Service Award. Professor Chiu is the Editor Elect for the Journal of Imaging Science and Technology and an Associate Editor for the Journal of Electronic Imaging, the IFAC Journal of Control Engineering Practice. He also serves on the Editorial Board of the Frontier of Mechanical Engineering journal. Dr. Chiu is an Executive Committee member of the ASME Dynamic Systems and Control Division (DSCD). He is a fellow of IS&T and a member of IEEE and ASME.