controlled quasi-periodic signature into a document. Based on the system ..... International Conference on Digital Printing Technologies,. Salt Lake City, UT, ...
Extrinsic Signatures Embedding Using Exposure Modulation for Information Hiding and Secure Printing in Electrophotography Pei-Ju Chiang2, Gazi N. Ali1, Aravind K. Mikkilineni1, Edward J. Delp1, Jan P. Allebach1, and George T.-C. Chiu2 1 School of Electrical and Computer Engineering 2 School of Mechanical Engineering Purdue University West Lafayette, Indiana Abstract Banding is one of the image artifacts for electrophotographic (EP) printers. Due to its origin within the EP process, it can also be viewed as an intrinsic signature of the specific printer. Modulating the EP process to generate banding signals that are below the human visual threshold but can be detected by effective detection approach can further extend the signature capacity. This deliberate banding signal can be viewed as extrinsic signature of a printer. Since modulating the printing process provides significant barrier of entry, it is effective in limiting the attack possibilities and can be an effective method to embed needed information regarding the document and the device it was printed on to provide unprecedented forensic information. One of the key issues with embedding extrinsic signature is the information should not be detectable by the human observer. However, the signature needs to be detectable by a suitable detection algorithm. In this paper, we will propose one method to modulate the exposure of the EP process to embed controlled quasi-periodic signature into a document. Based on the system level modeling and experimental verification of the EP process, machine detectable signatures that are below the human visual threshold can be embedded into a printed document without any perceivable degradation in image quality. Preliminary experiment results confirm our hypothesis that with properly designed control techniques, effective extrinsic signatures can be embedded into a document.
Introduction Printed material is a direct accessory to many criminal and terrorist acts. Examples include forgery or alteration of documents used for purposes of identity, security, or recording transactions. In addition, printed material may be used in the course of conducting illicit or terrorist activities.
Examples include instruction manuals, team rosters, meeting notes, and correspondence. In both cases, the ability to identify the device or type of device used to print the material in question would provide a valuable aid for law enforcement and intelligence agencies. We are developing two strategies for printer identification. The first one is passive. It involves tracing the intrinsic features in the printed output that are characteristic of that particular printer, model, or manufacturer’s products. We called this intrinsic signature [1]. The second strategy is active. This involves modulating the process parameters in the printer mechanism to encode identification information such as the printer’s serial number and date of printing. We called this the extrinsic signature. As a signature for a printer, depending on the purpose for embedding the signature, it sometimes needs to be fragile where any deviation from the legitimate process will destroy the signature or it needs to be robust where the signature will be difficult to be altered or removed. The advantages of exploiting modulating the EP process as potential signature lies in the high barrier of entry for possible attack scenarios [2]. The main concept of extrinsic signature embedding is to create machine measurable image features/signatures that cannot be perceived by the human visual system. Banding is one of the well documented artifacts for EP printers. Due to its origin within the EP process, it can also be viewed as an intrinsic signature of the specific printer. During the past few years, many active banding reduction works have successfully demonstrated methods to reduce banding artifacts by modulating various process parameters such as: 1. Laser intensity/ timing/ pulse width [3] 2. Motor control [4] 3. Laser beam steering [5] These methods can also be used to inject properly designed banding signatures into the process. In addition, modulating these process parameters involves technology understanding and capability that are not easily obtained.
One of the key issues with embedding extrinsic signature is the information should not be detectable by the human observer but needs to be detectable by suitable detection algorithms [6][7][8]. To accomplish this, we will exploit the band-pass characteristics of the human visual system to contrast variations. It will be desirable to inject banding signals in the high spatial frequency region, where the human visual system has relative low contrast sensitivity. Among the methods shown above, motor control will have difficulty to affect the EP process at high spatial frequencies due to the inherent electro-mechanical limitations. Steering laser beam requires additional process capability that is not found in typical EP engines. However, modulating various laser parameters to affect exposure is common practice in typical EP process control. In this paper, we will show that by modulating the exposure of the EP process and exploiting the reduced contrast sensitivity of the human visual system at higher spatial frequencies, unperceivable banding signatures of different frequency and amplitude can be embedded into an image and reliably detected. An HP color laserjet 4500 is used as the experimental platform for this study. Although a color engine is used as the experimental system, we will be focusing on monochrome result for this study. The remaining of the paper is organized as follows. The methods for embedding unperceivable banding signals into the image will be discussed in the next section followed by the presentation of the corresponding experimental results. The summary and conclusion are given in the last section.
Method for Embedding Extrinsic Signature Figure 1. shows basic process block diagram of embedding banding signals by modulating the laser intensity in an EP process. One should note that to maintain process stability, there is only a limit range of the laser intensity that can be used for signature embedding. Figure 2 illustrates the process to embed and detect extrinsic banding signals used in this study. After embedding banding signal into a printed image, the image will be scanned and the resulting 2D reflectance data is projected onto the process direction to form an 1D reflectance signal. FFT will be performed on the projected reflectance signal to detect the frequency contents. It should also be noted that other image analysis algorithms as described in [6][7][8] are available for extracting the frequency as well as the amplitude content of the embedded banding signature. Note also that the subsequent discussion focuses on halftone images. For text and line drawings, more sophisticated detection algorithms are needed.
Figure 1 Process block diagram for embedding extrinsic banding signature using laser intensity modulation
Figure 2 Embedding and detecting extrinsic banding signal
A. Laser Beam Intensity Modulation The intensity profile of the laser beam is modeled as a 2-D Gaussian envelope [9][10], which is given by I ( x, y, t ) = I 0 (t )e
(−
y2 2α
2
−
x2 2β 2
)
W/m2,
(1)
where I 0 (t ) represents the beam power amplitude of the laser, and α and β are the beam widths in the scan, x, and process, y, directions, respectively. Assume the laser is switched on at time 0 and off at time toff and the rise and fall transition are modeled as an exponential function, see Figure 3. Then the beam power amplitude can be expressed as t < 0, 0, t − 0 ≤ t ≤ toff , I 0 (t ) = I max (1 − e tr ), −(t −toff ) toff − tf tr I )⋅e , t > toff , max (1 − e
Figure 3 Laser power profile
(2)
Let the nominal values of the printed pixel width in the scan direction and process direction be X and Y, respectively. Assume the laser beam translates along the scan direction, x, at a velocity V which is extremely high compared with the motion of the photoconductor surface. Then the exposure energy at any arbitrary point (x, y) due to the pixel [m, n] being turned on is found by integrating Eq. (2) with respect to time, i.e.
input voltages. Note that the selection of available dot size modulations will also depend on the detection algorithm.
Emn ( x, y ) = ( y − yn ) 2 2α
2
−
( x − ( xm − X / 2) − Vt ) 2 2β
2
)dt
J
(3) m2
Since the exposure of each printed pixel is additive, the overall exposure at any given point on the OPC is the sum of exposures contributed from each neighboring pixel in the halftone, i.e. E ( x, y ) =
∑ Emn ( x, y)
(a)
(4)
Figure 4 Dot size and laser intensity modulation
m, n
VL = Vsat + (VD − Vsat )exp(
−E ) volts Ea
(5)
where Vsat is the voltage obtained for very high exposure energy, VD is the dark voltage, E is the exposure energy, and Ea is the “energy constant” that describes the sensitivity of the photoconductor. Through modulating the laser power amplitude, the exposure energy and the associated photoconductor contrast voltage are adjusted, which results in different dot sizes. Figure 4(a) shows the average dot profile of 16 dots when the input voltage is 1.1, 1.3, 1.5 and 1.7 volt, respectively. Figure 4(b) shows relationship between the input voltages and dot sizes. The dot size is determined by counting the number of pixels with absorptance greater than 0.1 in one dot cell. As seen in Figure 4, as input voltages increase, the dot sizes increase. However, the variation in the EP process results in variations in the corresponding dot sizes. To avoid ambiguity, the available dot size modulation are selected so that there are no overlap in dot sizes. From Figure 4, it can be seen that for the experimental platform there can be 3 to 4 levels of dot sizes by controlling the
B. CSF and HVS Threshold In order to embed unperceivable extrinsic signature, a model of the human visual system (HVS) is needed. One of such models is the contrast sensitivity function (CSF) that attempts to capture the modulation transfer function (MTF) of the human visual system in perceiving contrast variations. As shown in Figure 5(a), the CSF function acts like a band-pass filter which indicates that human are less sensitive to extremely low and high frequency bandings which are quite suitable region to embed signals. Figure 5(b) illustrates the contrast threshold of HVS where the yaxis indicates the inverse of contrast sensitivity. The threshold information is important since the signature should be below the detection threshold. The mapping between the modulating parameter, the laser intensity in the case, and the resulting contrast variation need to be determined to ensure that the extrinsic banding signature is below the human detection threshold. CSF
Contrast sensitivity inv(threshold contrast)
To control the exposure, one can either adjust the input voltage to the laser (amplitude modulation), or adjust the duration of the laser pulses (pulse width modulation or PWM) [3]. Both methods control I 0 (t ) , i.e. the beam power amplitude of the laser. In this study, we used amplitude modulation to control exposure. As shown in Figure 3, when I max is increased, the beam power I 0 (t ) and the total exposure energy are also increased. After the photoconductor is exposed to the laser beam, a latent image is produced on the photoconductor surface. Charged toner particles are attracted to the latent image and then transferred and fused to the paper. Based on the discharged electric potential, the tone value adhered on the photoconductor can be estimated. Here, the photoconductor surface voltage after exposure, i.e. the light voltage VL [9] can be written as
(b)
140
HVS Contrast Threshold 1.4
120
1.2
100
1
Contrast threshold
∫ I 0 (t )exp(−
80 60 40 20
0.8 0.6 0.4 0.2
0 0 20 40 60 Spatial frequency (c/deg)
(a)
0 0 20 40 60 Spatial frequency (c/deg)
(b)
Figure 5 CSF and HVS Contrast Threshold [11] (2.0 mm pupil, with viewing distance 57 inch)
C. Mapping between Laser Intensity and Contrast Variation To modulate laser intensity, we adjusted the reference voltage input Vref to the laser power control circuit with the following voltage signal:
250
where V0 is the nominal reference voltage for the laser power, f 0 is the spatial banding frequency, and ∆V is twice of the amplitude of the adjustment to reference voltage that will result in contrast variation. Michelson contrast [12] is one popular definition of contrast and is expressed as Y − Ymin C = max Ymax + Ymin
(7)
200
30 150 40 100 50 70 50
where Ymax and Ymin are the maximum and minimum luminance Y in CIE XYZ coordinates, respectively. This definition is usually used for periodic test patterns such as sinusoidal and square gratings and will be used in this study. A series of experiments are designed to obtain the mapping between laser intensity modulation ∆V and the resulting contrast variation. Test pages with 10 gray levels from 10% to 100% in 10% increments are generated using the printers default halftone. The test pages .will be printed with various different intensity modulations. As previously noted, to maintain exposure stability, only a limited range of ∆V can be used. The test page will then be scanned with a calibrated scanner and the associated contrast will be calculated from the scanned data. As the exposure modulation changes the dot size, the average absorptance will also change with the intensity modulation [3]. Consequently, the measured luminance will also depend on the intensity modulation ∆V. To a first order approximation, we can model the luminance as: Y (∆V ) = Y0 [1 + C (∆V ) ⋅ sin(2πf 0 y + φ )]
10 20
(6) Luminance Y (CIE XYZ)
∆V ⋅ sin(2πf 0 y ) 2
(8)
Where Y0 is the average luminance which is constant based on the fixed V0. Therefore, to embed the extrinsic banding signal, the intensity modulation needs to be determined by being able to generate the desired luminance and the contrast variation that is below the HVS contrast sensitivity. Figure 6 shows the relationship between reference voltages and the measured luminance of printed test pages with various default gray values. Generally, the luminance decreases when the reference voltage increases. However, this tendency is not obvious for extremely low and extremely high gray levels such as 10% to 30% and 80% to 100%. Figure 7 shows the measured mapping between ∆V and contrast. We chose two input reference voltage values V1 and V2, which are symmetric along two sides of V0, and obtained the corresponding luminance Y1 and Y2 from Figure 6. Let ∆V = V 1 − V 2 . Based on the definition of Michelson contrast, we calculated the contrast as a function
60
80 90 100
0 1
1.2
1.4
1.6
1.8
2
Vref
Figure 6 Relationship between reference voltages and luminance of printouts with various default gray values of 10%, through 100%
In order to embed unperceivable bandings into the document, we need to select the proper intensity modulation ∆V so that the resulting contrast is under HVS contrast threshold. Therefore, using Figure 5(b) as the threshold for Figure 7, we obtained Figure 8, which shows the ∆V threshold as a function of the spatial frequency and the desired gray values. As shown, for mid-tone gray levels, the corresponding ∆V threshold is low for a wide range of spatial frequencies. This implies that only a small amount of banding signal can be embedded without affecting the perceived image quality. However, when the spatial frequency is higher than 45 cycles per degree, the ∆V threshold is high for all gray levels. This is another indication that higher spatial frequencies are the potential regions for embedding extrinsic banding signatures. 0.8 0.7
70
60
50
0.6
Contrast
Vref = V0 +
of ∆V. From Figure7, we noticed that mid-tone will results in higher contrast when we apply the same intensity modulation ∆V. This collaborate with the known results that banding are relatively more noticeable in the mid-tone region.
80
0.5 0.4
40
0.3 0.2
30 90
0.1 0 0
20 0.2
0.4 0.6 delta Vref
0.8
Figure 7 Mapping between ∆V and contrast
10 100 1
1
10 100
20 90
delta Vref Threshold
0.8
40 80
30
0.6
0.4
70 60 50
0.2
0 0
10
20 30 40 Spatial frequency (cycles/deg)
50
Figure 8 Mapping between the ∆V threshold and the spatial frequency for difference desired gray levels
Figure 9 Test image for extrinsic signature embedding 6
Experimental Results Reflectance spectrum
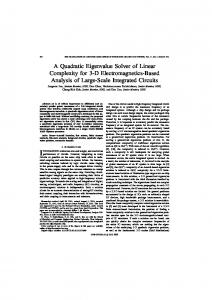
To demonstrate embedding extrinsic signature into haltone images, a natural image with large regions of smooth midtone is selected, see Figure 9. These images are more susceptible to banding noise. Figure 10 shows the projected reflectance spectrum of the original printed test image without embedding any banding signature. As can be seen, frequency peaks at 75, 100, and 150 cycles per inch are present. This frequency pattern is the intrinsic signature of the printer, since it came from either process variation due to manufacturing or halftone screens. To embed extrinsic signature, we need to avoid overlapping with the intrinsic signals in the printer. In this example, 90, 110 and 130 cycles per inch (corresponds to 19, 23, and 27 cycles per degree with 12 inch viewing distance) banding signals with intensity variation ∆V = 0.05 were embedded. Figure 11 shows the printed image with embedded signature. It is clear that there is not visible degradation in image quality and the embedded banding signals are not visible. Figure 12 shows the reflectance spectrum of the printed image with signature embedded. The original 75, 100, and 150 cycles per inch intrinsic bands are still present. However, the 90, 110 and 130 bands are also detectable. Note that the 130 cycle per inch peak is very weak. Although the same intensity modulation ∆V is applied, we observe a decrease in the effect. This may be attributed to the combined MTF characteristics of the printer and the scanner, since the scanner and printer MTF were not compensated. More work is needed to adjust and compensate for these device characteristics.
5 4 150 3
75
2 1 0 0
100
50
100 150 200 Spatial frequency (cycle/in)
250
300
Figure 10 Spectrum of the projected reflectance for the original image Figure 9
Conclusion We have demonstrated the feasibility to embedded unperceivable banding signals into halftone images as the extrinsic signature of an EP printer. Modeling and experimental characterization of the EP process to enable embedding banding signal that are below human visual threshold is presented. The results not only provided the necessary information for embedding extrinsic signature, it also provided design thresholds for printer developer to reduce the intrinsic banding signal in an EP process. As predicted that high spatial frequency provided the better trade-off between signal capacity and perception threshold. However, the printer and subsequent scanner MTF will also limit the range where extrinsic signals can be injected.
[2] Edward J. Delp, Is your document safe: An overview of
Figure 11 Test image where 90, 110 and 130 cycle/in banding signals are embedded 6
Reflectance spectrum
5 4 3
90 110
2
130 1 0 0
50
100 150 200 Spatial frequency (cycle/in)
250
300
Figure 12 Reflectance spectrum of the test image with signature embedded Figure 11
Acknowledgement The authors would like to acknowledge the support of the National Science Foundation under the grant CCR0219893.
Reference [1] G. N. Ali, P,-J. Chiang, A. K. Mikkilineni, J. P. Allebach, G. T. Chiu and E. J. Delp, Intrinsic and Extrinsic Signatures for Information Hiding and Secure Printing with Electrophotographic Devices, in the Proceedings of the IS&T NIP19: International Conference on Digital Printing Technologies, pp. 511-515, New Orleans, Louisiana, September 28- October 3, 2003.
document and print security, in Proceedings of the IS&T International Conference on Non-Impact Printing (2002). [3] G.Y. Lin, J. Grice, J. Allebach, G.T.-C. Chiu, W. Bradburn, and J. Weaver, Banding Artifact Reduction in Electrophotographic Printers by Using Pulse Width Modulation, Journal of Image Science and Technology, Vol. 46, No. 4, pp. 326-337, July/August 2002. [4] C.-L. Chen, G.T.-C. Chiu, and Jan P. Allebach, Banding Reduction in Electrophotographic Processes Using Human Contrast Sensitivity Function Shaped Photoconductor Velocity Control, Journal of Image Science and Technology, Vol. 47, No. 3, pp. 209-223, May/June 2003 [5] M. Ewe, J. Grice, G.T.-C. Chiu, J. Allebach, C.S. Chan, and W. Foote, Banding Reduction in Electrophotographic Processes Using Piezoelectric Actuated Laser Beam Deflection Device, Journal of Image Science and Technology, Vol. 46, No. 5, pp. 433-442, September/October 2002 [6] A.K. Mikkilineni, G.N. Ali, P.J. Chiang, G. T.-C. Chiu, J.A. Allebach, and E.J. Delp, Printer Identification Based on Textural Features, in the Proceedings of the IS&T NIP20: International Conference on Digital Printing Technologies, Salt Lake City, UT, October 2004 [7] A.K. Mikkilineni, G.N. Ali, P.J. Chiang, E.J. Delp, J.A. Allebach, and G. T.-C. Chiu,, Signature-embedding in printed documents for security and forensic applications, in the Proceedings of the SPIE/IS&T Conference on Security, Steganography and Watermarking of Multimedia Contents, pp. 455–466 (2004). [8] G.N. Ali, P.J. Chiang, A.K. Mikkilineni, George T.-C. Chiu, E.J. Delp, and J.A. Allebach, Application of principal components analysis and Gaussian mixure models to printer identification, in Proceedings of the IS&T NIP20: International Conference on Digital Printing Technologies, Salt Lake City, UT, October 2004. [9] E. M. Williams, The Physics and Technology of Xerographic Processed. New York: Wiley, 1984. [10] D. Kacker, T. Camis, and J. P. Allebach, Electrophotographic Process Embedded in Direct Binary Search, IEEE Trans. on Image Processing, 11, 234-257 ,2002 [11] F. W. Campbell and D. G. Green, Optical and retinal factors affecting visual resolution, J. Physiology 181, 576-593 (1965) [12] A. A. Michelson, Studies in Optics, Chicago, Ill.: Univ. Chicago Press, 1927.
Biography Pei-Ju Chiang received her B.S. degree in Mechanical and Marine Engineering from the National Taiwan Ocean University, in 1999 and a M.S. degree in Mechanical Engineering from the National Central University in 2001. She is currently pursuing her Ph.D. degree in the School of Mechanical Engineering at Purdue University. Her research interests are securing documents, modeling and analysis of digital printing and imaging processes.
Extrinsic Signatures Embedding Using Exposure Modulation for Information Hiding and Secure Printing in Electrophotography Pei-Ju Chiang2, Gazi N. Ali1, Aravind K. Mikkilineni1, Edward J. Delp1, Jan P. Allebach1, and George T.-C. Chiu2 1 School of Electrical and Computer Engineering 2 School of Mechanical Engineering Purdue University West Lafayette, Indiana Abstract Banding is one of the image artifacts for electrophotographic (EP) printers. Due to its origin within the EP process, it can also be viewed as an intrinsic signature of the specific printer. Modulating the EP process to generate banding signals that are below the human visual threshold but can be detected by effective detection approach can further extend the signature capacity. This deliberate banding signal can be viewed as extrinsic signature of a printer. Since modulating the printing process provides significant barrier of entry, it is effective in limiting the attack possibilities and can be an effective method to embed needed information regarding the document and the device it was printed on to provide unprecedented forensic information. One of the key issues with embedding extrinsic signature is the information should not be detectable by the human observer. However, the signature needs to be detectable by a suitable detection algorithm. In this paper, we will propose one method to modulate the exposure of the EP process to embed controlled quasi-periodic signature into a document. Based on the system level modeling and experimental verification of the EP process, machine detectable signatures that are below the human visual threshold can be embedded into a printed document without any perceivable degradation in image quality. Preliminary experiment results confirm our hypothesis that with properly designed control techniques, effective extrinsic signatures can be embedded into a document.
Keywords EP Process, Intrinsic Signature, Extrinsic Signature, Human Visual Threshold