12th IFIP/IEEE International Symposium on Integrated Network Management 2011
FAST: A Fuzzy-based Adaptive Scheduling Technique for IEEE 802.16 Networks Sin-seok Seo∗ , Joon-Myung Kang∗ , Nazim Agoulmine†‡ , John Strassner† , and James Won-Ki Hong† ∗ Department
of Computer Science and Engineering Pohang University of Science and Technology (POSTECH), Pohang, Korea Email: {sesise, eliot}@postech.ac.kr † Division of IT Convergence Engineering Pohang University of Science and Technology (POSTECH), Pohang, Korea Email: {nazim, johns, jwkhong}@postech.ac.kr ‡ LRSM Team - IBISC Lab University of Evry Val d’Essonne, France Email:
[email protected] Abstract—Since the IEEE 802.16 first standard was proposed in 2004 to provide broadband wireless service, the standard has not only been widely studied, but also broadly commercialized. The current IEEE 802.16-2009 standard document specifies five Quality of Service classes. As is typical with most standards, IEEE 802.16 does not require the use of a specific scheduler. In this paper, we first evaluate the performance of four popular schedulers. By analyzing the results, we highlight that no single scheduler type performs the best in all traffic situations; however, we shown that there exist the most favorable scheduler type in each situation. Based on this rationale, our idea is to propose an adaptive scheduling schema where the scheduler is dynamically chosen based on the current traffic context, such as the number of flows of each Quality of Service class. We investigate this approach and evaluate its performance against existing static schemas. The results show that our approach presents some interesting performances in terms of throughput, delay, and packet loss ratio regarding state of art approaches. Index Terms—Packet Scheduling, IEEE 802.16, WiMAX, Network Management, Fuzzy Logic, Quality of Service
I. I NTRODUCTION The demand for high data rate and large coverage in wireless networks is increasing sharply with various mobile services including video call, mobile internet, and games. To cope with this trend, the IEEE 802.16 standard [1] for broadband wireless access was proposed in 2004 superseded by several documents including the latest approved document IEEE 802.16-2009 (Air Interface for Fixed and Mobile Broadband Wireless Access System) that is a rollup of 802.16-2004, 802.162004/Cor 1, 802.16e, 802.16f, 802.16g and P802.16i. This specification itself is being enhanced into IEEE 802.16m [2]. The WiMAX Forum is an industry-led organization in the area to certify and promote the compatibility and interoperability of broadband wireless products based upon the harmonized IEEE 802.16 standard. An IEEE 802.16 base station (BS) can This work was partly supported by the IT R&D program of MKE/KEIT [KI003594 , Novel Study on Highly Manageable Network and Service Architecture for New Generation] and WCU (World Class University) program through the National Research Foundation of Korea funded by the Ministry of Education, Science and Technology (Project No. R31-2008-000-10100-0).
978-1-4244-9220-6/11/$26.00 ©2011 IEEE
provide wireless access service to a fixed subscriber station (SS) within a range of 50 km and to a moving SS within a range of 3 to 15 km. The maximum data rate is up to 70 Mbps. The IEEE 802.16-2009 defines five different Quality of Service (QoS) classes, which are Unsolicited Grant Service (UGS), Extended Real Time Polling Service (ertPS), Real Time Polling Service (rtPS), Non Real Time Polling Service (nrtPS), and Best Effort Service (BE). These classes help provide different services to applications having different QoS requirements. The UGS class is designed to support constant bit rate (CBR) real-time traffic. For that, a BS regularly allocates a fixed amount of bandwidth to this traffic class. The ertPS class is intended to support Voice over IP (VoIP) traffic, which has repeated speech periods and silent periods. A BS allocates a fixed amount of bandwidth for a speech period, but no bandwidth for a silent period, unlike the UGS. The rtPS class is designed to support variable bit rate (VBR) real-time traffic, such as video streaming. A BS regularly polls each SS to determine the amount of bandwidth that needs to be allocated, because the required bandwidth varies for this kind of traffic. The nrtPS class is for non-real-time VBR traffic, and it only guarantees minimum throughput for an application. File downloading traffic is a good example of an application of this QoS class. The BE class allocates resources to SSs if and only if there are left-over resources after allocating the resources to other QoS classes of higher priority. This QoS class guarantees neither delay nor throughput. A scheduler works as a resource allocator to share limited resources among SSs that are served by a BS. IEEE 802.16 does not constrain the use of any specific scheduler; rather, the manufacturers of IEEE 802.16 devices can choose to use existing scheduler(s) or develop new one. Accordingly, the design of an efficient scheduler can be indeed a differentiation factor among manufacturer’s devices. Several schedulers have been suggested including Deficit Round Robin (DRR) [3], Proportional Fair (PF) [4], and Earliest Deadline First (EDF) [5]. Also, several papers that evaluate the performance of various schedulers have been published [6]–[9]. Designing a scheduler
201
is always a balance between several objectives and therefore it appears that no single scheduler type satisfies all QoS requirements. For example, DRR outperforms PF with low number of traffic flows, but PF is better than DRR when there are more traffic flows [8]. In this paper, we investigate the possibility to implement a dynamic scheduling schema, where the chosen scheduler depends on the traffic situation. First of all, we evaluate the performance of some existing schedulers, which are First Come First Served (FCFS), DRR, Weighted-DRR (WDRR), and PF, and determine in which context they perform best. Then, we propose to use fuzzy logic to dynamically select a scheduler based on the particular types and characteristics of existing traffic (we do not address the mechanism to detect the traffic context and we suppose that some existing techniques could help to do it in real-time [10], [11]). The corresponding fuzzy controller behavior is specified based on a set of selection rules that are derived from the performance evaluation results obtained from the use of different existing schedulers (FCFS, DRR, WDRR, and PF) in several traffic contexts scenarios. Finally, we present the performance evaluation results of our solution and compare it to static schedulers. The obtained results show that our solution presents very interesting results against the other approaches. In several traffic contexts, it behaves almost like the best scheduler which shows that the fuzzy controller is behaving the right way. Of course, there is a trade-off to our approach as the real-time change of scheduler may introduce some delay as well as complexity in the BS equipment. II. R ELATED W ORK A number of schedulers have been proposed for IEEE 802.16 networks. They are classified into two broad categories, called Channel Unaware and Channel Aware, in [12]. The Channel Unaware schedulers do not use information about the current channel status when they allocate resources to each SS. This type of scheduler can be further classified into two sub-categories: intra-class and inter-class. The intraclass schedulers are for allocating resources within the same QoS class, whereas the inter-class schedulers coordinate resource allocation among different QoS classes. In contrast, the Channel Aware schedulers consider the channel status, such as channel errors and transmission power. Key objectives of this type of scheduler are fairness, QoS guarantee, throughput maximization, and power consumption optimization. In [9] IEEE 802.16 schedulers were classified into three categories: Homogeneous, Hybrid, and Opportunistic. The Homogeneous and the Hybrid schedulers correspond to the Channel Unaware schedulers. The difference between them is that the Hybrid schedulers employ multiple Homogeneous schedulers in an attempt to satisfy conflicting QoS requirements. The Opportunistic schedulers, which exploit variations in channel conditions, correspond to the Channel Aware schedulers of [12]. Several works that evaluate and compare the performance of IEEE 802.16 schedulers have been published [6]–[9]. In [6],
the performance of EDF and Weighted Fair Queuing (WFQ) schedulers are examined with respect to average throughput and end-to-end delay. In [7], simulation results are provided for DRR for downlink scheduling and WFQ for uplink scheduling that compare average delay, throughput, frame utilization, and number of served SSs. Most of them are shown against a changing number of SSs. The performance of DRR, WDRR, and PF schedulers are compared in [8], and the conclusion of this work is that an optimal scheduler varies in different situations. In [9], several schedulers including EDF, WFQ, EDF+WFQ, and EDF+WFQ+FCFS are evaluated considering fairness, frame utilization, average throughput, average delay, and packet loss. To our best knowledge from the former work, no single scheduler type provides the best performance with respect to all QoS requirements. Thus, we are motivated by this common conclusion, and seek to find an adaptive scheduling method that can perform better than each of these individual schedulers for a varied traffic mix. III. E XISTING IEEE 802.16 S CHEDULERS The performance of each scheduler differs, depending on the current traffic mix. For example, if only BE traffic is present, such as web browsing traffic, then a simple FCFS scheduler would be the best choice, because it has low computational complexity. On the other hand, if there are various kinds of traffic, such as VoIP, video streaming, and file downloading, then the FCFS would fail to meet the QoS requirements of these other applications, because each type of traffic has different QoS requirements. For instance, VoIP traffic should be treated differently because it has strict delay, jitter, and loss requirements that the FCFS scheduler cannot satisfy. In this Section, we present experimental results to determine the best scheduler in various situations. We use four different kinds of schedulers in the simulation. The rest of this Section briefly describes each scheduler and our simulation environment. This is followed by the performance evaluation results. A. Schedulers Our target scheduler is for downlink resource allocation, and we use a strict priority-based scheduler for inter-class scheduling (this approach could eventually be used for uplink as well with some adaptation). The priority among QoS classes is defined as follows: UGS > ertPS > rtPS > nrtPS > BE.
(1)
The main focus of our experiment is on evaluating the performance of the following four intra-class schedulers. 1) FCFS: This is a very simple scheduler. Resources are allocated to the queue whose packet arrives first. 2) DRR: This was originally developed for IP networks in 1996 [3]. In DRR, a set of queues are serviced in a round-robin (RR) fashion. A maximum packet size number is subtracted from the packet length, and packets that exceed that number are held back until the next visit of the scheduler. While Weighted-RR (WRR) serves every non-empty queue, DRR only serves non-empty queues whose deficit counter is greater
202
Video Streaming Server
than the packet size at the head of the queue. The difference from traditional RR is that if a queue was not able to send a packet in the previous round because the size of the packet was too large, this is corrected in the next round. 3) WDRR: WDRR [8] is a variant of DRR in which each queue is assigned a different weight. This enables policy rules and other mechanisms to be used to ensure that the QoS commitments required by different service flows are properly met. 4) PF: PF [4] assigns resources according to rank of the ratio of current achievable rate to averaged rate of each traffic flow. This scheduler repeats the following two steps. In the first step, the PF scheduler finds the traffic flow with the best ratio of current achievable rate to averaged rate and allocates resources to that flow. In the second step, the averaged rate values of every traffic flow are updated, even when the traffic flow does not have a packet to send.
100 Mbps 2 ms Router BS Web Server
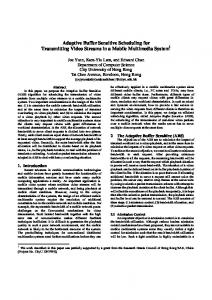
Fig. 1.
File Server
Simulation topology.
TABLE I S IMULATION PARAMETERS Parameter Value Carrier frequency 5 GHz Channel bandwidth 10 MHz Frame duration 10 ms Physical layer OFDM Duplex mode TDD FFT size 256 Transmit/receive transition gap 0 Receive/transmit transition gap 0
B. Scheduler Comparison The FCFS scheduler is fast and simple, but it is not capable of guaranteeing different QoS requirements due to its inherent simplicity. The DRR and WDRR schedulers are also simple and allocate resources fairly, but they show bad performance when the average packet size is large. The PF scheduler provides high throughput; however, some traffic flows, which have bad channel conditions, can starve. The complexity of PF is O(N ), whereas FCFS, DRR, and WDRR have O(1) complexity [12].
VoIP Server
Parameter Value Max MAC PDU size 1400 bits Propagation Model COST-Hata Tx power 30 dBm Tx gain 0 dBi Rx gain 0 dBi Noise 5 dB BS antenna height 50 m SS antenna height 3m
IEEE 802.16 supports per SS based adaptive modulation, which means a BS changes Modulation and Coding Scheme (MCS) according to the current conditions of a channel between a BS and a SS. The MCS was set to use Quadrature Phase Shift Keying (QPSK) 1/2 coding initially, and then changed to another MCS, such as QPSK 3/4, following the Markov chain to model changing conditions of the channel. The state transition probabilities can be found in [8].
C. Simulation Environment
D. Traffic Models
The performance comparison among the four schedulers was done using the ns-3 network simulator [13]. The ns-3 is a state-of-the-art, open source, and discrete-event based simulator that succeeds the popular ns-2 simulator. This simulator contains the IEEE 802.16 WiMAX module [14], [15], which supports four QoS classes (UGS, rtPS, nrtPS, and BE); these are defined by IEEE 802.16-2004 [1]. However, it does not support the ertPS QoS class which was defined later in [16]. Moreover, the UGS QoS class is defined to receive a fixed amount of resources in IEEE 802.16, so it does not influence the performance of different schedulers. Hence, we only considered the rtPS, nrtPS, and BE QoS classes in the following simulation. The module already had a FCFS scheduler, so we implemented the other three schedulers, which are DRR, WDRR, and PF. The topology for our simulation is depicted in Fig. 1. Four dedicated servers, one each for VoIP, Video streaming, File downloading, and Web browsing application traffic were connected to a router that was connected to a BS via an Ethernet link. The Ethernet link had 100 Mbps bandwidth and 2 ms propagation delay. The SSs communicated with the BS, and the number of SSs was varied in different scenarios. They were initially located around the BS randomly, and continuously changed their position randomly until the simulation finished. Other important simulation parameters are given in Table I.
Four different types of traffic (VoIP, Video streaming, File downloading, and Web browsing) were generated to simulate a realistic environment. There were four servers in the simulation, and each server generated a single traffic type. 1) VoIP: The VoIP traffic followed a simple On/Off Markov model [7], [8]. The packets were generated only during the On period; no packets were generated during the Off period. The On and Off period lengths were exponentially distributed with a mean of 1.2 s and 0.8 s, respectively. The packet size was 66 bytes and an average On state data rate was set to 26.4 kbps. This traffic was assigned to the rtPS QoS class. 2) Video streaming: We generated video streaming traffic using a real trace file, which can be downloaded in [17]. We used the trace file of “Starship Troopers” movie, which was encoded using an H.263 codec. This traffic was assigned to the rtPS QoS class. 3) File downloading: The file downloading traffic model constantly sent packets of a fixed size of 1024 bytes at an average rate of 256 kbps. This traffic was assigned to the nrtPS QoS class. 4) Web browsing: The web browsing traffic model can be found in [18]. We slightly modified that model to use it in our simulation as follows. A web page consisted of a main page and several embedded objects. The main page size followed an exponential distribution with a mean of 48,302 bytes,
203
TABLE II S IMULATION SCENARIOS FOR EVALUATING THE PERFORMANCE OF FCFS, DRR, WDRR, AND PF SCHEDULERS No. 1 2 3 4 5 6 7 8 9 10
Traffic Types 5 VoIP 5 Video 5 File 5 Web 5 VoIP + 5 Video 5 VoIP + 5 File 5 VoIP + 5 Web 5 Video + 5 File 5 Video + 5 Web 5 File + 5 Web
No. 11a 11b 12a 12b 13a 13b 14a 14b 15a 15b
Traffic Types 5 VoIP + 5 Video + 5 File 5 VoIP + 3 Video + 3 File 5 VoIP + 5 Video + 5 Web 5 VoIP + 3 Video + 3 Web 5 VoIP + 5 File + 5 Web 5 VoIP + 3 File + 3 Web 5 Video + 5 File + 5 Web 3 Video + 3 File + 3 Web 5 VoIP + 3 Video + 3 File + 5 Web 5 VoIP + 3 Video + 3 File + 3 Web
minimum of 5,500 bytes, and maximum of 170,000 bytes. The embedded object size followed a truncated log-normal distribution with a mean of 8,475 bytes, standard deviation of 60,195 bytes, minimum of 25 bytes, and maximum of 200,000 bytes. The number of embedded objects followed a triangular distribution with a lower bound of 5, upper bound of 24, and mean of 14. Seventy-six percent of the packets had a size of 1,024 bytes, and the remaining of packets had a size of 576 bytes. The web browsing traffic model also followed an On/Off Markov model, because once we had the entire contents of the web page, we spent some time to read that page. The reading time followed an exponential distribution with a mean of 30 s. This traffic was assigned to the BE QoS class. E. Performance Evaluation We composed 20 different scenarios (Table II) to simulate various traffic contexts. Each scenario had a unique combination of four different types of traffic (VoIP, Video, FTP, and Web). The scenarios from 11 to 15 had two sub-scenarios: a congested situation (a) and a non-congested situation (b). For this, we changed the number of Video, File, and Web traffic flows from 5 to 3. Every simulation was executed for 180 s, and the traffic servers started sending packets after about 10 s from the start of the simulation, because they needed some time to stabilize the connection between a BS and a SS. The servers stopped sending packets after 170 s, which meant servers sent packets during 160 s. The remaining 10 s was a guard time that took into account the delay from a server to a SS. Each scenario was repeated five times with a different random seed, and the averaged results are given in Table III. The results contain three different metrics: Throughput (kbps), Delay (ms), and Packet loss ratio (%). The throughput is the averaged amount of received packets per a second. The delay is the averaged difference between the packet sending time on the server side and the packet receiving time on the SS side. The packet loss is captured through a sequence number. The sequence number starts from 0, and increases by 1 each time a packet is sent. By examining the sequence number of received packets, the receiving SS can know how many packets are missing. We organized the results by type of metric and scheduler for each simulation
scenario. While we evaluated the performance separately by traffic types, Table III contains only aggregated results for all traffic types due to page constraints. We can determine which scheduler is optimal for a given situation from Table III. The rules for selecting an optimal scheduler in a given scenario are: • Rule 1: The scheduler that has higher performance for higher level QoS class is optimal. • Rule 2: The scheduler that has higher aggregated performance is optimal. • Rule 3: The scheduler that has lower computational complexity is optimal. Rule 1 is checked first; it is applied to the traffic that has the highest QoS class. If this rule does not yield an optimal scheduler, we execute Rule 1 again, but instead use the traffic with the next highest QoS class. We continue this approach; however, if this approach fails to select an optimal scheduler, we then apply Rule 2. If Rule 2 does not select an optimal scheduler, we then use Rule 3. The meaning of “higher performance” is different for different QoS classes. In this paper, we define lower delay and lower packet loss ratio as “target performance” for the rtPS QoS class, and define higher throughput and lower packet loss ratio as “target performance” for the nrtPS and BE QoS classes. In addition, we define the two performance results to be equivalent when the difference is not significant considering the standard deviation of the results. The optimal schedulers computed by the above three rules are shown in the bottom of Table III. The selected schedulers do not always show the best “aggregated” performance, because they were designed to satisfy high level QoS classes against other classes. Table III highlights that no single scheduler type is capable to satisfy all situations. However, a best among schedulers can be found in each specific scenario (i.e. traffic context). From those results, one may think that the use of an adaptive scheduler that dynamically changes its algorithm according to a specific situation could take the best of all at each stage. However, what scheduling algorithm to choose in each context and how to identify and define a context are open questions we aim to address in the following sections. IV. F UZZY- BASED A DAPTIVE S CHEDULER As the relations between contexts and the best corresponding scheduling algorithm are not deterministic, it is necessary to find a good and intuitive approach to do. For that, we propose to use fuzzy logic to design the adaptive scheduler, and named it the Fuzzy-based Adaptive Scheduling Technique (FAST). The concept of the FAST is shown in Fig. 2. We used the Mamdani Fuzzy Inference System (FIS) [19], which is a very popular fuzzy logic system. It’s role is to select the best scheduler based on the current traffic context information, such as the number of flows of each QoS class and total requested throughput. The strength of fuzzy logic is that it can represent a vague term, such as “low” or “high”, which obviates the need to choose a specific value. It is simple, but still has flexibility,
204
TABLE III P ERFORMANCE EVALUATION RESULTS FOR FCFS, DRR, WDRR, AND PF SCHEDULERS .
Metric
Scheduler
1 2 mean s.d. mean s.d. FCFS 78 3 672 0 Throughput DRR 80 2 672 0 (kbps) WDRR 80 2 672 0 PF 78 2 672 0 FCFS 50 0 79 0 Delay DRR 10 0 41 0 (ms) WDRR 10 0 42 0 PF 10 0 42 0 FCFS 0.00 0.00 0.06 0.00 Packet loss DRR 0.00 0.00 0.06 0.00 ratio (%) WDRR 0.00 0.00 0.06 0.00 PF 0.00 0.00 0.06 0.00 Derived Optimal Scheduler DRR DRR Metric
Scheduler
11a mean s.d. FCFS 1631 2 Throughput DRR 1634 7 (kbps) WDRR 1633 11 PF 1639 5 FCFS 995 7 Delay DRR 964 12 (ms) WDRR 965 14 PF 965 2 FCFS 23.14 0.56 Packet loss DRR 22.54 0.74 ratio (%) WDRR 22.76 0.81 PF 22.78 0.62 Derived Optimal Scheduler DRR
Scheduling Context - Number of flows of each QoS class - Ratio of each traffic type - Total requested throughput
- ...
11b mean s.d. 1250 2 1250 2 1250 1 1251 3 103 13 74 15 68 12 72 14 0.09 0.04 0.11 0.12 0.06 0.04 0.07 0.06 WDRR
Fuzzy Inference System
3 mean s.d. 1280 0 1280 0 1280 0 1280 0 18 0 18 0 18 0 18 0 0.02 0.00 0.02 0.00 0.02 0.00 0.02 0.00 FCFS 12a mean s.d. 1489 19 1504 20 1499 15 1500 10 882 50 873 35 860 29 843 22 30.09 2.77 31.03 1.90 30.81 1.30 29.80 1.15 PF
Scenario 4 5 mean s.d. mean s.d. 1530 117 753 2 1519 71 751 2 1522 108 751 2 1501 115 752 3 55 13 83 1 60 7 43 0 55 11 43 1 59 14 43 1 1.84 1.13 0.04 0.01 2.06 1.02 0.03 0.01 1.29 0.52 0.03 0.01 2.39 0.58 0.03 0.01 FCFS DRR Scenario 12b 13a mean s.d. mean s.d. 1224 51 1894 10 1309 39 1903 10 1303 64 1902 9 1272 54 1901 18 329 44 1002 24 347 30 987 29 349 57 984 32 324 57 958 41 7.62 0.77 33.58 2.48 8.21 1.12 33.67 2.31 8.54 1.99 34.12 3.14 6.96 1.89 33.47 2.07 PF PF
Fuzzy Rules
Selects
FCFS
DRR
Fig. 2.
WDRR
PF
...
Conceptual diagram of FAST.
adaptivity, and extensibility. Also, fuzzy parameters can be optimized using machine learning or bio-inspired techniques. Due to these benefits, fuzzy logic is widely used in various areas, including adjusting the configuration parameters of IEEE 802.16 networks [20]. In this Section, we briefly describe fuzzy logic. Then, we define membership functions and fuzzy rules used in the FAST. The simulation scenario, performance evaluation results, and discussion about the results follow. A. Fuzzy Logic Two popular FIS are the Mamdani FIS [19] and the Sugeno FIS [21]. We chose the former, because it has greater expressive power and better interpretability than the latter [22]. The Mamdani FIS works in four steps: Fuzzification, Rule Evaluation, Aggregation, and Defuzzification.
6 mean s.d. 1360 1 1358 3 1358 3 1358 3 45 1 27 4 27 4 23 1 0.00 0.00 0.00 0.01 0.00 0.01 0.00 0.01 PF
7 mean s.d. 1430 68 1399 45 1404 63 1364 55 327 45 253 17 260 38 238 37 12.52 2.00 10.22 1.66 10.75 0.99 8.86 2.70 PF
8 mean s.d. 1951 0 1952 0 1952 0 1952 0 70 0 51 0 51 0 51 0 0.07 0.01 0.04 0.00 0.04 0.00 0.04 0.00 DRR
9 mean s.d. 1932 35 1853 106 1858 49 1876 44 397 17 308 67 295 45 325 43 15.37 0.64 11.61 3.46 11.28 2.74 12.85 1.87 WDRR
10 mean s.d. 2401 33 2354 41 2372 28 2363 45 372 45 330 60 333 43 443 61 16.63 3.26 14.34 3.72 15.66 2.95 16.67 3.01 WDRR
13b mean s.d. 1585 41 1616 37 1620 42 1578 33 388 47 389 18 378 40 350 43 9.26 2.00 10.47 1.35 9.06 0.77 9.30 1.39 PF
14a mean s.d. 2231 3 2228 6 2226 6 2225 5 1094 9 1075 10 1077 11 1062 16 37.63 1.13 36.46 1.31 36.57 2.17 35.25 1.78 PF
14b mean s.d. 1976 60 1964 17 1948 27 1938 29 228 24 182 7 181 21 193 28 6.25 0.65 3.82 0.64 4.57 1.83 4.62 1.58 DRR
15a mean s.d. 1851 3 1852 12 1853 7 1853 4 1319 10 1288 22 1293 12 1301 11 48.33 0.96 47.32 1.65 47.12 1.66 48.81 1.12 DRR
15b mean s.d. 1763 10 1743 19 1722 27 1767 20 785 34 722 27 696 46 781 42 24.64 1.32 22.87 1.95 23.07 2.74 26.48 2.42 WDRR
In the Fuzzification step, the FIS evaluates input values using membership functions. The membership function returns the degree to which an input value could be contained in a fuzzy set. The degree is a value between 0 and 1. If the returned degree is closer to 1, then the input value is more likely to be contained in a fuzzy set. The evaluated results are passed to the Rule Evaluation step. In the Rule Evaluation step, the membership degrees that were passed from the Fuzzification step are evaluated using fuzzy rules. For example, let’s assume that we have a rule as follows: “IF number of BE traffic flows IS high THEN scheduler IS PF.” The FIS takes the number of current BE traffic flows as an input, then translates this value into a fuzzy set using the membership function. After that, the FIS decides the scheduler to be PF based on the rule in the Rule Evaluation step. The Aggregation step converts the results into one fuzzy set for each output variable. Then, the output fuzzy sets are changed into output values in the Defuzzification step. A number of Defuzzification methods are available, including Center of Gravity (CoG), First of Maximum, and Middle of Maximum. We used the CoG method for the FAST, which finds the point where a vertical line would slice the aggregate set into two equal sections.
205
TABLE IV S AMPLE F UZZY RULES FOR FAST.
If If If If
rtPSNumber rtPSNumber rtPSNumber rtPSNumber
is is is is
... MEDIUM and nrtPSNumber is ZERO and BENumber is MEDIUM and total requested throughput is HIGH then Scheduler is WDRR ZERO and nrtPSNumber is MEDIUM and BENumber is MEDIUM and total requested throughput is HIGH then Scheduler is DRR HIGH and nrtPSNumber is MEDIUM and BENumber is ZERO and total requested throughput is HIGH then Scheduler is PF HIGH and nrtPSNumber is ZERO and BENumber is MEDIUM and total requested throughput is HIGH then Scheduler is FCFS ...
0 10
no
low
medium
high
no
medium
high
5 10 15 Number of rtPS connections
20
low
medium
0
5 10 15 Number of nrtPS connections
190
220 230 s
Fig. 4. Time-line for performance evaluation of FAST against FCFS, DRR, WDRR, and PF schedulers.
20
high
low
medium
high
severe
Degree
Degree
1
0
0 5 10 15 Number of BE connections
20
0
1000 2000 3000 4000 Total Requested Throughput [Kbps]
(c) Fig. 3.
160
(b)
1
0
130
Web
(a) no
100
File
0 0
70
Video
Degree
0
40
VoIP
1
Degree
1
low
(d) Membership Functions for FAST
B. Membership Functions and Fuzzy Rules We use four input metrics for the FAST, which are the number of rtPS traffic flows, the number of nrtPS traffic flows, the number of BE traffic flows, and the total requested throughput. These metrics can be easily obtained from the BS. We defined four membership functions to convert the four input metrics into fuzzy sets (Fig. 3). We also defined twenty fuzzy rules to select an optimal scheduler in a given situation. Some representative fuzzy rules are shown in Table IV. The membership functions and fuzzy rules are obtained by analyzing Table III. Each input value is converted into a fuzzy set (e.g., low or high) through the corresponding membership function. After that, each fuzzy rule is evaluated using the input fuzzy sets, which are the results of the input values and membership functions. These evaluation results are aggregated into a single fuzzy set to derive an optimal scheduler for a given set of input metrics. Finally, the output fuzzy set, which is an optimal scheduler, is created using the CoG defuzzification method, after which the FAST calls the selected optimal scheduler to allocate requested resources to each flow. C. Performance Evaluation We implemented FAST using fuzzy-lite [23], which is a C++ based open-source fuzzy logic library. It supports both the Mamdani and the Sugeno FISs, and has an object-oriented structure, which simplifies its integration into our simulation.
We evaluated the performance of the FAST against the existing four individual schedulers. The simulation environment and the four types of traffic models (VoIP, Video streaming, File downloading, and Web browsing) were the same as the ones we described in Section III. We simulated 5 traffic flows for each traffic type. The start and end times of each traffic followed the time-line depicted in Fig. 4. This scenario built various situations, where existing traffic types changed over time. For instance, there was only VoIP traffic in the time period between 10 s and 40 s, whereas VoIP and File downloading traffic co-existed in the 40 s and 70 s time period. The simulation was repeated 5 times with a different random seed, and the averaged results are given in Fig. 5, 6, and Table V. Fig. 5 depicts aggregated throughput (a), delay (b), and packet loss ratio (c) of FAST against FCFS, DRR, WDRR, and PF schedulers per 10 s, while Fig. 6 depicts delay (a, b, c, d) and packet loss ratio (e, f, g, h) separately by traffic types. The aggregated average throughput of each scheduler (Fig. 5a) shows no clear difference among them, because the evaluation scenario did not contain a congested situation; almost every requested packet was served. So, we did not show throughput comparison per traffic types in Fig. 6. In Fig. 5b, 6a, 6b, 6c, and 6d, FAST shows the lowest delay almost every time except during the 70–100 s period. WDRR shows the lowest delay in the 80–90 s period, but if we aggregate 70–100 s period, FAST shows lowest delay. Fig. 5c depicts the packet loss ratio comparison of each scheduler, and FAST provides the lowest packet loss ratio in every situation except 100 and 150 s. Moreover, if you look at 100 and 160 s of Fig. 6e, 6f, 6g, and 6h, FAST is not the best scheduler. The main reason is that the overhead of our mechanism introduces a cost in terms of computational time to select an optimal scheduler using the FIS and to switch from a one scheduler to another. Quantifying and minimizing exactly this overhead is left for our future work. Table V shows averaged performance evaluation results in terms of throughput, delay, and packet loss ratio by traffic
206
FCFS DRR WDRR PF FAST
300 250 Delay [ms]
1500
1000
FCFS DRR WDRR PF FAST
FCFS DRR WDRR PF FAST
Packet loss ratio [%]
2000
Throughput [kbps]
1.5
350
2500
200 150
1
0.5
100 500
50
10
40
70 100 130 160 Simulation Time [s]
190
220
0
10
40
70 100 130 160 Simulation Time [s]
(a) Throughput
350
350
200 150
40
70 100 130 160 Simulation Time [s]
250
300 250
200 150
200 150
200 150 100
50
50
50
50
0
220
(a) VoIP delay
70 100 130 160 Simulation Time [s]
190
0
220
1 0.8 0.6 0.4
70 100 130 160 Simulation Time [s]
190
0
220
10
0.7
1.5
1
40
70 100 130 160 Simulation Time [s]
190
220
(d) Web browsing delay 3
FCFS DRR WDRR PF FAST
0.8
0.6 0.5 0.4 0.3
FCFS DRR WDRR PF FAST
2.5
2
1.5
1
0.2
0.5
0.5
0.2 0
40
(c) File downloading delay
FCFS DRR WDRR PF FAST
2 Packet loss ratio [%]
1.2
10
0.9
2.5
FCFS DRR WDRR PF FAST
1.4
40
(b) Video streaming delay
1.8 1.6
10
Packet loss ratio [%]
190
Packet loss ratio [%]
70 100 130 160 Simulation Time [s]
FCFS DRR WDRR PF FAST
250
100
40
220
300
100
10
190
350
FCFS DRR WDRR PF FAST
100
0
Packet loss ratio [%]
10
(c) Packet Loss Ratio
350
FCFS DRR WDRR PF FAST
300
Delay [ms]
Delay [ms]
250
0
Aggregated performance comparison of FAST against FCFS, DRR, WDRR, and PF.
FCFS DRR WDRR PF FAST
300
220
(b) Delay
Delay [ms]
Fig. 5.
190
Delay [ms]
0
0.1 10
40
70 100 130 160 Simulation Time [s]
190
(e) VoIP packet loss ratio Fig. 6.
220
0
10
40
70 100 130 160 Simulation Time [s]
190
0
220
10
40
70 100 130 160 Simulation Time [s]
190
220
(f) Video streaming packet loss ratio (g) File downloading packet loss ratio
0
10
40
70 100 130 160 Simulation Time [s]
190
220
(h) Web browsing packet loss ratio
Delay and packet loss ratio comparison of FAST against FCFS, DRR, WDRR, and PF per traffic type.
types and schedulers. The “All” traffic type rows provide aggregated average and standard deviation of four traffic types. FAST provides the best performance in terms of delay and packet loss ratio, while PF shows the highest throughput in aggregated results. This can be explained by the behavior of FAST, which selects the scheduler that perform better for higher level QoS traffic. Also, FAST does not show the best performance for VoIP and Video streaming traffic, due to overhead. However, the difference between FAST and the best scheduler’s performance is not significant. In addition, the overhead for FAST can be minimized by optimizing the
parameters of FAST. Moreover, FAST shows relatively low standard deviation compared to other schedulers, which means that FAST provides stable performance. V. C ONCLUSION AND F UTURE W ORK In this paper, we have presented the performance evaluation of four individual schedulers, and showed that no one could satisfy all situations. Based on this fact, we proposed a fuzzy logic based adaptive scheduler that dynamically selects the best scheduler for a given situation switching from one scheduler to another trying to achieve the best global performances.
207
TABLE V AVERAGED P ERFORMANCE EVALUATION RESULTS OF FAST AGAINST FCFS, DRR, WDRR, AND PF.
Metric
Throughput (kbps)
Delay (ms)
Packet loss ratio (%)
Scheduler FCFS DRR WDRR PF FAST FCFS DRR WDRR PF FAST FCFS DRR WDRR PF FAST
All mean 1117 1116 1115 1118 1116 84 69 67 66 64 0.11 0.17 0.16 0.14 0.10
Traffic Type Video mean s.d. 670 0 671 0 671 0 671 0 671 1 167 1 131 4 130 2 131 2 133 0 0.29 0.01 0.27 0.06 0.23 0.01 0.22 0.07 0.22 0.05
VoIP s.d. 1 1 2 1 1 5 9 9 3 1 0.00 0.07 0.07 0.08 0.04
mean 80 79 77 81 78 81 53 50 44 37 0.01 0.17 0.15 0.10 0.03
s.d. 2 1 4 1 1 8 25 29 9 2 0.00 0.17 0.20 0.14 0.03
The obtained results show that our proposed scheduler slightly outperforms the other schedulers for a variety of different traffic scenarios. The membership functions and fuzzy rules for the FAST are obtained by manual analysis of the performance comparison results. These parameters can be optimized by using more sophisticated methods, such as machine learning algorithms and bio-inspired techniques to adjust the fuzzy parameters that yields an optimal solution. Moreover, the evaluated scenarios in this paper cover only a very small portion of all possible situations, though they take into account more traffic variations than other publications. We are going to build an information model that captures the IEEE 802.16 BS context information by extending the DEN-ng information model [24]. With this model, we aim to build more robust and efficient experimental scenarios.
[9]
[10] [11] [12] [13] [14]
[15]
R EFERENCES [1] Local and metropolitan networks - Part 16: Air interface for fixed broadband wireless access systems, IEEE Std. 802.16-2004, Oct. 2004. [2] System Requirements Document (SRD), IEEE 802.16m 07/002r9, Sep. 2009. [3] M. Shreedhar and G. Varghese, “Efficient fair queuing using deficit round-robin,” IEEE/ACM Transactions on Networking, vol. 4, no. 3, pp. 375–385, Jun. 1996. [4] G. Cheng, K. Xu, and N. Ansari, “Core-stateless proportional fair queuing for AF traffic,” in Proc. 47th IEEE Global Telecommunications Conference (Globecom ’04), Dallas, TX, USA, Nov. 29–Dec. 3, 2004, pp. 732–736. [5] H. Beitollahi, S. G. Miremadi, and G. Deconinck, “Fault-tolerant earliest-deadline-first scheduling algorithm,” in Proc. 21st IEEE International Parallel and Distributed Processing Symposium (IPDPS ’07), Long Beach, CA, USA, Mar. 26–30, 2007, pp. 1–6. [6] N. Raungchaijatupon, L. Wang, and Y. Ji, “A study on the performance of scheduling schemes for broadband wireless access networks,” in Proc. IEEE International Symposium on Communications and Information Technologies 2006 (ISICT ’06), Bangkok, Thailand, Oct. 18–20, 2006, pp. 1008–1012. [7] C. Cicconetti, A. Erta, L. Lenzini, and E. Mingozzi, “Performance evaluation of the IEEE 802.16 MAC for QoS support,” IEEE Transactions on Mobile Computing, vol. 6, no. 1, pp. 26–38, Jan. 2007. [8] J. Lakkakorpi, A. Sayenko, and J. Moilanen, “Comparison of different scheduling algorithms for WiMAX base station: Deficit round-robin vs. proportional fair vs. weighted deficit round-robin,” in Proc. IEEE
[16]
[17] [18] [19] [20]
[21] [22]
[23] [24]
208
File mean 1278 1278 1278 1278 1278 84 93 89 87 86 0.08 0.09 0.11 0.09 0.08
Web s.d. 0 0 0 0 0 7 11 11 5 4 0.02 0.01 0.00 0.03 0.01
mean 124 124 124 124 124 97 107 103 99 99 0.24 0.31 0.19 0.24 0.25
s.d. 0 0 0 1 0 9 15 15 3 3 0.13 0.03 0.05 0.08 0.06
Wireless Communications and Networking Conference 2008 (WCNC ’08), Las Vegas, USA, Mar. 31–Apr. 3, 2008, pp. 1991–1996. P. Dhrona, N. A. Ali, and H. Hassanein, “A performance study of scheduling algorithms in point-to-multipoint wimax networks,” in Proc. 33rd IEEE Conference on Local Computer Networks (LCN ’08), vol. 4786, Montreal, Canada, Oct. 14–17, 2008, pp. 843–850. R. Prasad, C. Dovrolis, M. Murray, and K. Claffy, “Bandwidth estimation: Metrics, measurement techniques, and tools,” IEEE Network, vol. 17, no. 6, pp. 27–35, 2003. B.-Y. Choi, J. Park, and Z.-L. Zhang, “Adaptive random sampling for load change detection,” ACM SIGMETRICS Performance Evaluation Review, vol. 30, no. 1, pp. 272–273, Jun. 2002. C. So-In, R. Jain, and A.-K. Tamimi, “Scheduling in IEEE 802.16e mobile WiMAX networks: Key issues and a survey,” IEEE Journal on Selected Areas in Communications, vol. 27, no. 2, pp. 156–171, 2009. The ns-3 network simulator. [Online]. Available: http://www.nsnam.org/ J. Farooq and T. Turletti, “An IEEE 802.16 WiMAX module for the NS-3 simulator,” in Proc. 2nd International Conference on Simulation Tools and Techniques (SIMUTools ’09), Rome, Italy, Mar. 2–6, 2009, pp. 1–11. M. A. Ismail, G. Piro, L. A. Grieco, and T. Turletti, “An improved IEEE 802.16 WiMAX module for the NS-3 simulator,” in Proc. 3rd International Conference on Simulation Tools and Techniques (SIMUTools ’10), Torremolinos, Malaga, Spain, Mar. 15–19, 2010. Local and metropolitan networks - Part 16: Air interface for fixed broadband wireless access systems Amendment 2: Physical and Medium Access Control Layers for Combined Fixed and Mobile Operation in Licensed Bands, IEEE Std. 802.16e-2005, Feb. 2005. MPEG-4 and H.263 video traces for network performance evaluation. [Online]. Available: http://www.tkn.tu-berlin.de/research/trace/trace.html WiMAX System Evaluation Methodology Version 2.0, WiMAX Forum Std., Dec. 2007. E. H. Mamdani et al., “Application of fuzzy algorithms for control of simple dynamic plant,” in Proc. Iee, vol. 121, no. 12, Dec. 1974, pp. 1585–1588. S. Seo, S.-S. Kim, N. Agoulmine, and J. W.-K. Hong, “On achieving self-organization in mobile wimax network,” in Proc. 5th IEEE/IFIP International Workshop on Braodband Convergence Networks (BCN ’10), Osaka, Japan, Apr. 19, 2010, pp. 43–50. M. Sugeno, Industrial applications of fuzzy control. New York, NY, USA: Elsevier Science Inc., 1985. A. Hamam and N. Georganas, “A comparison of Mamdani and Sugeno fuzzy inference systems for evaluating the quality of experience of Hapto-Audio-Visual applications,” in Proc. IEEE International Workshop on Haptic Audio visual Environments and Games (HAVE ’08), Ottawa, Ontario, Canada, Oct. 18–19, 2008, pp. 87–92. fuzzy-lite: A fuzzy logic library written in C++. [Online]. Available: http://code.google.com/p/fuzzy-lite/ J. Strassner. (2009) “Introduction to DEN-ng”, tutorial for FP7 PanLab II project. [Online]. Available: http://www.autonomic-communication.org/