Fast Computation of the Performance Evaluation of Biometric Systems: Application to Multibiometrics
arXiv:1202.5985v1 [cs.DS] 27 Feb 2012
Romain Giot∗, Mohamad El-Abed, Christophe Rosenberger GREYC Laboratory ENSICAEN - University of Caen Basse Normandie - CNRS 6 Boulevard Mar´ echal Juin, 14000 Caen Cedex - France
Abstract The performance evaluation of biometric systems is a crucial step when designing and evaluating such systems. The evaluation process uses the Equal Error Rate (EER) metric proposed by the International Organization for Standardization (ISO/IEC). The EER metric is a powerful metric which allows easily comparing and evaluating biometric systems. However, the computation time of the EER is, most of the time, very intensive. In this paper, we propose a fast method which computes an approximated value of the EER. We illustrate the benefit of the proposed method on two applications: the computing of non parametric confidence intervals and the use of genetic algorithms to compute the parameters of fusion functions. Experimental results show the superiority of the proposed EER approximation method in term of computing time, and the interest of its use to reduce the learning of parameters with genetic algorithms. The proposed method opens new perspectives for the development of secure multibiometrics systems with speeding up their computation time. Keywords: Biometrics, Authentication, Error Estimation, Access Control
1. Introduction Biometrics [1] is a technology allowing to recognize people through various personal factors. It is an active research field which design new biometric traits from time to time (like finger knuckle recognition [2]). We can classify the various biometric modalities among three main families: ∗ Corresponding
author Email addresses:
[email protected] (Romain Giot),
[email protected] (Mohamad El-Abed),
[email protected] (Christophe Rosenberger)
Preprint submitted to Future Generation Computer Systems (FGCS) - Special Issue on Recent Developments in High Performance C
• Biological : the recognition is based on the analysis of biological data linked to an individual (e.g, DNA, EEG analysis, ...). • Behavioural : the recognition is based on the analysis of the behaviour of an individual while he is performing a specific task (e.g, signature dynamics, gait, ...). • Morphological : the recognition is based on the recognition of different physical patterns, which are, in general, permanent and unique (e.g, fingerprint, face recognition, ...). It is mandatory to evaluate these biometric systems in order to quantify their performance and compare them. These biometric systems must be evaluated in order to compare them, or to quantify their performance. To evaluate a biometric system, a database must be acquired (or a common public dataset must be used). This database must contain as many users as possible to provide a large number of captures of their biometric data. These data are separated into two different sets: • the learning set which serves to compute the biometric reference of each user • the validating set which serves to compute their performance. When comparing test samples to biometric references, we obtain two different kinds of scores: • the intrascores represent comparison scores between the biometric reference (computed thanks to the learning set) of an individual and biometric query samples (contained in the validating set) • the interscores represent comparison scores between the biometric reference of an individual and the biometric query samples of the other individuals. From these two sets of scores, we can compute various error rates, from which the EER is one functioning point which represents a very interesting error rate often used to compare biometric systems. In order to have reliable results, it is necessary to evaluate the performance of biometric system with huge datasets. These huge datasets produce numbers of scores. As the time to evaluate the performance of a biometric system depends on the quantity of available scores, we can see that evaluation may become very long on these large datasets. In this paper, we present a very fast way to compute this error rate, as well as its confidence interval in a non parametric way, on different datasets of the literature. Nevertheless, there will always be users for which one modality (or method applied to this modality) will give bad results. These low performances can be implied by different facts: the quality of the capture, the acquisition conditions, or the individual itself. Biometric multi-modality (or multibiometrics) allows to 2
compensate this problem while obtaining better biometric performances (i.e., better security by accepting less impostors, and better usability by rejecting less genuine users) by expecting that the errors of the different modalities are not correlated. So, the aim of multibiometrics is to protect logical or physical access to a resource by using different biometric captures. We can find different types of multibiometrics systems. Most of them are listed in [3], they use: 1. Different sensors of the same modality (i.e., capacitive or resistive sensors for fingerprint acquisition); 2. Different representations of the same capture (i.e., use of points of interest or texture); 3. Different biometric modalities (i.e., face and fingerprint); 4. Several instances of the same modality (i.e., left and right eye for iris recognition); 5. Multiple captures (i.e., 25 images per second in a video used for face recognition); 6. An hybrid system composed of the association of the previous ones. In the proposed study, we are interested in the first four kinds of multimodality. We also present in this paper, a new multibiometrics approach using various fusion functions parametrized by genetic algorithms using a fast EER (Equal Error Rate) computing method to speed up the fitness evaluation. This paper is related to high performance computing, because algorithms are designed to work in an infrastructure managing the biometric authentication of millions of individuals (i.e., border access control, logical acces control to webservices). To improve the recognition rate of biometric systems, it is necessary to regularly update the biometric reference to take into account intra class variability. With the proposed approach, the time taken to update the biometric reference would be lowered. The faster is the proposed method, the more we can launch the updating process (or the more users we can add to the process). We also propose an adaptation of the proposed EER computing method which gives confidence intervals in a non parametric way (i.e., by computing the EER several times through a bootstraping method). The confidence intervals are computed on a single CPU, on several CPUs on the same machine and on several machines. The main hints of the papers are: • the proposition of a new method to approximate the EER and its confidence interval in a fast way • the proposition of two original functions for multibiometrics fusion. The plan is organized as following. Section 2 presents the background of the proposed work. Section 3 presents the proposed method for computing the approximated value of the EER and its confidence interval. Section 4 validates them. Section 5 presents the proposed multibiometrics fusion functions and their performance in term of biometric recognition and computation time against the baseline. Section 6 gives perspectives and conclusions of this paper. 3
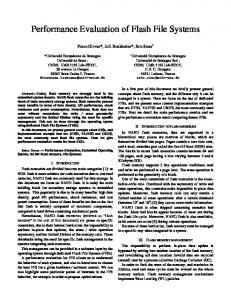
2. Background 2.1. Evaluation of Biometric Systems Despite the obvious advantages of this technology in enhancing and facilitating the authentication process, its proliferation is still not as much as attended [4]. As argued in the previous section, biometric systems present several drawbacks in terms of precision, acceptability, quality and security. Hence, evaluating biometric systems is considered as a challenge in this research field. Nowadays, several works have been done in the literature to evaluate such systems. Evaluating biometric systems is generally realized within three aspects as illustrated in figure 1: usability, data quality and security. Evaluation of Biometric systems
Data quality
Usability
Quantitative
Efficiency
Security
Qualitative
Effectiveness
Acceptance and User Satisfaction
Figure 1: Evaluation aspects of Biometric Systems.
2.1.1. Usability According to the International Organization for Standardization ISO 13407:1999 [5], usability is defined as “The extent to which a product can be used by specified users to achieve specified goals with effectiveness, efficiency, and satisfaction in a specified context of use”. • Efficiency which means that users must be able to accomplish the tasks easily and in a timely manner. It is generally measured as task time; • Effectiveness which means that users are able to complete the desired tasks without too much effort. It is generally measured by common metrics include completion rate and number of errors such failure-to-enroll rate (FTE) [6]; • User satisfaction which measures users’ acceptance and satisfaction regarding the system. It is generally measured by studying several properties such as easiness to use, trust in the system, etc. The acceptability 4
of biometric systems is affected by several factors. According to [7], some members of the human-computer interaction (HCI) community believe that interfaces of security systems do not reflect good thinking in terms of creating a system that is easy to use, while maintaining an acceptable level of security. Existing works [8, 9] show also that there is a potential concern about the misuse of personal data (i.e., templates) which is seen as violating users’ privacy and civil liberties. Moreover, one of our previous work [10] shows the necessity of taking into account users’ acceptance and satisfaction when designing and evaluating biometric systems. More generally speaking, even if the performance of a biometric system outperformed another one, this will not necessarily mean that it will be more operational or acceptable;
2.1.2. Data quality It measures the quality of the biometric raw data [11, 12]. Low quality samples increase the enrollment failure rate, and decrease system performance. Therefore, quality assessment is considered as a crucial factor required in both the enrollment and verification phases. Using quality information, the bad quality samples can be removed during enrollment or rejected during verification. Such information could also be used in soft biometrics or multimodal approaches [13]. Such type of assessment is generally used to quantify biometric sensors, and could be also used to enhance system performance;
2.1.3. Security It measures the robustness of a biometric system (algorithms, architectures and devices) against attacks. Many works in the literature [14, 15, 16] show the vulnerabilities of biometric systems which can considerably decrease their security. Hence, the evaluation of biometric systems in terms of security is considered as an important factor to ensure its functionality. The International Organization for Standardization ISO/IEC FCD 19792 [17] addresses the aspects of security evaluation of such systems. The report presents an overview of biometric systems vulnerabilities and provide some recommendations to be taking into account during the evaluation process. Nowadays, only few partial security analysis studies with relation to biometric authentication systems exist. According to ISO/IEC FCD 19792 [17], the security evaluation of biometric systems is generally divided into two complementary assessments: 1) assessment of the biometric system (devices and algorithms) and 2) assessment of the environmental (for example, is the system is used indoor or outdoor?) and operational conditions (for example, tasks done by system administrators to ensure that the claimed identities during enrolment of the users are valid). A type-1 security assessment method is presented in a personal previous work [18]. The proposed method has shown its efficiency in evaluating and comparing biometric systems.
5
2.2. Performance Evaluation of Biometric Systems The performance evaluation of biometric systems is now carefully considered in biometric research area. We need a reliable evaluation methodology in order to put into obviousness the benefit of a new biometric system. Nowadays, many efforts have been done to achieve this objective. We present in section 2.2.1 an overview of the performance metrics, followed by the research benchmarks in biometrics as an illustration of the evaluation methodologies used in the literature for the comparison of biometric systems. 2.2.1. Performance metrics By contrast to traditional methods, biometric systems do not provide a cent per cent reliable answer, and it is quite impossible to obtain such a response. The comparison result between the acquired biometric sample and its corresponding stored template is illustrated by a distance score. If the score is lower than the predefined decision threshold, then the system accepts the claimant, otherwise he is rejected. This threshold is defined according to the security level required by the application. Figure 3 illustrates the theoretical distribution of the genuine and impostor scores. This figure shows that errors depend from the used threshold. Hence, it is important to quantify the performance of biometric systems. The International Organization for Standardization ISO/IEC 19795-1 [6] proposes several statistical metrics to characterize the performance of a biometric system such as: • Failure-to-enroll rate (FTE): proportion of the user population for whom the biometric system fails to capture or extract usable information from biometric sample; • Failure-to-acquire rate (FTA): proportion of verification or identification attempts for which a biometric system is unable to capture a sample or locate an image or signal of sufficient quality; • False Acceptation Rate (FAR) and False Rejection Rate (FRR): FAR is the proportion of impostors that are accepted by the biometric system, while the FRR is the proportion of authentic users that are incorrectly denied. The computation of these error rates is based on the comparison of the scores against a threshold (the direction of the comparison is reversed if the scores represent similarities instead of distances). FRR and FAR are respectively computed (in the case of a distance score) as in (1) and (2), where intrai (respectively interi ) means the intra score at position i in the set of intra score (respectively inter score at position i) and Card(set) is the cardinal of the set in argument, thr is the decision threshold, and 1 is the indicator function. P F RR =
1{score > thr} Card(intra)
score∈intra
6
(1)
P F AR =
1{score ≤ thr} Card(intra)
score∈inter
(2)
• Receiver operating characteristic (ROC) curve: the ROC curve is obtained by computing the couple of (FAR, FRR) for each tested threshold. It plots the FRR versus the FAR. The aim of this curve is to present the tradeoff between FAR and FRR and to have a quick overview of the system performance and security for all the parameters configurations. • Equal error rate (EER): it is the value where both errors rates, FAR and FRR, are equals (i.e., FAR = FRR). It constitutes a good indicator, and the most used, to evaluate and compare biometric systems. In other words, lower the EER value is, higher the accuracy of the system. Using the ROC curve, the EER is computed by selecting the couple of (FAR, FRR) having the smallest absolute difference (3) at the given threshold τ : τ = argmin(abs(F ARτ − F RRτ )), ∀τ ⊂Card{ROC} τ
and returning their average (3): EER =
F ARτ + F RRτ 2
(3)
By this way, we have obtained the best approaching EER value with the smallest precision error. The classical EER computing algorithm is presented in the Figure 2 1 . From Figure 2, we can see that the complexity is in O(n ∗ m) with n the number of thresholds held in the computation, and, m the number of scores in the dataset. As it is impossible to reduce m, we have to find a better method which reduces n. We did not find, in the literature, methods allowing to reduce computation time in order to obtain this EER.
2.2.2. Biometrics Datasets A public dataset allows researchers to test their algorithm and compare them with those from the state of the art. It takes a lot of time and energy to build a large and significant dataset. It is very convenient to download one for research purposes. We present in this section an overview of the used datasets in this paper. Table 1 presents a summary of these datasets. 1 another, slower, way of computing would be to test each unique score of the intrascores and interscores sets, but this would held a too important number of iterations. We named it “whole” later in the paper.
7
ROC ← [] EER ← 1.0 DIF F ← 1.0 ST ART ← min(scores) EN D ← max(scores) for τ ST ART to EN D in N steps do F AR ← compute F AR for τ F RR ← compute F RR for τ append (F AR, F RR) to ROC if abs(F AR − F RR) < DIF F then DIF F ← abs(F AR − F RR) EER ← (F AR + F RR)/2 end if end for return EER, ROC
Figure 2: Classical EER computing algorithm.
Figure 3: Distribution of genuine users and impostor scores. • Biometric Scores Set - Release 1 (BSSR1) The BSSR1 [19] database is an ensemble of scores sets from different biometric systems. In this study, we are interested in the subset containing the scores of two facial recognition systems and the two scores of a fingerprint recognition system applied to two different fingers for 512 users. This database has been used many times in the literature [20, 21]. • BANCA The second database is a subset of scores produced from the BANCA database [22]. The selected scores correspond to the following one labelled: 1. IDIAP voice gmm auto scale 25 100 pca.scores 8
2. SURREY face nc man scale 100.scores 3. SURREY face svm man scale 0.13.scores 4. UC3M voice gmm auto scale 10 100.scores The database as two subsets G1 and G2. G1 set is used as the learning set, while G2 set is used as the validation set. • PRIVATE The last database is a chimeric one we have created for this purpose by combining two public biometric template databases: the AR [23] for the facial recognition and the GREYC keystroke [24] for keystroke dynamics [25, 26]. The AR database is composed of frontal facial images of 126 individuals under different facial expressions, illumination conditions or occlusions. These images have been taken during two different sessions with 13 captures per session. The GREYC keystroke contains the captures on several sessions on two months of 133 individuals. Users were asked to type the password ”greyc laboratory” 6 times on a laptop and 6 times on an USB keyboard by interlacing the typings (one time on a keyboard, one time on another). We have selected the first 100 individual of the AR database and we have associated each of these individuals to another one in a subset of the GREYC keystroke database having 5 sessions of captures. We then used the 10 first captures to create the biometric reference of each user and the 16 others to compute the intra and inter scores. These scores have been computed by using two different methods for the face recognition and two other ones for the keystroke dynamics. Table 1: Summary of the different databases used to validate the proposed method Nb of users intra tuples inter tuples items/tuples
BSSR1 512 512 261632 4
PRIVATE 100 1600 158400 5
BANCA 208 467 624 4
2.3. Multibiometrics We focus in this part on the state of the art on multimodal systems involving biometric modalities usable for all computers (keystroke, face, voice...). The scores fusion is the main process in multimodal systems. It can be operated on the scores provided by algorithms or in the templates themselves [27]. In the first case, it is necessary to normalize the different scores as they may not evolve in the same range. Different methods can be used for doing this, and the most efficient methods are zscore, tanh and minmax [28]. Different kinds of fusion methods have been applied on biometric systems. The fusion can be
9
done with multiple algorithms of the same modality. For example, in [29], three different keystroke dynamics implementations are fused with an improvement of the EER, but less than 40 users are involved in the database. In [30], two keystroke dynamics systems are fused together by using weighted sums for 50 users, but no information on the weight computing is provided. The fusion can also be done within different modalities in order to improve the authentication process. In [31], authors use both face and fingerprint recognition, the impact of error rate reduction is used to reduce the error when adapting the user’s biometric reference. There is only one paper (to our knowledge) on keystroke dynamics fusion with another kind of biometric modality (voice recognition): it is presented in [32], but only 10 users are involved in the experiment. In [33], multi-modality is done on fingerprints, speech, and face images on 50 individuals. Fusion has been done with SVM [34] with good improvements, especially, when using user specific classifiers. Very few multimodal systems have been proposed for being used in classical computers and the published ones have been validated on small databases. In order to contribute to solve this problem, we propose a new approach in the following section. 3. Fast EER and Confidence Intervals Estimation We propose a kind of dichotomic EER computing function, in order to quickly approximate its value. Thanks to this computing speed up, we can use it in time consuming applications. Finally, we present a confidence interval computing method based on our approximated EER calculation associated to parallel and distributed computing. 3.1. EER Estimation Computation time to get the EER can be quite important. When the EER value needs to be computed a lot of time, it is necessary to use a faster way than the standard one. In the biometric community, the shape of the ROC curve always follows the same pattern: it is a monotonically decreasing function (when we present FRR against FAR, or increasing when we present 1-FRR against FAR) and the EER value is the curve’s point having xROC = yROC (or F AR = F RR). Thanks to this fact, the curve symbolising the difference of yROC against xROC is also a monotonically decreasing function from 1 to −1, where the point at yDIF F = 0 represents the EER (and its value is xDIF F because xROC = yROC or F AR = F RR). With these information, we know that to get the EERs, we need to find the xDIF F for which yDIF F is the closest as possible to zero. An analogy with the classical EER computing, would be to incrementally compute yDIF F for each threshold by increasing order and stop when yDIF F changes of sign. By this way, we can expect to do half thresholds comparisons than with the classical way if scores are correctly distributed. A clever way is to use something equivalent to a divide and conquer algorithm like the binary search and obtain a mean complexity closer to O(log(n)). That is why we have implemented a polytomous version of EER computing: 10
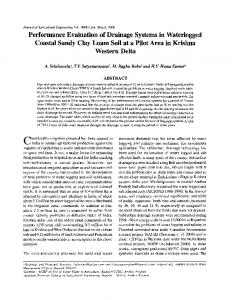
1. We chose i thresholds linearly distributed on the scores sets 2. For each threshold t among the i thresholds, we compute the FAR and FRR values (F ARt , F RRt ) 3. We take the two following thresholds t1 and t2 having sign(F RRt1 − F ARt1 ) different of sign(F RRt2 − F ARt2 ) 4. We repeat step 2 with selecting i thresholds between t1 and t2 included while F RRt1 − F ARt1 ) does not reach the attended precision. By this way, the number of threshold comparisons is far smaller than in the classical way. Its complexity analysis is not an easy task because it depends both on the attended precision and the choice of i. It can be estimated as O(log(N )). Figure 4 presents the algorithm while Figure 5 illustrates it by showing the different iterations until getting the EER value with a real world dataset. We have chosen i = 5 points to compute during each iteration. The EER is obtained in five iterations. Circle symbols present the points computed at the actual iteration, triangle symbols present the points computed at the previous iterations, and the dotted curve presents the ROC curve if all the points are computed. Very few points are computed to obtained the EER value. Figure 5f presents the real ROC curve and the ROC curve obtained with the proposed method. We can see that even if we obtain an approximated version of the real ROC curve, it is really similar around the EER value (cross with the dotted lined).
11
ROC ← [] CACHE ← {} ST ART ← min(scores) EN D ← max(scores) while True do for T HRESHOLD from ST ART to EN D in N steps do SDIF F ← [] T HRESHOLDS ← [] if not empty CACHE[T HRESHOLD] then F AR, F RR ← CACHE[T HRESHOLD] else F AR ← compute F AR for T HRESHOLD F RR ← compute F RR for T HRESHOLD append (F AR, F RR) to ROC CACHE[T HRESHOLD] ← (F AR, F RR) end if if abs(F AR − F RR) < P RECISION then EER ← (F AR + F RR)/2 return EER, ROC end if append F AR − F RR to SDIF F append T HRESHOLD to T HRESHOLDS end for P ST ART ← −1 P EN D ← −1 for P IV OT = 0 to ST EP S − 1 do if sign(SDIF F [P IV OT ]) 6= sign(SDIF F [P IV OT + 1]) then P ST ART ← P IV OT P EN D ← P IV OT + 1 break end if end for{PSTART and PEND are set} ST ART ← T HRESHOLDS[P ST ART ] EN D ← T HRESHOLDS[P EN D] end while
Figure 4: Fast EER Computing Algorithm
12
(a) Iteration 1
(b) Iteration 2
(c) Iteration 3
(d) Iteration 4
(e) Iteration 5
(f) ROC curve
Figure 5: Points computed by the proposed algorithm when i = 5. In this case, the EER value is found in five iterations. Each image represents an iteration, with: the real ROC curve, the points computed at the iteration and the points computed at the previous iteration (different thresholds may produce the same points).
13
3.2. Confidence Intervals Estimation We also provide a method to compute the confidence interval of the EER value. It is based on a bootstrapping method and can be used in a parallelized way. 3.2.1. Bootstrapping It is interesting to give a confidence interval of an EER value, because we are not totally sure of its value. One way is to obtain this confidence interval parametrically, but it requires to have strong hypothesis on the function of the EER value (the scores come from independant and identically distributed variables, even for the scores of the same user). As such assumption is too strict (and probably false), it is possible to use non parametric confidence intervals. One of these non parametric methods is called “bootstrap” [35]. Such method is often used when the distribution is unknown or the number of samples is too low to correctly estimates the interval. The main aim is to re-sample the scores several times, and, compute the EER value for each of these re-sampling. The boostraping method works as following: 1. Use the intra and inter scores to compute the EER χ. ˆ 2. Resample K times the intra and inter scores and store them in intrai and interi (0 < i