R137, page 1
FAULT DETECTION BASED ON MOTOR START TRANSIENTS AND SHAFT HARMONICS MEASURED AT THE RTU ELECTRICAL SERVICE Peter R. Armstrong 1, Chris R. Laughman, Steven B. Leeb, Leslie K. Norford MIT 5-418, 77 Massachusetts Ave., Cambridge, MA 02139 ABSTRACT Non-intrusive load monitoring (NILM) is accomplished by sampling voltage and current at high rates and reducing the resulting start transients or harmonic content to concise load “signatures.” Changes in these signatures can be used to detect, and possibly diagnose, equipment and component faults associated with roof-top cooling units. NILM-based fault detection and diagnosis (FDD) is important because 1) it complements other FDD schemes that are based on thermo-fluid sensors and analyses and 2) it is minimally intrusive (one measuring point in the relatively protected confines of the control panel) and therefore inherently reliable. This paper describes changes in the power signatures of fans and compressors that were found, experimentally and theoretically, to be useful for fault detection.
1. INTRODUCTION Hardware and control failures represent a large fraction of U.S. HVAC operational costs (Katipamula and Gaines 2003). Comfort and consequent productivity loss may represent significant additional costs. Unitary equipment appears to be just as susceptible to performance degradation as built-up systems (Breuker 1998a). Roof-top unit (RTU) faults often go undetected by occupants and maintenance staff. A “wait for complaints” strategy is often taken in spite of its many well known negative side effects. There are two generally accepted paths to correcting this situation: 1) test-and-measurement-based preventive maintenance 2 and 2) automated on-line fault detection. The key to cost-effective on-line fault detection and diagnosis (FDD) is finding the optimal mix of sensors and automated analysis for a given target system. Much attention has focused on temperature-measurement based fault detection because of low sensor cost (Rossi and Braun 1997). However, temperature sensor location is critical; sensors must be installed in specific locations regardless of the resulting susceptibility to harsh environments or damage during inspection and service activities. Consequently, more expensive but less intrusive sensor types, such as pressure and power, may be justified by improved reliability. A device called the non-intrusive load monitor (NILM) is extremely well suited to the tasks of measuring and analyzing electrical signals (Leeb 1992, Shaw et al. 1998, Laughman et al. 2003) that may be useful in fault detection. Results of recent tests, reported here, show that some RTU thermo-fluid faults can be detected by the NILM alone. Certain mechanical (motor and fan) faults and most electrical (supply, controls, motor) faults can also be detected. In this paper, previous research is reviewed, and the responses to faults (artificially introduced in an operating unit) of steady and transient electrical loads are characterized. New methods of detecting bypass leakage, fan imbalance, and liquid ingestion faults are described and fault detection implementation issues are discussed.
2. PREVIOUS RESEARCH The frequency of faults in unitary cooling equipment has been assessed from substantial insurance claim and service record data bases by Stouppe and Lau (1989) and Breuker and Braun (1998a). Stouppe and Lau (1989) compiled 15,716 failure records and attribute 76% of faults to electrical components, 19% to mechanical and 5% to refrigerant circuit components. Of the electrical failures 87% were motor winding failures from deterioration of insulation (vibration, overheating) unbalanced operation and short cycling (overheating). The reported numbers refer to events; costs of repair were not published. Rossi and Braun (1993) reviewed various detection and diagnostic methods and later (1997) developed effective rule-based methods. Rossi (1997), Rossi and Braun (1997) and Breuker and Braun (1998a, 1998b) applied detection, diagnosis and evaluation methods and performed statistical analyses of detection sensitivity at specific fault levels. Two prototype 1 2
Armstrong is on educational leave from PNNL and can be reached at
[email protected] 617-452-2286 Including such concepts as re-commissioning or continuous commissioning
International Refrigeration and Air Conditioning Conference at Purdue, July 12-15, 2004
R137, page 2
systems, designated the low-cost system (2 temperature inputs, 5 outputs) and the high-performance system (3 inputs, 7 outputs), were developed and fault detection (without excessive false alarm rates) was generally found to be effective when capacity and COP dropped by 10 to 20% for five common mechanical faults: Refrigerant leakage, undercharge or overcharge; Liquid line restriction; Loss of volumetric efficiency (leaky valves, seals); Fouled condenser coil; Dirty supply air filter.
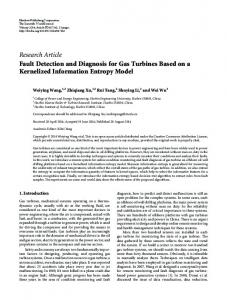
3. FAULT TESTING AND ANALYSIS Of the five faults noted above, NILM detection was attempted for all but the liquid-line-restriction fault. Purely electrical faults were not tested. Contact erosion and bounce have already been successfully tested (Shaw 2000). Detection of an unbalanced three-phase voltage condition (failure of any phase to maintain a preset threshold voltage for a preset number of cycles while the other two hold up) is completely straightforward. Two new mechanical faults, rotor imbalance and flooded start/liquid ingestion, were therefore selected for testing. Detection was based on analysis of real (P1) and reactive power (Q1), computed from measurements of voltage and current. Evaporator and condenser blockage were artificially introduced by inserting strips of cardboard against the heat exchanger inlet face. This achieved a quasi-uniform flow distribution of known blockage factor. Refrigerant overand undercharge conditions were achieved by evacuating the system, then adding a known mass of refrigerant to obtain the desired level of charge. Leaky valves or seals were mimicked by opening the hot bypass valve a specific amount and making repeated compressor starts. Fan imbalance was artificially introduced by adding small weights of known mass near the rotor tip at one point on the circumference. For the supply fan, binder clips were fastened to a vane from inside the squirrel cage. For the condenser, a known mass was affixed at the tip of one blade. 3.1 Short Cycling Compressor start transients with no pressure relief between starts and with the fans turned off are shown in Figure 1. The compressor cycling frequency of about three starts per minute is much higher than the shortest cycling frequency of normal operation and is therefore representative of a short-cycling fault. The main difference between start traces is that the final value of P1 (time index >50) increases with successive starts, a phenomenon not seen with pressure relief between starts. 8000 compfile1 7000
A-phase P1 (W)
6000 5000 4000 3000 2000 1000 0 time (sampled at 120 Hz) -1000
0
20
40
60
80
100
120
140
160
180
200
Figure 1. Five compressor starts with no pressure relief. 3.2 Refrigerant Charge Evaporator and condenser capacity are adversely affected by incorrect refrigerant charge. The system can be overcharged or undercharged. In either case, excessive portions of the evaporator or condenser are relegated to sensible, rather than boiling or condensing, modes of heat transfer. With undercharge there is too much vapor being superheated in the evaporator and desuperheated in the condenser. With overcharge too much liquid collects in the condenser and there is also danger of liquid ingestion into the compressor. The TXV can maintain capacity only at
International Refrigeration and Air Conditioning Conference at Purdue, July 12-15, 2004
R137, page 3
the expense of increased volumetric flow, in the case of undercharge, and increased pressure ratio in both cases. Thus increased compressor power is a symptom of both under- and over-charge. In some cases suction pressure will be too high for the TXV to maintain capacity and loss of capacity will be an additional symptom, albeit not observable by the NILM. Figure 2 illustrates the increase in compressor power for overcharge. With undercharge, however, power does not quickly settle to a steady value, as shown by the mean P1 transient for each fault level in Figure 3. 7000
pf03 and pf05 P1(W)
6000 5000 4000 3000 2000 1000 0 time index (sampled at 120Hz) -1000
0
20
40
60
80
100
120
140
160
180
200
Figure 2. Compressor start transients: lower traces normal, upper with 20% overcharge. 7000
pf03 and pf05 P1(W)
6000 5000 4000 3000 2000 1000 0 time index (sampled at 120Hz) -1000
0
20
40
60
80
100
120
140
160
180
200
Figure 3. Real power start transients, mean of repetitions for each fault level: normal charge (solid), 20% undercharge (dotted), and 20% overcharge (dashed). Detection sensitivity and false alarm rate can be estimated from the test samples of mean P1 and Q1. Detection can be based on P, Q, or one of the derived parameters, R = (P2 + Q2)½, or phase angle, A= tan-1(P,Q). The estimated population distribution for P1, assumed to be Gaussian, is plotted in Figure 4. Sample size is an important factor in detection. One advantage of on-line fault detection is that the parameters for the no-fault condition can be established with relatively high confidence because, in a new RTU, there will usually be a large number of observations, n, before a fault occurs and uncertainty is proportional to n-½. The vertical dashed line in Figure 4 indicates the sample mean for the no-fault condition. If this mean value were confirmed after many fault-free observations, the probability that the new mean indicated for one of the fault conditions (based on the indicated number of post-fault observations) is truly different from the fault-free mean is given by the area under the distribution minus the area of the tail on the other side of the vertical line. The NILM can be programmed to implement standard tests (Wild and Seber 2000) for change of sample mean given actual sample sizes for the faultfree and post-fault observations that have accumulated at any given time. We did not assess in these tests the variation of steady-state compressor power that occurs with operating conditions. The observed changes in compressor power alone cannot, therefore, be attributed to a particular fault (overcharge versus undercharge) or distinguished from normal variations in capacity. Discharge-suction pressure difference or condensing and evaporating temperatures could be used to normalize for conditions.
International Refrigeration and Air Conditioning Conference at Purdue, July 12-15, 2004
R137, page 4
relative frequency
4
3
2
1
0 1500
2000
2500
3000
3500
4000
4500
5000
P(W)
Figure 4. Estimated distributions of steady-state power: normal charge (solid), 20% undercharge (dotted), and 20% overcharge (dashed). Because only a small portion of the tail of the 20% overcharge envelope (centered at 3009W) crosses the no-fault mean (2542W), detection at 20% overcharge will be almost immediate (~10 starts) once the normal-charge mean has been well established. Undercharge is more distinct but settling time is much longer. 3.3 Compressor Back Leakage Start transients were recorded (4 repetitions) for the compressor/condenser fan with hot bypass and two more start transients were recorded with the bypass closed as shown in Figure 5. The transients with no bypass are the top two. The amplitude difference when the motor is developing peak torque (0.2-0.5s from initial contact) is much greater than the steady-state amplitude difference and, moreover, the shapes of the faulty and fault-free start transients are distinctly different. A simple model, in which evaporator and condenser vapor masses are the only state variables, explains the observed behavior (Armstrong 2004). With a leak fault, condenser pressure builds more slowly until the vapor reaches the saturated condition. Evaporator vapor is already saturated so pressure is initially almost constant, thus initial suction density and flow rate are the same for both cases. With similar mass flow rates, less head translates to lower power initially. At steady state, suction flow rate is higher for the faulty case due to higher evaporator pressure. Despite loss of capacity, with higher flow rate and lower head there is little change in steady state compressor input power.
5000
P1 (W)
4000 3000 2000 1000 0 time index (sampled at 120Hz) -1000
0
50
100
150
200
250
Figure 5. Compressor/condenser active power with bypass leakage (bottom four traces) and without (top two traces). 3.4 Flow Blockage On the air side, reduced flow (blockage or restriction) is one of the main faults of interest. Condenser fan start transients were measured at three levels of blockage: 0%, 14% and 39% of coil face area. The compressor was locked out and 6-8 repetitions were made at each fault level. Figures 6 and 7 show the mean power, P1, and staticpressure transients for each fault level. Population distributions for P1, derived from the sample mean and variance and assumed to be Gaussian, are plotted in Figure 8. which shows that the lower level of blockage can be detected once the no-blockage mean power is established. Condenser fan power is a good fault detection criterion because it is normally quite constant. Use of temperature-rise based detection, on the other hand, is problematic for the condenser fan blockage fault. Both inlet and outlet sensors are exposed to the elements. The inlet (ambient) temperature sensor in particular is susceptible to radiation, icing, and wet-bulb bias type errors.
International Refrigeration and Air Conditioning Conference at Purdue, July 12-15, 2004
R137, page 5
900 800 700
P1 (W)
600 500 400 300 200 100 time index (sampled at 120Hz) 0
0
50
100
150
200
250
300
350
400
Figure 6. Condenser fan real power start transients, mean of repetitions for each fault level: 0% blockage (solid), 14% blockage (dotted), and 39% blockage (dashed). 0.7
Static Pressure (in.WC)
0.6 0.5 0.4 0.3 0.2 0.1 0 time index (sampled at 120Hz) -0.1
0
50
100
150
200
250
300
350
400
Figure 7. Condenser fan pressure start transients, mean of repetitions for each fault level: 0% blockage (solid), 14% blockage (dotted), and 39% blockage (dashed).
relative frequency
0.2
0.15
0.1
0.05
0 340
350
360
370
380
390
400
410
P1(W)
Figure 8. Estimated pdfs of steady power: 0% blockage (solid), 14% blockage (dotted), and 39% blockage (dashed). Supply-fan start transients were measured with four levels of blockage: 0%, 10%, 50% and 100% of coil face area. Six to eight repetitions were made at each fault level. In contrast to the condenser fan response, supply fan power and reactive power both decrease with increasing blockage. This is a consequence of differences in fan curves and the points on those curves that correspond to the respective no-blockage conditions. Moreover, in the case of the supply fan, detection of a blockage is best accomplished by testing the hypothesis that both the reactive and real components of steady-state electrical load have deviated from the established no-fault mean values. As shown in Figure 9, it appears that a 10% blockage can be readily detected. However, variations in system resistance resulting from air density changes (Armstrong 1983) upstream or downstream of the fan and changing damper settings may
International Refrigeration and Air Conditioning Conference at Purdue, July 12-15, 2004
R137, page 6
result in substantial uncertainty in the no-fault means. Further work is needed to understand if the supply fan blockage fault is truly amenable to detection by NILM in the face of such ubiquitous system disturbances.
relative frequency
0.2
0.15
0.1
0.05
0 405
410
415
420
425 430 Q1(VAR)
435
440
445
450
Figure 9. Estimated pdfs of supply fan reactive power: 0% blockage (solid), 10% (…), 50% (.-), 100% (--). 3.5 Load Spectra With Artificially Introduced Imbalance Faults The condenser fan and supply fan are susceptible to faults that result in impeller or rotor imbalance, vibrations, and associated periodic variations in motor load. Such load variations can be detected by the NILM. Supply fans are typically of the squirrel cage type with direct or belt drive. Imbalance can result from a bent impeller air foil, dirt accumulation or from a foreign object, e.g. piece of filter material, becoming lodged inside the impeller cage. Although not explored here, a bent shaft or damaged sheave will result in periodic motor load variations that can be easily detected and it is likely that serious belt wear can also be detected. Condenser fans are typically of the direct drive axial type with a three- or four-bladed impeller. A cracked blade or blade root is the most common serious fault. A slightly bent blade or shaft or the accretion of dirt will also lead to imbalance and, eventually, to mechanical failure. Early detection is important because the cost to repair collateral damage to a motor or condenser is much higher than the cost to replace a fan impeller. Periodic load variations may be detected by Fourier decomposition of the power signal, P1. For the condenser fan, the interaction of unbalanced impeller rotation with one of the lower frequency modes in the RTU structure results in a amplitude spectrum peak at 18.4 to 18.7Hz that is very sensitive to fault level as shown in Figure 10. Note that the frequency of this peak drops moderately as imbalance is increased. Figure 11 shows a similar effect of load imbalance for the supply fan. The results for both the supply and condenser fans show that the existence and relative level of imbalance faults can be obtained from signals measured by the standard NILM platform. Appropriate scaling factors for reporting actual fault levels can be determined for a given RTU design by exactly the type of simple test performed here.
amplitude (% of P1)
20
15
10
5
0 18
18.1
18.2
18.3
18.4
18.5 f (Hz) 18.6
18.7
18.8
18.9
19
Figure 10. Detail of the FFT (18-19Hz band) of condenser fan power (P1) with 0g (solid), 2.6g (dashed) and 5.3g (dotted) imbalance fault levels.
International Refrigeration and Air Conditioning Conference at Purdue, July 12-15, 2004
R137, page 7
am plitude (% of P 1)
25 20 15 10 5 0 18.4
18.5
18.6
18.7
18.8
18.9 freq (Hz) 19
19.1
19.2
19.3
19.4
Figure 11. Detail of the FFT (18.4-19.4Hz band) of supply fan power (P1) with 0g (solid), 8g (dashed) and 16g (dotted) imbalance fault levels. 3.6 Compressor Liquid Ingestion Compressor damage by liquid ingestion is likely to be preceded by one or more incidents in which small, relatively inconsequential, amounts of liquid enter the machine 3. The NILM’s ability to detect flooded starts and liquid slugging was tested in the lab by introducing a known, repeatable mass of liquid at the suction port of a small semihermetic compressor. The mean of five wet (1 cc oil) and five dry start transients are shown in Figure 12. While the difference is visually small, the shape of the difference, Figure 13, shows that reliable detection is possible, with power peaks occurring only during the compression stroke; a similar shape was found for the injection of 3 cc of liquid R-30 refrigerant.
P1 mean of reps (W)
5000
4000
3000
2000
1000 time index (sampled at 120Hz) 10
20
30
40
50
60
70
80
Figure 12. Mean of repetitions with no fault (solid) and 1.0 cc liquid ingestion (dotted). 250
P1 innovation (W)
200 150 100 50 0
time index (sampled at 120Hz) 10
20
30
40
50
60
70
80
Figure 13. Mean deviation of P1 for starts with 1.0 cc liquid from P1 for fault free starts. 3
An amount of liquid that fills the clearance volume, about 2% of displacement, can cause damage.
International Refrigeration and Air Conditioning Conference at Purdue, July 12-15, 2004
R137, page 8
Another type of liquid ingestion fault involves liquid entering the compressor during steady operation. This might be caused by an intermittent TXV fault. To observe this effect, equal doses of oil were injected, at the rate of about one injection every 20s, during steady operation. A series of five events was observed with 1.0 cc oil injected at the suction port for each event. The P1 transients observed in the test are plotted (superimposed) in Figure 14. Compressor power increases briefly (by about 15W (2.5%) for 300ms) and then returns gradually to normal. Note that a reciprocating compressor presents a cyclic load component corresponding to shaft speed because more torque is required during suction and compression than when the crank is taking the pistons through their top and bottom positions. The shaft speed cycle interacts with line frequency to produce strong beats, evident in Figure 14 at 3.6Hz. 690
ka18 P1Q
680 670
P1 (W)
660 650 640 630 620 610 time index (sampled at 120Hz) 600
0
100
200
300
400
500
600
700
Figure 14. Real power during steady run liquid ingestion, five repetitions. The effect on P1 of ingesting non-damaging amounts (