Fault Detection Effectiveness of Source Test Case Generation Strategies for Metamorphic Testing Prashanta Saha
Upulee Kanewala∗
School of Computing, Montana State University Bozeman, Montana
[email protected]
School of Computing, Montana State University Bozeman, Montana
[email protected]
arXiv:1802.07361v1 [cs.SE] 20 Feb 2018
ABSTRACT Metamorphic testing is a well known approach to tackle the oracle problem in software testing. This technique requires the use of source test cases that serve as seeds for the generation of follow-up test cases. Systematic design of test cases is crucial for the test quality. Thus, source test case generation strategy can make a big impact on the fault detection effectiveness of metamorphic testing. Most of the previous studies on metamorphic testing have used either random test data or existing test cases as source test cases. There has been limited research done on systematic source test case generation for metamorphic testing. This paper provides a comprehensive evaluation on the impact of source test case generation techniques on the fault finding effectiveness of metamorphic testing. We evaluated the effectiveness of line coverage, branch coverage, weak mutation and random test generation strategies for source test case generation. The experiments are conducted with 77 methods from 4 open source code repositories. Our results show that by systematically creating source test cases, we can significantly increase the fault finding effectiveness of metamorphic testing. Further, in this paper we introduce a simple metamorphic testing tool called "METtester" that we use to conduct metamorphic testing on these methods.
KEYWORDS Metamorphic testing, Random testing, Source test case generation, Weak mutation, Branch coverage, Line coverage ACM Reference Format: Prashanta Saha and Upulee Kanewala. 2018. Fault Detection Effectiveness of Source Test Case Generation Strategies for Metamorphic Testing. In Proceedings of ACM Conference (MET 2018). ACM, Gothenburg, Sweden, 8 pages. https://doi.org/10.1145/nnnnnnn.nnnnnnn
1
INTRODUCTION
A test oracle [19] is a mechanism to detect the correctness of the outcomes of a program. The oracle problem [2] can occur when there is no oracle present for the program or it is practically infeasible to develop an oracle to verify the correctness of the computed outputs. This test oracle problem is quite frequent especially with ∗ Corresponding
author
Permission to make digital or hard copies of part or all of this work for personal or classroom use is granted without fee provided that copies are not made or distributed for profit or commercial advantage and that copies bear this notice and the full citation on the first page. Copyrights for third-party components of this work must be honored. For all other uses, contact the owner/author(s). MET 2018, , Gothenburg, Sweden © 2018 Copyright held by the owner/author(s). ACM ISBN 978-x-xxxx-xxxx-x/YY/MM. https://doi.org/10.1145/nnnnnnn.nnnnnnn
scientific software and is one of the most challenging problems in software testing. Metamorphic testing (MT) technique was proposed to alleviate this oracle problem [5]. MT uses properties from the program under test to define metamorphic relations (MRs). A MR specifies how the outputs should change according to a specific change made into the source input. Thus, from existing test cases (named as source test cases) MRs are used to generate new test cases (named as follow-up test cases). Then the set of source and follow-up test cases are executed on the program under test and the outputs are checked according to the corresponding MRs. The program under test can be considered as faulty if a MR is violated. Effectiveness of MT in detecting faults depends on the quality of MRs. Additionally the effectiveness of MT should also rely on the source test cases. Effectiveness of metamorphic testing can be improved by systematically generating the source test cases. Such a systematic approach can reduce the size of the test suite and could be more cost effective. Most of the previous studies in MT have used randomly generated test cases as source test data for metamorphic testing. In this study we investigated the effectiveness of line, branch coverage, weak mutation, and random testing for creating source test cases for MT. Our experimental results show that test cases satisfying weak mutation coverage provide the best fault finding effectiveness. We also have found that combining one or more systematic source test case generation technique(s) may increase the fault detection ability of MT.
2
BACKGROUND
MT is a property based testing approach which aims to alleviate the oracle problem. But the effectiveness of MT not only depends on the quality of MRs but also on the source test cases. In this section we briefly discussed MT and source test generation techniques, line, branch coverage and weak mutation.
2.1
Metamorphic Testing
Oracle problem is one of the biggest challenges in software testing. MT is an effective method to test program that faces oracle problem. MT [5] creates the follow-up test cases from the existing test cases called source test cases. To generate follow-up test cases first we need to identify an appropriate set of MRs that test program under test (PUT) should satisfy. MRs [7] are identified based on the properties of the problem domain like the attribute of the algorithm used. We can create source test cases using techniques like random testing, structural testing or search based testing. Follow-up test cases are generated by applying the input transformation specified by the MRs. After executing the source and follow-up test cases on the PUT we can check if there is a change in the output that
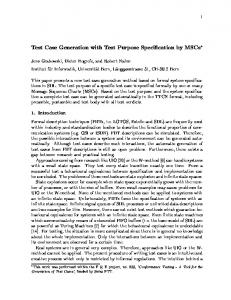
MET 2018, , Gothenburg, Sweden matches the MR, if not the MR is considered as violated. Violation of MR during testing indicates fault in the PUT. Since MT checks the relationship between inputs and outputs of a test program, we can use this technique when the expected result of a test program is not known. For example, in figure 1, a Java method add_values is used to show how source and follow-up test cases work with a PUT. The add_values method sum up all the array element passed as argument. Source test case, t = {3, 43, 1, 54} is randomly generated and tested on add_values. The output for this test case is 101. For this program, when a constant c is added to the input, the output should increase. This will be used as a MR to conduct MT on this PUT. A constant ′ value 2 is added to this array to create a follow-up test case t = {5, 45, 3, 56} and then run on the PUT. The output for this follow-up test case is 109. To satisfy this Addition MR the follow-up test output should be greater than the source output. In this MT example, the considered MR is satisfied for this given source and follow-up test cases.
2.2
Source Test Case Generation
To generate source test cases we have used the EvoSuite [9] tool. EvoSuite is a test generation tool that automatically produces test cases targeting a higher code coverage. EvoSuite uses an evolutionary search approach that evolves whole test suites with respect to an entire coverage criterion at the same time. In this paper we generated source test cases based on line, branch coverage , weak mutation and random testing. Below we briefly describe the systematic approaches used by EvoSuite to generate them. 2.2.1 Line Coverage. In line coverage [16], to cover each line of source code, we need to make sure that each basic code block in a method is reached. In traditional search-based testing, this reachability would be expressed by a combination of branch distance [13] and approach-level. The approach-level measures how distant an individual execution and the target statement are in terms of the control dependencies. The branch distance estimates how distant a predicate (a decision making point) is from evaluation to a desired target result. For example, given a predicate x==6 and an execution with value x = 4, the branch distance to the predicate valuing true would be |4-6|=2, whereas execution with value x=5 is closer to being true with a branch distance of |5-6|=1. Branch distance can be measured by applying a set of standard rules [11, 13]. In addition to test case generation, if reformation is a test suite to execute all statements then the approach level is not important, as all statements will be executed by the similar test suite. Hence, we only need to inspect the branch distances of all the branches that are related to the control dependencies of any of the statements in that class. There is a control dependency for some statements for each conditional statement in the code. It is required that the branch of the statement leading to the dependent code is executed. Hence, by executing all the tests in a test suite the line coverage fitness value can be calculated. The minimum branch distances dmin (b, Suite) are calculated for each executed statement among all observed executions to every branch b in the collection of control dependent branches BC D . Thus, the line coverage fitness function is defined as [16]:
f LC (Suite) = v(|NCLs |−|CoveredLines |)+
Õ
v(dmin (b, Suite))
b ∈BC D
Where NCLs are the set of all statements in the CUT, CoveredLines are the total set of covered statements which are executed by each test case in the test suite, and v(x) is a normalizing function in [0,1] (e.g. v(x) = (xx+1) ) [1]. 2.2.2 Branch Coverage. The idea of covering branches is well accepted in practice and implemented in popular tools, even though the practical rationale of branch coverage may not always match the more theoretical interpretation of covering all edges of a program’s control flow. Branch coverage is often defined as maximizing the number of branches of conditional statements that are executed by a test suite. Thus, a unit test suite is considered as satisfied if and only if its at least one test case satisfies the branch predicate to true and at least one test case satisfies the branch predicate to false. The fitness value for the branch coverage is calculated based on a criteria which is how close a test suite is to covering all branches of the CUT. The fitness value of a test suite is calculated by executing all of its test cases, keeping trail of the branch distances d(b, Suite) for each of the branch in the CUT. Then [16]: f BC (Suite) =
Õ
v(d(b, Suite))
b ∈B
To optimize the branch coverage the following distance is calculated, where dmin (b, Suite) is the minimal branch distance of branch b on all executions for the test suite [16]: 0 v(dmin (b, Suite)) d(b, Suite) = 1
if the branch has been covered, if the predicate has been executed at least twice, otherwise,
Here it is needed to cover the true and false evaluation of a predicate, so that a predicate must be executed at least twice by a test suite. If the predicate is executed only once, then in theory the searching could oscillate between true and false. 2.2.3 Weak Mutation. Test case generation tools prefer to generate values that satisfy the constraints or conditions, rather than developers preferred values like boundary cases. In weak mutation a small code modification is applied to the CUT and then force the test generation tool to generate such values that can distinguish between the original and the mutant. If the execution of a test case on the mutant leads to a different output than the execution on the CUT than a mutant is considered to be "killed" in the weak mutation. A test suite satisfies the weak mutation criterion if and only if at least one test case kill each mutant for the CUT. Infection distance is measured with respect to a set of mutation operator which guides to calculate the fitness value for the weak mutation criterion. Here inference of a minimal infection distance function dmin (µ, Suite) exists and define [16]:
Fault Detection Effectiveness of Source Test Case Generation Strategies for Metamorphic Testing
MET 2018, , Gothenburg, Sweden
Figure 1: Test Source and follow-up inputs on PUT.
dw (µ, Suite) =
1
if mutant µ was not reached,
v(dmin (µ, Suite)) if mutant µ was reached. This results in the following fitness function for weak mutation [16]: Õ fW M (Suite) = dw (µ, Suite) µ ∈Mc
Where Mc is the set of all mutants generated for the CUT.
3
EVALUATION METHOD
We conducted a set of experiments to answer the following research questions: • RQ1: Which source test case generation technique(s) is/are most effective for MT in terms of fault detection? • RQ2: Can the source test case generation techniques be combined to increase the fault finding effectiveness of MT? • RQ3: Does the fault detection effectiveness of an individual MR change with the source test generation method? • RQ4: How does the source test suite size differ for each source test generation technique?
3.1
Code Corpus
We built a code corpus containing 77 functions that take numerical inputs and produce numerical outputs . We obtained these functions from the following open source projects: • The Colt Project1 : A set of open source libraries written for high-performance scientific and technical computing in Java. • Apache Mahout2 : A machine learning library written in Java. • Apache Commons Mathematics Library3 : A library of lightweight and self-contained mathematics and statistics components written in the Java. We list these functions in Table 2. Functions in the code corpus perform various calculations using sets of numbers such as calculating statistics (e.g. average, standard deviation and kurtosis), 1 http://acs.lbl.gov/software/colt/ 2 https://mahout.apache.org/ 3 http://commons.apache.org/proper/commons-math/
Figure 2: METtester Architecture.
calculating distances (e.g. Manhattan and Tanimoto) and searching/sorting. Lines of code of these functions varied between 4 and 52, and the number of input parameters for each function varied between 1 and 4.
3.2
METtester
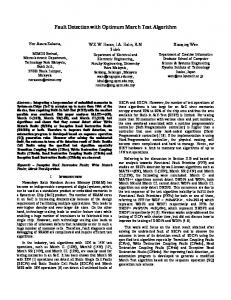
METtester [15] is a simple tool that we are developing to automate the MT process on a given Java program. This tool allows users to specify MRs and source test cases through a simple XML file. METtester transforms the source test cases according to the specified MRs and conducts MT on the given program. Figure 2 shows the high level architecture of the tool. Below we describe the important components of the tool: • XML input file: User will provide information (Figure 3) regarding method names to test, source test inputs, MRs, and the number of test cases to run.
MET 2018, , Gothenburg, Sweden
4 RESULTS AND DISCUSSION 4.1 Effectiveness of the Source Test Case Generation Techniques
Figure 3: An example of the XML input given to METtester.
• XML file parsing: Xmlparser class in our tool will parse information from the .xml file and process those. Then that information will be sent to the Follow-up test case generation module. • Follow-up test Case Generation: In this module followup test cases are generated based on the provided MRs and the source test cases. • Execute Source & Follow-up test cases on the PUT: After generation of the follow-up test cases METtester will run both the source and follow-up test cases individually into the system programs and return outputs from the programs. • Compare Source & Follow-up test results: After getting the test results from the test program METtester will compare those results with the MR operators mentioned in the xml file. If it satisfies the MR property then the class will flag the test case as "Pass". If it fails to satisfy the MR property class will flag it as "Fail" which means there is fault in the program.
3.3
Experimental Setup
For the 77 methods described in Section 3.1 we generated a total of 7446 mutated versions using the µJava mutation tool [12]. We used the following six metamorphic relations identified by Murphy et al. [14] to test these functions: • MR - Addition: Add a positive element. The expected result should be increased or remain constant. • MR - Multiplication: Multiply by a positive constant. The expected result should be increased or remain constant. • MR - Shuffle: Randomly permute the elements. The expected result should remain constant. • MR - Inclusive: Add a new element. The expected result should increase or remain constant. • MR - Exclusive: Remove an existing element. The expected result should decrease or remain constant. • MR - Invertive: Take the inverse of each element. The expected result should decrease or remain constant. For each of the methods, we used EvoSuite [9] described in section 2.2 to generate test cases targeting line, branch and weak mutation coverage. We used the generated test cases as the source test cases to conduct MT on the methods using the MRs described using METtester. Further, we randomly generated 10 test cases for each method to use as source test cases, to be used as the baseline.
Figure 4 shows the overall mutant killing rates for the four source test generation techniques. Among all test case generation techniques, weak mutation performed best by killing 68.7% mutants. Random tests killed 41.5% of the mutants. Table 1 lists the number of methods that reported the highest mutant kill rates for each type of test generation technique. For some methods, several source test generation techniques gave the same best performance.Therefore, Figure 5 shows a Venn diagram of all the possible logical relations between the best performing source test generation techniques for the set of methods. Weak mutation based test generation technique reported the highest kill rate in 41 (53%) methods, whereas random testing reported the highest kill rate only in 13 (17%) methods. Therefore these results suggest that weak mutation based source test case generation is more effective in detecting faults with MT.
Figure 4: Total % of mutants killed by each source test suite generation technique.
Table 1: Total number of methods having the highest mutants kill rate for each source test generation techniques. Total Methods
Weak mutation
Line
Branch
Random
77
41
26
29
13
RQ1: Weak mutation based test suites have the highest fault detection rate for majority of the methods
4.2
Fault Finding Effectiveness of Combined Source Test Cases
To observe whether combining source test case generation techniques will achieve a higher fault detection rate, we combined the best performing source test generation technique, weak mutation, with the other source test generation techniques. Table 3 shows the total percentage of mutants killed with each combined test suite. Combination of weak mutation and random test cases has the greater percentage of mutants kill rate (74.91) than combination of line (72.87) and branch (74.6) separately with weak mutation. If
Fault Detection Effectiveness of Source Test Case Generation Strategies for Metamorphic Testing
MET 2018, , Gothenburg, Sweden
Table 2: All methods with Mutants kill rates and test suite size for each Source test case generation technique Branch
weak mutation
Line
Random
Method name
Killrate No. (%) of Test Cases
Killrate No. (%) of Test Cases
Killrate No. (%) of Test Cases
Killrate No. (%) of Test Cases
add_values (Add elements in an array) array_calc1 array_copy (Deep copy an array) average ( Average of an array) bubble (Implements bubble sort) cnt_zeroes (Count zero in an array) count_k (Occurrences of k in an array) count_non_zeroes (Count non zero element in array) dot_product elementwise_max (Elementwise maximum) elementwise_min (Elementwise minimum) find_euc_dist (Euclidean distance between two vectors) find_magnitude (Magnitude of a vector) find_max (find the maximum value) find_max2 find_median (Find median value in an array) find_min (Find minimum value in an array) geometric_mean (Returns the geometric mean of the entries in the input array) hamming_dist (Hamming distance between two vectors) insertion_sort (Implements insertion sort) manhattan_dist (Manhattan distance between two vectors) mean_absolute_error (Measure of difference between two continuous variables) selection_sort (Implements selection sort) sequential_search (Finding a target value within a list) set_min_val (Set array elements less than k equal to k) shell_sort (Implements shell sort) variance (Returns the variance from a standard deviation) weighted_average (A mean calculated by giving values in a data set) manhattanDistance (The distance between two points in a grid) chebyshevDistance (Distance metric defined on a vector space) tanimotoDistance (a proper distance metric) errorRate sum distance1 (Compute the distance between the instance and another vector) distanceInf (Compute the distance between the instance and another vector) ebeadd (Creates an array whose contents will be the element-by-element addition of the arguments) ebedivide (Creates an array whose contents will be the element-by-element division) ebemultiply (Creates an array whose contents will be the element-by-element multiplication) safeNorm (Returns the Cartesian norm ) scale(Create a copy of an array scaled by a value) entropy g calculateAbsoluteDifferences evaluateHoners evaluateInternal evaluateNewton meanDifference (Returns the mean of the (signed) differences) equals chiSquare (Implements Chi-Square test statistics) partition evaluateWeightedProduct autoCorrelation (Returns the auto-correlation of a data sequence) covariance (Returns the covariance of two data sequences) durbinWatson (Durbin-Watson computation) harmonicMean (Returns the harmonic mean of a data sequence) kurtosis (Returns the kurtosis (aka excess) of a data sequence) lag1 (Returns the lag-1 autocorrelation of a dataset) max (Returns the largest member of a data sequence) meanDeviation (Returns the mean deviation of a dataset) min (Returns the smallest member of a data sequence) polevl pooledMean (Returns the pooled mean of two data sequences) pooledVariance (Returns the pooled variance of two data sequences) power product (Returns the product) quantile (Returns the phi-quantile) sampleKurtosis ( Returns the sample kurtosis (aka excess) of a data sequence) sampleSkew (Returns the sample skew of a data sequence) sampleVariance (Returns the sample variance of a data sequence) skew ( Returns the skew of a data sequence) square standardize (Modifies a data sequence to be standardized) sumOfLogarithms ( Returns the sum of logarithms of a data sequence) sumOfPowerOfDeviations weightedMean (Returns the weighted mean of a data sequence) weightedRMS (Returns the weighted RMS (Root-Mean-Square) of a data sequence) winsorizedMean (Returns the winsorized mean of a sorted data sequence)
63.63 33.33 56.00 38.10 51.40 41.00 31.80 41.00 63.00 46.30 44.40 80.10 52.10 70.80 64.10 48.70 40.40 51.20 40.90 43.60 53.30 37.50 41.30 37.20 51.20 43.70 26.10 86.10 48.89 39.08 30.21 61.04 50.00 53.33 46.67 92.68 100.00 100.00 14.78 48.72 88.42 93.55 60.98 46.03 95.25 80.00 40.00 22.50 96.41 43.26 30.61 25.20 24.84 0.00 74.00 93.84 99.55 51.72 54.39 67.41 94.23 36.43 43.08 53.33 50.00 40.13 93.86 89.47 75.31 93.88 47.37 89.26 75.00 68.75 77.46 86.96 33.00
63.63 33.33 64.00 73.80 44.95 51.30 36.36 48.71 60.87 68.51 55.56 76.39 75.00 50.00 71.84 98.93 61.70 53.66 84.09 42.55 61.36 41.07 41.30 25.58 58.14 42.51 39.86 56.94 77.78 43.68 32.97 58.44 77.78 80.00 46.67 100.00 100.00 100.00 98.63 58.97 88.42 95.16 60.98 79.37 93.47 65.71 80.00 27.50 96.41 95.81 40.82 93.50 23.57 33.77 74.00 93.84 32.70 56.90 33.33 81.03 88.46 34.88 47.83 53.33 50.00 40.76 93.86 89.47 75.31 93.88 47.37 89.26 68.75 52.08 77.46 86.96 37.93
54.54 46.15 64.00 42.86 36.69 38.46 34.09 51.28 56.52 83.33 55.56 79.17 52.10 50.00 67.96 41.71 57.45 95.12 59.09 37.23 53.30 39.29 39.40 30.23 30.23 43.11 30.40 86.10 22.22 35.63 44.50 58.44 50.00 53.33 46.67 100.00 100.00 92.68 97.08 53.85 88.42 93.55 60.98 47.62 95.55 64.29 40.00 21.25 96.41 28.84 42.86 43.09 23.57 0.00 76.00 97.16 89.55 51.72 28.07 70.69 88.46 34.88 47.83 53.33 50.00 32.48 92.98 97.37 12.35 93.88 57.89 91.95 68.75 75.00 77.46 86.96 34.48
30 52.10 0.00 28.20 16.90 0.00 50.00 22.20 22.20 0.00 0.00 50 8.69 70.90 98.40 53.10 83.80 65.40 15.90 32.65 0.00 0.00 21.60 37.50 100 0.00 25.70 21.20 9.10 2.00 5.60 0.00 35.30 14.8 14.8 15.8 26.8 15 0.8 47.8 42.9 20.9 0 80.4 90.6 76.8 40 100 65.6 88.1 2 79.40 86.70 14.10 42.50 34.80 33.70 96.60 78.30 96.60 45.50 19.30 31.10 15.80 94.70 40.00 85.10 89.50 71.20 48.80 5.30 77.60 21.90 64.90 65.00 43.30 0.00
1 1 1 1 1 1 1 1 1 2 1 1 1 1 1 2 1 1 1 1 1 1 1 2 2 1 1 1 1 2 2 3 1 1 1 2 2 2 1 1 1 2 1 1 1 1 1 3 2 5 2 2 1 0 1 1 1 1 1 1 2 1 1 1 1 2 1 1 1 1 1 1 1 1 1 1 1
1 1 1 1 3 2 2 2 1 3 1 1 1 1 2 3 1 1 3 2 2 2 2 3 2 1 1 1 2 5 5 2 1 1 1 3 5 3 5 3 2 2 1 1 2 1 1 4 2 5 2 2 1 1 1 1 1 1 1 2 1 1 1 1 1 2 1 1 1 1 1 1 1 1 1 1 1
1 1 1 1 1 1 1 1 1 2 1 1 1 1 1 2 1 1 2 1 1 1 1 2 1 1 1 1 1 2 2 2 1 1 1 2 2 2 4 1 1 1 1 1 1 1 1 3 2 3 2 1 1 0 1 1 1 1 1 1 2 1 1 1 1 2 1 1 1 1 1 1 1 1 1 1 1
10 10 10 10 10 10 10 10 10 10 10 10 10 10 10 10 10 10 10 10 10 10 10 10 10 10 10 10 10 10 10 10 10 10 10 10 10 10 10 10 10 10 10 10 10 10 10 10 10 10 10 10 10 10 10 10 10 10 10 10 10 10 10 10 10 10 10 10 10 10 10 10 10 10 10 10 10
|
MET 2018, , Gothenburg, Sweden we compare whether the size of the weak mutation test suites are smaller, equal or larger than those produced by other source test case generation techniques. And p-value column shows the p-value computed using the paired t-test between weak mutation - line and weak mutation -branch. We are not comparing random test suites here, because we intentionally generated 10 random test cases for each method. Weak Mutation leads to larger test suites than branch and line coverage and on average, number of test cases produced for weak mutation are larger than those produced for branch and line coverage. The total number of test cases are also relatively larger for weak mutation compared to line and branch coverage. RQ4: Weak Mutation generated a higher number of test cases Figure 5: Venn Diagram for all the combinations of source test suites that performed best for each individual methods. we combine all of the three strategies it slightly increases the total percentage of killed mutants (75.98) but there are few things to be considered, like combined test suite size. Table 3: Total % of mutants killed after combining Weak Mutation, Line, Branch Coverage, and Random Testing Weak Mutation +Line(%)
Weak Mutation +Branch(%)
Weak Mutation +Line+ Branch(%)
Weak Mutation+ Random(%)
72.87
74.6
75.98
74.91
RQ2: Combining weak mutation test cases with random test cases will lead to detect more faults
4.3
Fault Finding Effectiveness of Individual MRs
To see how each source test case generation technique performs with individual MRs, Figure 6 illustrates the percentage of mutants killed by all six MRs separately using weak mutation, line, branch coverage and random test suites. Weak mutation has the highest percentage of killed mutants in all the six MRs. Specifically with multiplication and invertive MRs, the weak mutation test suite surpasses others on mutants’ killing rate. But line coverage based test suites were similar to weak mutation on killing mutants with addition, shuffle, inclusive and exclusive MRs. For exclusive MR, all the test suites performed almost similarly. RQ3: Weak mutation killed highest number of mutants in all the MRs
4.4
Impact of Source Test Suite Size
Table 4 compares the coverage criteria in terms of the total number of tests generated, their average and median test suite size of the individual methods. In addition, in columns Smaller, Equal, and Larger
5
THREATS TO VALIDITY
Threats to internal validity may result from the way empirical study was carried out. EvoSuite and our experimental setup have been carefully tested, although testing can not definitely prove the absence of defects. Threats to construct validity may occur because of the third party tools we have used. The EvoSuite tool has been used to generate source test cases for line, branch and weak mutation test generation techniques. Further, we used the µJava mutation tool to create mutants for our experiment. To minimize these threats we verified that the results produced by these tools are correct by manually inspecting randomly selected outputs produced by each tool. Threats to external validity were minimized by using the 77 methods was employed as case study, which is collected from 4 different open source project classes. This provides high confidence in the possibility to generalize our results to other open source software. We only used the EvoSuite tool to generate test cases for our major experiment. But we also used the JCUTE [18] tool to generate branch coverage based test suites for our initial case study and also observed similar results.
6
RELATED WORK
Most contributions on MT use either random generated test data or existing test suites for the generation of source test cases. Not much research has been done on systematic generation of source test cases for MT. Gotlieb and Botella [10] presented an approach called Automated Metamorphic Testing where they translated the code into an equivalent constraint logic program and tried to find test cases that violates the MRs. Chen et al. [6] compared the effectiveness of random testing and "special values" as source test cases for MT. Special values are inputs where the output is well known for a particular method. Wu et al.[20] proved that random test cases are more effective than those test cases that are derived from "special values". Segura et al. [17] also compared the effectiveness of random testing with manually generated test suites for MT. Their results showed that randomly generated test suites are more effective in detecting faults than manually designed test suites. They also observed that combining random testing with manual tests provides better fault detection ability than random testing only. Batra and Sengupta [3] proposed genetic algorithm to generate test cases maximizing the paths traversed in the program under
Fault Detection Effectiveness of Source Test Case Generation Strategies for Metamorphic Testing
MET 2018, , Gothenburg, Sweden
Figure 6: % of Mutants killed by all six MRs using 4 test suite strategies (Branch, Line Coverage, Weak Mutation and Random) Table 4: Average test suites size for Weak mutation, Line coverage, Branch coverage and Random Test Suites Weak mutation Line branch Random
Total Number of Test Cases
Average Size
Median size
Std Dev
Smaller
Equal
Larger
p-value
135 97 99 770
1.75 1.26 1.29 10
1 1 1 10
1.13 0.67 0.59 0
1 2 77
45 49 0
31 26 0
3.102e-07 1.375e-05 -
test for MT. Chen et al. [4] also addressed the same problem from a different prospective. They proposed partitioning the input domain of the PUT into multiple equivalence classes for MT. They proposed an algorithm which will generate test cases which will cover those equivalence classes. They were able to generate test cases that provide high fault detection rate. Symbolic Execution was used to construct MRs and their corresponding source test cases by Dong and Zhang [8]. Program paths were first analyzed to generate symbolic inputs and then, these symbolic inputs were used to construct MRs. In the final step, source test cases were generated by replacing the symbolic inputs with real values.
7
CONCLUSIONS & FUTURE WORK
In this study we empirically evaluated the fault finding effectiveness of four different source test case generation strategies for MT: line, branch, weak mutation and random. Our results show that weak mutation coverage based test generation can be an effective source test case generation technique for MT than the other techniques. Our results also show that the fault finding effectiveness of MT can be improved by combining source tests generated for weak mutation coverage with randomly generated source test cases. Further, in this paper we introduce a MT tool called "METtester." We plan to incorporate the investigated automated source test
generation techniques into this tool. We also plan to extend the current case study to larger code bases and experiment with more source test generation techniques such as adaptive random test generation and data flow based test generation.
ACKNOWLEDGMENTS This work is supported by award number 1656877 from the National Science Foundation. Any Opinions, findings and conclusions or recommendations expressed in this material are those of the author(s) and do not necessarily reflect those of the National Science Foundation.
REFERENCES [1] A. Arcuri. 2010. It Does Matter How You Normalise the Branch Distance in Search Based Software Testing. In 2010 Third International Conference on Software Testing, Verification and Validation. 205–214. https://doi.org/10.1109/ICST.2010.17 [2] E. T. Barr, M. Harman, P. McMinn, M. Shahbaz, and S. Yoo. 2015. The Oracle Problem in Software Testing: A Survey. IEEE Transactions on Software Engineering 41, 5 (May 2015), 507–525. https://doi.org/10.1109/TSE.2014.2372785 [3] Gagandeep Batra and Jyotsna Sengupta. 2011. An Efficient Metamorphic Testing Technique Using Genetic Algorithm. In Information Intelligence, Systems, Technology and Management, Sumeet Dua, Sartaj Sahni, and D. P. Goyal (Eds.). Springer Berlin Heidelberg, Berlin, Heidelberg, 180–188. [4] Leilei Chen, Lizhi Cai, Jiang Liu, Zhenyu Liu, Shiyan Wei, and Pan Liu. 2012. An optimized method for generating cases of metamorphic testing. In 2012 6th International Conference on New Trends in Information Science, Service Science and Data Mining (ISSDM2012). 439–443.
MET 2018, , Gothenburg, Sweden [5] Tsong Yueh Chen. 2015. Metamorphic Testing: A Simple Method for Alleviating the Test Oracle Problem. In Proceedings of the 10th International Workshop on Automation of Software Test (AST ’15). IEEE Press, Piscataway, NJ, USA, 53–54. http://dl.acm.org/citation.cfm?id=2819261.2819278 [6] Tsong Yueh Chen, Fei-Ching Kuo, Ying Liu, and Antony Tang. 2004. Metamorphic Testing and Testing with Special Values. In 4th IEEE International Workshop on Source Code Analysis and Manipulation (SCAM 2004), 15-16 September 2004, Chicago, IL, USA. 128–134. [7] T. Y. Chen, F. C. Kuo, D. Towey, and Z. Q. Zhou. 2012. Metamorphic Testing: Applications and Integration with Other Methods: Tutorial Synopsis. In 2012 12th International Conference on Quality Software. 285–288. https://doi.org/10.1109/ QSIC.2012.21 [8] Guowei Dong, Tao Guo, and Puhan Zhang. 2013. Security assurance with program path analysis and metamorphic testing. In 2013 IEEE 4th International Conference on Software Engineering and Service Science. 193–197. https://doi.org/10.1109/ ICSESS.2013.6615286 [9] Gordon Fraser and Andrea Arcuri. 2011. EvoSuite: Automatic Test Suite Generation for Object-oriented Software. In Proceedings of the 19th ACM SIGSOFT Symposium and the 13th European Conference on Foundations of Software Engineering (ESEC/FSE ’11). ACM, New York, NY, USA, 416–419. https://doi.org/10. 1145/2025113.2025179 [10] A. Gotlieb and B. Botella. 2003. Automated metamorphic testing. In Proceedings 27th Annual International Computer Software and Applications Conference. COMPAC 2003. 34–40. https://doi.org/10.1109/CMPSAC.2003.1245319 [11] B. Korel. 1990. Automated Software Test Data Generation. IEEE Trans. Softw. Eng. 16, 8 (Aug. 1990), 870–879. https://doi.org/10.1109/32.57624 [12] Yu-Seung Ma, Jeff Offutt, and Yong Rae Kwon. 2005. MuJava: An Automated Class Mutation System: Research Articles. Softw. Test. Verif. Reliab. 15, 2 (June 2005), 97–133. https://doi.org/10.1002/stvr.v15:2 [13] Phil McMinn. 2004. Search-based Software Test Data Generation: A Survey: Research Articles. Softw. Test. Verif. Reliab. 14, 2 (June 2004), 105–156. https: //doi.org/10.1002/stvr.v14:2 [14] Christian Murphy, Gail Kaiser, Lifeng Hu, and Leon Wu. 2008. Properties of Machine Learning Applications for Use in Metamorphic Testing. 867–872. [15] ps073006 and Upulee Kanewala. 2018. MSU-STLab/METtester 1.0.0. (Jan. 2018). https://doi.org/10.5281/zenodo.1157183 [16] José Miguel Rojas, José Campos, Mattia Vivanti, Gordon Fraser, and Andrea Arcuri. 2015. Combining Multiple Coverage Criteria in Search-Based Unit Test Generation. Springer International Publishing, Cham, 93–108. https://doi.org/10. 1007/978-3-319-22183-0_7 [17] Sergio Segura, Robert M. Hierons, David Benavides, and Antonio Ruiz-CortÃľs. 2011. Automated metamorphic testing on the analyses of feature models. Information and Software Technology 53, 3 (2011), 245 – 258. https://doi.org/10.1016/j. infsof.2010.11.002 [18] Koushik Sen and Gul Agha. 2006. CUTE and jCUTE: Concolic Unit Testing and Explicit Path Model-Checking Tools. In CAV, Thomas Ball and Robert B. Jones (Eds.). 419–423. [19] Elaine Weyuker. 1982. On Testing Non-Testable Programs. 25 (11 1982). [20] Peng Wu, SHI Xiao-Chun, TANG Jiang-Jun, and LIN Hui-Min. 2005. Metamorphic Testing and Special Case Testing: A Case Study. 16 (07 2005).