Feature Matching Algorithms for Machine Vision Based Autonomous Aerial Refueling M.L. Fravolini, V. Brunori, A. Ficola, M. La Cava, G. Campa
Abstract – In this paper a Machine Vision (MV) based system is proposed as distance estimation sensor to be employed by UAVs during the operations of Autonomous Aerial Refueling. For studing this problem it was developed a simulator featuring a 3D Virtual Reality (VR) interface that generates the image stream of the AAR maneuver. The proposed MV algorithm performs specific tasks as image processing for features extraction, feature matching, and pose estimation. The problem of tanker/UAV attitude estimation from images is investigated in two scenarios: with and without artificial markers installed on the tanker. Two feature matching algorithms are proposed and the performance of the optical feedback signal are analyzed and compared in closed loop simulations.
I.
INTRODUCTION
This paper reports some new results of a joint research program between the University of Perugia (Italy) and West Virginia University (USA) for the development and testing of Machine Vision (MV) algorithms for the control of Unmanned Aerial Vehicles (UAVs). In this context an extremely challenging theme is related to the possibility of providing UAVs of in-flight autonomous aerial refueling capabilities (AAR). This interest is testified by the large number of academic [1],[2],[3] and military[4],[5] research programs specifically dedicated to the study of the MVbased AAR problem. For this study a simulation environment was specifically developed by adding to a dynamic simulation model of the tanker/UAV system [6] a 3D Virtual Reality (VR) interface that generates an image stream of the AAR maneuver as seen by the UAV onboard camera. In this study the MV is used essentially as a relative distance/attitude sensor to guide and maintain the UAV in close proximity of the tanker aircraft during the last phase of the AAR maneuver. When the UAV enters within a defined 3D Window (3DW) below the tanker, the boom operator on the tanker is supposed to execute the refueling maneuver. The accurate estimation of the relative UAV/tanker distance/attitude from the images stream requires the realtime solution of specific problems as image processing for
M.L. Fravolini, V. Brunori, A. Ficola and M. La Cava are with the Department of Electronic and Information Engineering Perugia University, 06100 Perugia, Italy. ( corresponding Author: M. L. Fravolini, phone: +39075-5853682, fax: +39-075-5853654, email:
[email protected]) G. Campa is with the Department of Mechanical and Aerospace Engineering, West Virginia University, Morgantown, WV 26506/6106,USA
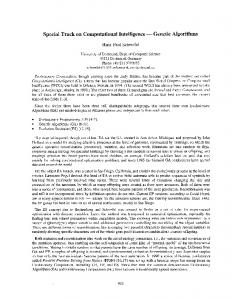
the extraction of characteristics features (FE), feature matching (FM), and finally relative pose estimation (PE). In most of the published works on this topic it is implicitly assumed that all detected features are perfectly identified (matched); in other words, the FM problem is not addressed. On the other hand, it should be clear that significant problems may arise when the perfect matching assumption is violated leading to a probable biased estimation of the relative position parameters [7]. The problem of wrong matching is typically relevant when the number of corresponding points is small and time varying due to possible physical occlusions as in AAR. For instance, when the UAV approaches the tanker, the visual interference of the boom could lead to a loss of visibility of one or multiple features. For all these reasons, within this effort, the attention was focused in studying the feature correspondence problem and the impact of possible wrong matchings on the accuracy of the pose estimation. In details, two specific operative scenarios have been studied: • “Scenario with Markers” (Sc-M): In this scenario the feature detection process is helped by assuming on the tanker the presence of a known geometry distribution of optical markers ( IR-Light LEDs similar to those used in manned night-time refueling). The Marker based approach has been proposed by many authors [1],[2],[3]. • “Scenario with Corners” (Sc-C): In this scenario no artificial features are used. Features positions are derived through a corner detection algorithm applied to the image stream of the tanker. Figure 1 and 2 show typical images extracted from the virtual word for the Sc-M and Sc-C respectively. The extraction of features in the two scenarios requires very different FE Algorithms. FE algorithms will be detailing described in section 4. After FE, it is necessary to address the FM problem. Two different matching algorithms have been implemented and tested to evaluate and compare their performance. The pose estimation problem has been solved by applying a non-linear least-squares algorithms based on the projective 3D to 2D transformation. Details on this algorithm (Gaussian Least Squares Differential Correction (GLSDC)) can be found in the published works [2],[6]. Quantitative simulation results are presented in section VI.
II.
THE MV-BASED AAR PROBLEM
The relevant geometric distances and associated reference frames for the AAR problem are shown figure 3. A. Reference frames The study of the AAR problem requires the definition of the following Reference Frames (RFs): • ERF is the earth-fixed reference frame • TRF is the body-fixed tanker reference frame located at the aircraft center of gravity • URF is the body-fixed UAV reference frame located at the aircraft center of gravity • CRF is the body-fixed UAV camera reference frame. To make the docking problem invariant with respect to the nominal heading of the aircraft, an additional fixed frame MRF is defined. This frame is rotated of the nominal heading angle Ψ0 with respect to the ERF. The transformed vectors in the MRF are evaluated using the relationships: RB m = Rem ⋅ RB e where Rem is a fixed rotation matrix from ERF to MRF. B. AAR Problem formulation The objective is to guide the UAV such that its fuel receptacle (point R in Figure.1) tracks the center of a 3dimensional window (3DW) under the tanker (point B see figure 3). Once the UAV fuel receptacle reaches and remains within this 3DW, the boom operator is assumed to take control of the refueling operations. It should be underlined that point B is fixed in the TRF with the dimensions of the 3DW (δx,δy,δz) being an important design parameter. It is assumed that the tanker and the UAV share a data communication link. The UAV is equipped with a digital camera that acquires the image of tanker. Points Pj
related to the estimation of the CT c vector will be extensively discussed in this paper.
Figure 1 VRT Image of the tanker in “Scenario with markers”. Red markers are visible on the tanker.
Figure 2 VRT Image of the tanker in “Scenario with Corner”. Detected corners are evidenced on the tanker.
represents optical markers as well as corners. For simplicity, the 2-D image plane of the MV is assumed to be coincident with the ‘x-z’ plane of the CRF.
TANKER δy
δx
δz
Pj
B
C. Receptacle-3DW-center vector As described above the reliability of the AAR is based on the accuracy in the measurement of the distance RBe. This distance is derived from the available measurements of distance and attitude coming from the UAV and the tanker. For this purpose, the following geometric transformation is introduced:
RB = R ⋅ (UC − UR + R ⋅ CT e
e u
u
u
u c
c
)+ R
e t
T
3D window in T RF
B
CT
U C
R
E≡ M= U≡ T≡ C≡ R≡ B≡ pi ≡
Center Earth-RF Center ψ0-rotated ERF Center UAV-RF Center Tanker-RF Center Camera-RF Receptacle pos. 3DW-center Optical Marker j
M
⋅ TB
t
(1)
Since the fuel receptacle and the 3DW-center are located at fixed and known positions with respect to center of gravity of the aircraft, in the above equation the vectors URu and TB t are exactly known, while the values of rotation matrix Rte and Rue are derived by the attitude sensors of the tanker and the UAV respectively. The camera-tanker distance ( CT c vector) expressed in the CRF is provided by the measurements given by the MV algorithm. The problems
UAV
E
Figure 3 Block diagram of the AAR
III. THE VIRTUAL ENVIRONMENT FOR AAR SIMULATION The aircraft models used for AAR simulation purposes have been developed using the conventional modeling approach outlined in [8], with the UAV modeled with the parameters of the ICE-101 aircraft and the tanker modeled with the
parameter of a KC135 aircraft. The resulting models are described by a 12 state space model. First order dynamic models have been used for the modeling of the actuators using typical values for aircraft size and weight. The tanker and UAV features a typical set of autopilot systems designed using a conventional LQR approach. Details on the design of the tracking and docking control scheme are provided in [2]. The boom system has been modeled using a 3-D finite elements model [9]. The atmospheric turbulence acting on the refueling boom and the aircrafts was modeled using the Dryden wind turbulence model [10]. A ‘light’ turbulence was selected since aerial refueling is typically performed at high altitudes in calm air. The wake effects of the tanker on the UAV are more significant than the atmospheric turbulence and have been modeled through the interpolation from a large amount of experimental data [11],[12] as perturbations to the aerodynamic coefficients cD , cL , cm , cY , cl , cn for the UAV aerodynamic forces and moments. A. The 3D visual interface The modeling described above was linked to a Virtual Reality Toolbox® (VRT) interface to provide the 3D graphics associated with the AAR maneuvers. Specifically, the interface allows the positions of the simulated objects, to drive the position and orientation of the corresponding objects in a Virtual World. In Sc-M, optical markers, were installed on the tanker model at specific locations, as discussed in [2]. The markers were modeled as red spheres with a radius of 10 cm each (see figure 1). B. Modeling of the GPS signals Quantitative modeling information of GPS sensors have been derived exploiting the results reported in [13] were a GPS-based air to air navigation system has been implemented for station keeping formation flight. In that study it was shown that mixing GPS measurements and independent measurements from the inertial navigation system (INS) it was possible to reconstruct in real-time the relative position between the two formation aircrafts with an uncertainty less than ±1.25m (4 ft ) along each component. This result was rationally explained asserting that due to close proximity common satellites are used by both aircrafts implying that common mode errors, clock errors, and atmospheric distortion effects are nearly eliminated. In this work the error affecting each GPS was modeled as a filtered white noise sampled at 20Hz added to each component. A filter that reproduces adequately the frequency content of the GPS error signal of [14] was: N gpsi ( s ) =
0.01 s + 0.01
i = x, y , z
(2)
The output of this filter was adequately amplified to have a 3σ standard deviation of 1.25m. C. Modeling of other feedback signals The practical evaluation of (1) requires not only the measurements from the GPS and MV but also the
measurements of the attitude angles of the UAV and the Tanker. Quantitative modeling information of attitude sensors were derived from data sheets of commercial inertial sensors [15]; in details it was assumed an Angular Rate Random Walk (°/hr1/2) = 0.4 and an accelaration Random Walk (m/s/hr1/2) = 0.1. An overall transmission and processing delay of 0.05 sec have been considered. D. The MV modeling The MV system features the following blocks: • Digital Frame Grabber (DFG) This block generates the continues image stream of the of the Tanker+UAV system generated by VRT. The DFG accuracy is characterized by the pixel resolution of the camera that was assumed to be 625 × 400 pixels with an image rate of 20 frames/sec. • Feature Extraction Algorithm (FEA) This block performs digital image processing operations for the extraction of salient features from the images. Different signal processing technique are require for Sc-M and Sc-C Feature Matching Algorithm (FMA) • This blocks associates the 2D coordinates [uj, vj] extracted from the FEA, specific physical 3D markers/corners on the tanker. • Pose Estimation Algorithm (PEA) After the set of ‘detected markers/corners has been matched to the set of the physical markers/corners of the tanker, the ‘Pose Estimation’ algorithm provides the estimation of the UAV-tanker relative distance and attitude. IV. FEATURE EXTRACTION ALGORITHMS Follows the descriptions of the FEA employed in Sc-M and Sc-C. A. The FEA for Scenario-M (FEA-M) In FEA-M, the image is first processed through an infrared digital filter that enhances the “spots” associated to the “red” markers, then, additional standard image manipulation tools are applied, leading, as final result, to a binary black and white image. Finally, after the image of the markers has been isolated from the background, an ‘ad hoc’ procedure, consisting of morphological closures and openings, is applied to isolate and label each single connected spot. A spot is significant only if it contains a number of pixels larger than a pre-defined threshold. These image filtering was performed using primitives of the Matlab Image Toolbox. In Sc-M, 16 markers were installed on the tanker in very visible position from the UAV camera. B. The FEA for Scenario-C (FEA-C) The scope of the FEA-C is to detect and isolate in the image points corresponding to specific physical corners of the tanker. In this work it was implemented the corner extraction algorithm proposed by Harris [16], with the modification proposed by Noble [17]. As reported in [18] this algorithm, although more complex, performed better when compared with SUSAN algorithm [19], in detecting the same set of corners in the image stream, and in yielding a smaller
number of “false positives”. Follows the description of the Harris algorithm. This method is based on the assumption that corners are associated with maxima of the local autocorrelation function. Let I be the gray level intensity of the image, and IX, IY, IXY, and IYX, its directional derivatives. The matrix of the intensity derivatives can then be defined as follows: I 2 M = X IYX
I XY IY 2
(3)
If at a certain point the two eigenvalues of the matrix M are large, then a small change in any direction will cause a substantial change in the gray level. This indicates that the point is a corner. Hence a “corner-ness” value C for each pixel of the image is calculated: C = det(M) – k Tr(M)
det( M ) Tr ( M ) + ε
c
CP( j ) = [ x cp , j , y cp , j , z cp , j ]T in the CRF frame, its projection into the image plane can be calculated using the projection equation:
y cp , j c z p , j
uˆ j f c vˆ = g f , CP( j ) = c x p, j j
(
)
(6)
where f is the camera focal length. The geometrical distribution of point Pj in the TRF are fixed and known ‘a priori’ with coordinates defined by the vectors TP( j )t . The following geometric equation relates the vector CP( j )c to the vector TP( j )t : CP(cj ) = CT c + Rtc ⋅ TP(tj )
(4)
If C is a local maximum above certain threshold, the pixel is declared a corner. The derivatives are determined by convolving the image by a kernel of the correspondent derivative of a Gaussian, and k is a constant with a generally assumed value of 0.04. The variation proposed by Noble improves the results of the Harris detector by using a slightly different “corner-ness” function: C=
to the “pin-hole” model, given a point ‘j’ with coordinates
(5)
In both Harris detector and its variation by Noble, a local maxima search is performed as a final step of the algorithm, in order to maximize the value of C for the selected corners. In Sc-C the set of the corners of the tanker to be used for matching was extracted from the set of corners that FEA-C is able to detect. This set has been determined empirically after the tuning of the FEA-C; in particular a set of 16 corners was selected.
where
the
vector
(7)
CT c = [ xtc , y tc , z tc ]T and
the
matrix
Rtc represents the origin and the orientation of the TRF with
respect to the CRF respectively. Matrix Rtc is specified by the T
relative yaw, pitch, and roll angles Φ c = ψ ct , θct , ϕct . The vector CT c and the matrix Rtc are not directly available but are derived from available measurements thought the following relation:
(
)
CT c = Ruc ⋅ Reu ET e − EU e − Ruc ⋅ UC u
(8)
Rtc = Ruc ⋅ Reu ⋅ Rte
(9) e
e
In Eq. (8), vectors ET and EU are measured thought the GPS systems installed on the tanker and UAV respectively, u
e
while the attitude matrices Re and Rt are derived using yaw, pitch, and roll angle measurements from the two u
V.
FEATURE MATCHING ALGORITHMS
Once the 2D coordinates of the detected markers/corners are evaluated on the image plane, the problem is to correctly associate each detected corner with its physical marker/corner on the tanker aircraft, whose position in tanker Reference Frame (3D coordinates) is known. In Sc-M the nominal position of the markers on the tanker is simply defined by the known position of the red markers. In Sc-C the position of the markers is the set of selected corners. The general approach for matching is to match the set of detected markers [u j , v j ] in the camera plane, to a subset of the expected markers/corners positions [uˆ j , vˆ j ] associated to the physical markers/corners. A. Projection equations In this work, the subset [uˆ j , vˆ j ] is simply a projection in the
camera plane of the markers/corners P(j), (using the standard “pin-hole” projection model [1],[2]). Specifically, according
aircrafts; Rc is constant and known. Analyzing eq. 8-9 it is evident that the accuracy of the estimates [uˆ j , vˆ j ] depends not only on the MV algorithms but also on the accuracy of the other measurements involved in (8) and (9).
B. The ‘Feature Matching’ problem Once the “projections” subset [uˆ j , vˆ j ] is evaluated, the problem of relating the points extracted from the camera measurements to the actual features on the tanker can be formalized in terms of matching the set of points P = ( p1 , p2 ,..., pm ) , where p j = [u j , v j ] , to the set P = ( pˆ1 , pˆ 2 ,... pˆ n ) where pˆ j = [uˆ j , vˆ j ] . Since the two data sets represents the 2D projections of the same points at the same time instant on the same plane, a high degree of correlation between the two sets is expected. In the ideal case corresponding points would be exactly superimposed, resulting in a trivial matching process. However, in the
presence of different sources of system and measurement noise, a matching problem has to be defined and solved. A detailed technical literature describes a number of robust matching techniques between point sets [20]. Usually, the degree of similarity between two data sets is defined in terms of a cost function or a distance function derived from general principles as geometric proximity, rigidity, and exclusion [21]. The best matching is then evaluated as the result of on optimization process exploring the space of the potential solutions. Often, the problem can be set as a classical assignment problem, and therefore solved using standard polynomial Network Flow algorithms. C. The FMA-1 The first algorithm that was tested derives the matching decisions analysing the matrix of distances between the two matching sets. One of the advantage of this “greedy method” (FMA-1) is the simplicity. Let Pˆ denote the set of the projected n physical markers/corners, and let P denote the set of detected markers/corners (not to exceed m). The labeling function creates a matrix Err of dimension n-by-m, whose coefficients are all the Euclidian distance between Pˆ and P . Three vectors, MinR, MinC e Index with dimensions n, m and m respectively are also created. The minimum element of the column is stored in the row vector MinC while the minimum element of the row is stored in the column vector MinR. The index of the row in which the function founds the minimum is stored in the row vector Index. The position of the detected marker ‘j’ in P is deemed “valid” if: MinC [ j ] == MinR Index [ j ]
(10)
Points that satisfy the validity condition are assigned to their nearest projection. Points that do not satisfy the validity condition are discarded. In other words, the validity condition ensures that, among the set of points that are closer to a certain projection than to other projections, only one it is assigned to the projection (the closest) and the other are not assigned to any other projection. The FMA-1 has a computational complexity of O(n 2 ) , and is able to avoid some of the problems associated with a labeling function that simply assigns the detected markers P to the nearest markers Pˆ . D. The FMA-2 In this approach (FMA-2) the matching problem is based on the criteria of exclusion, proximity and rigidity [7], namely in addition to the information derived from the distances between the corresponding points of the two matching sets, it is also considered the distance between corresponding points of the same set. These concepts can be modeled using a graph with nodes representing couples of potential matching and arks representing the compatibility between the couples of potential matches.
The matching problem is than reduced to a Maximal Clique Detection algorithm. Follows the detailed illustration of the algorithm. Graph definition The first step of the algorithm consists in the construction of the association graph G={V,E} where: • V is the set of vertexes of G and represents the set of potential matching between one element P of and one element of Pˆ .
• E is the set of arks of G and represents the compatibility between the couple of potential matching. • Proximity Principle: The vertex V are determined basing on the proximity principle. The association vij = ( pi , pˆ j ) is a vertex of G is and only if the distance
between pi e pˆ j is less than a defined threshold TP. Exclusion and Rigidity Principle: The set of arks E is determined basing on the exclusion and rigidity principle. According to the exclusion principle in the graph G cannot exist couples of arks eij ,ik = (vij , vik ) and e ji , ki = (v ji , vki ) ;
namely one element of P cannot be associated to more than one of the elements of Pˆ and vice versa. According to rigidity principle eij , hk = (vij , vhk ) is an ark of G only if: d ( pi , ph ) − d ( pˆ j , pˆ k ) < TR
(11)
where TR is a threshold; namely the distances between points in P have to be similar to the distances between the corresponding points of Pˆ . The computational complexity for the construction of the association graph G is O(m 2 ⋅ n 2 ) in the worst case of m*n vertex, and O(n 2 ) in the mean case of n vertex. Maximal Clique Detection Algorithm After the construction of the association graph G, feature matching is achieved by evaluating the maximal clique of the graph. The maximal clique of a graph G is defined as largest sub-graph where all the vertex are connected with a single ark of G. In this study the maximal clique of G represents the maximal set of compatible associations between elements of P and elements of Pˆ . Unfortunately, the determination of the maximal clique of G is a NPcomplete problem, therefore for a large graph, the evaluation is incompatible with the real-time constraint. In this work it has been implemented the heuristics described in table 1 to find a sub optimal solution. This heuristics works satisfactory in case of a sparse graph. VI PERFORMANCE ANALYSIS The following section is dedicated to the performance analysis of the proposed MV algorithms in Sc-M and Sc-C. Detailed simulation studies were performed to evaluate the impact of the different algorithms on the accuracy and reliability of the estimation of the RB m vector. This
S =V Q=∅ for each v ∈ V find his degree in G while S ≠ ∅ choose a vertex v in S with maximum degree in G N g (v) =set of vertices adjacent to v in V
Q = Q ∪ {v} S = S ∩ N g (v ) return Q Table 1 Heuristic for determining a sub optimal solution
analysis, was performed with multiple simulations that employ the proposed MV algorithms in the feedback control loop. For space constraint, we report the results achieved from a typical AAR maneuvers. The parameters defining, the sensors noise, the GPS and MV noise and the characteristics of the turbulence and wake effects are those described in section 3. The first study discusses the quantitative evaluation of the accuracy and sensitivity in the estimation of the RB e vector quantified by the 3 components of the estimation error e e eMV = RB − RB( MV ) and its norm:
(
)
eMVx = RBie − RB(eMV ,i ) ; i = x, y, z.
(12)
2 2 2 eMV = eMVx + eMVy + eMVz
(13)
The performance of the overall AAR scheme are measured by the real RBe distance. In the following section we will compare the performance of the two feature matching algorithms FMA-1 and FMA-2 in the scenarios Sc-M and Sc-C. It is underlined that Sc-M implicitly requires the application of the Feature Extraction algorithm FEA-M, while Sc-C requires the application of the FEA-C. Figures 4 and 5 shows the evolution of the estimation errors evaluated in the time interval [60-80] after the UAV has reached the steady state within the 3DW. Table 2 shown the statistics of the estimation errors evaluated in the time interval [60-350]. The performance in Sc-M provided by the two Feature Matching algorithm are very similar, giving both a mean estimation error of about 0.17 m. In Sc-C an appreciable difference exists; in fact, in this scenario the mean estimation error is about 0.15 m for FMA2 and 0.20 m for FMA1. The reason of the better performance given by FMA2 is mainly due to a smaller estimation error along the x direction ( eMV , x =0.059 m ) respect to the FMA1 ( eMV , x =0.018 m). The equivalence of the performance of the two matching algorithms in Sc-M can be reasonably explained by the fact that being the Marker fixed on the tanker, the constraint of rigidity of the FMA2 algorithm may result superfluous. In fact, in Sc-M is very low the possibility of assigning a wrong
matching because the high proximity of the detected makers. On the other hand, in Sc-C, the rigidity constraint of FMA2 may result very useful because in this scenario is not unlikely the probability of equivocations in the labeling of corners. If fact, the Harris corner detection algorithm (FEAC) is affected by an obvious approximation in the determination of the corners position in successive images due to the natural variation of luminosity in the image stream in the region around a corner. Figure 6 shows the number of labeled makes in Sc-M for both feature matching algorithm during the approach and at steady state (time interval [0 80]). It is underlined that the MV algorithms is employed in the feedback control laws only in the last phase of the manoeuvre (after the 30th second) when the number of visible markers reaches an almost stationary value. Figure 7 shows the number of labeled corners in Sc-C. The analysis reveals that, differently from figure 6, while FMA1 works (at steady state) with an almost stationary number of markers, the algorithm FMA2 does not reach a stationary value. The reason of this “chattering” originates from the rigidly constraint that is not present in FMA1. In Sc-C the FMA2 seems to be more selective than FMA1 and, for this reason, FMA2 has a smaller probability of wrong matchings. Anyway, it should be noticed that in Sc-C the “chattering” in the number of labeled corners of FMA2 causes an increase of the STD of the estimation error with respect to FMA1. The overall performance of the MV based AAR schemes are reported in table 3 where the statistics of the BR e distance are shown. Not surprisingly, the performance in Sc-M are almost the same for the FMA1 and FMA2 algorithms with a mean value of the BR e distance equal to 0.12 m. In scenario Sc-C the performance of FMA2 are different. In details, FMA1 gives a mean value for BR e of 0.16 m while FMA2 gave a mean value of 0.11 m. . The main reason of the better performance of FMA2 is mainly due to a smaller tracking error along the x direction ( BRxm =0.03 m ) respect to the FMA1 ( BRxm =0.14 m ). VI. CONCLUSIONS Within this paper the performance of different Machine Vision Based Algorithms for the study of the AAR problem have been analyzed. In particular a feature matching algorithm that exploits an association graph to represent constraints of proximity, exclusion and rigidity is compared with a simpler algorithm based on the analysis of the distance matrix. The comparison was carried out in two scenarios: with and without artificial markers. While in the scenario with artificial makers the performance of the two labeling algorithm are very similar, a significant difference of the relative UAV/tanker distance estimation error was observed in the more challenging scenario where the features are derived from a corner detection algorithm applied to image stream of the tanker aircraft.
MV Estimation Error in scenario Sc-M
0.25
Number of Matched Markers in scenario Sc-M 14 12 10
0.2
8 6
eMV [m]
0.15
4
FMA1 0
10
20
30
40
50
60
70
80
Time [s] 0.1
14 12 10
0.05 FMA-2 FMA-1 0 60
62
64
66
68
70
72
74
76
78
8 6 4
80
FMA2 0
10
20
30
Time [s]
Figure 4 Estimation error in Scenario-M
50
60
70
80
Figure 6 Matched Markers
MV Estimation Error in scenario Sc-C
0.25
40
Time [s]
Number of Matched Markers in scenario Sc-C 14 12 10
0.2
8 FMA1
6
eMV [m]
0.15
4
0
10
20
30
40
50
60
50
60
70
80
Time [s] 0.1
14 12 10
0.05
8
FMA2 FMA1 0 60
62
64
66
68
70
72
74
76
78
6 4
80
FMA2 0
10
20
30
40
70
Time [s]
Time [s]
Figure 7 Matched Markers
Figure 5 Estimation error in Scenario-C
eMV , x
eMV (t )
eMV , y
eMV , z
Mean
Std
Mean
Std
mean
Std
Mean
Std
Sc-M + FMA2
0.1744
0.0028
0.1641
0.0036
-0.0375
0.0129
0.0425
0.0101
Sc-M + FMA1
0.1741
0.0029
0.1639
0.0031
-0.0396
0.0065
0.0415
0.0103
Sc-C + FMA2
0.1574
0.0494
0.0596
0.0930
-0.0618
0.0698
-0.0709
0.0365
Sc-C + FMA1
0.2022
0.0133
0.1871
0.0093
-0.0306
0.0310
-0.0609
0.0194
Table 2 Performance Analysis of the Estimation Error evaluated in the interval [60-350]
BRxm
BR m
BRzm
BRym
Mean
Max
Mean
Max
mean
Max
Mean
Max
Sc-M + FMA2
0.1264
0.1669
0.1051
0.1423
-0.0419
0.0714
0.0498
0.0875
Sc-M + FMA1
0.1264
0.1677
0.1051
0.1430
-0.0441
0.0721
0.0488
0.0868
Sc-C + FMA2
0.1109
0.1577
0.0369
0.0900
-0.0670
0.1089
-0.0677
0.1213
Sc-C + FMA1
0.1614
0.1916
0.1462
0.1761
-0.0339
0.0583
-0.0552
0.0901
Table 3 Closed Loop Performance Analysis within the 3DW evaluated in the interval [60-350]
80
REFERENCES [1] Kimmett J.,Valasek J. And Junkins J.L., “Autonomous Aerial Refueling Utilizing a Vision Based Navigation System”, Proceedings of the 2002 AIAA GNC Conference, paper 20024469, Monterey, CA, August 2002 [2] Fravolini M.L., Ficola A., Napolitano M.R., Campa G., Perhinschi M.G., “Development of modelling and control tools for aerial refueling for UAVs”, Proceedings of the 2003 AIAA GNC Conference, Paper 2003-5798, Austin, TX, August 2003 [3] Pollini L., Campa G., Giulietti F., Innocenti M., “Virtual Simulation Set-up for UAVs Aerial Refueling”, Proceedings of the 2003 AIAA Conference on Modeling and Simulation Technologies and Exhibits, Paper 2003-5682, Austin, TX, August 2003 [4] J.P. Nalepka, J.L. Hinchman, Automated Aerial Refueling: Extending the Effectiveness of Unmanned Air Vehicles, AIAA Modeling and Simulation Technologies Conference and Exhibit 15 - 18 August 2005, San Francisco, California AIAA 2005-6005 [5] B.T. Nguyen,L.Tong Lin, The Use of Flight Simulation and Flight Testing in the Automated Aerial Refueling Program, AIAA Modeling and Simulation Technologies Conference and Exhibit, 15 - 18 August 2005, San Francisco, California, AIAA 2005-6007 [6] Fravolini M.L., Ficola A., Campa G., Napoletano M.R., Seanor B., “Modeling and Control Issues for Autonomous Aerial Refueling for UAVs Using a Probe-Drogue Refueling System”. Journal of Aerospace Science Technology, Vol. 8, No. 7, 2004, pp. 611-618 [7] Pla, F., Marchant, J.A., “Matching Feature Points in Image Sequences through a Region-Based metho,d Computer vision and image understanding, Vol. 66, No. 3, 1997, pp. 271-285. [8] Stevens, B.L., Lewis, F.L., “Aircraft Control and Simulation,” John Wiley & Sons, New York, 1987. [9] Spong, M.W., Vidyasagar, M., “Robot Dynamics and control,” Wiley, New York, 1989. [10] Roskam J. “Airplane Flight Dynamics and Automatic Flight Controls – Part II”, DARC Corporation, Lawrence, KS, 1994. [11] Blake, W., Gingras, D.R., “Comparison of Predicted and Measured Formation Flight Interference Effect,, Proc. AIAA Atmospheric Flight Mechanics Conference, Montreal, Canada, 2001, AIAA Paper 2001-4136. [12] Gingras, D.R., Player, J.L., Blake, W., “Static and Dynamic Wind Tunnel testing of Air Vehicles in Close Proximity,” Proc. of the AIAA Atmospheric Flight Mechanics Conference, Montreal, Canada, 2001, IAAA Paper 2001-4137. [13] Curtis E. Hanson, Jack Ryan, Michael J. Allen, and Steven R. Jacobson, An Overview of Flight Test Results for a Formation Flight Autopilot, NASA/TM-2002-210729, http://www.dfrc.nasa.gov/DTRS [14] M. Jake Vachon, Ronald J. Ray, Kevin R. Walsh, and Kimberly Ennix, F/A-18 Performance Benefits Measured During the Autonomous Formation Flight Project, NASA/TM-2003210734, at http://www.dfrc.nasa.gov/DTRS/ [15] Crossboy, IMU700 MEMS, http://www.xbow.com/ [16] C. Harris and M. Stephens, “A Combined Corner and Edge Detector”, Proc. 4th Alvey Vision Conference, Manchester, pp. 147-151, 1988 [17] A. Noble, “Finding Corners”, Image and Vision Computing Journal, 6(2): 121-128, [18] S. Vendra, G. Campa, M. R. Napolitano, M. Mammarella, M. L. Fravolini, “Addressing Corner Detection Issues for Machine Vision based UAV Aerial Refueling”, Machine Vision and Application, September 2005.
[19] Smith S.M., and Brady, J. M., “SUSAN - A New Approach to Low Level Image Processing”, International Journal of ComputerVision, 23(1): 45-78, 1997. [20] Hutchinson. S., Hager, G., Corke, P., “A tutorial on visual servo control”, IEEE Transactions on Robotics and Automation, Vol. 12, No. 5, 1996, pp. 651-670. [21] Umeyama, S., “Parameterized point pattern matching and its application to recognition of object families,” IEEE Transactions on Pattern Analysis and Machine Intelligence, Vol.15, No.2, 1993, pp.136-144.