May 29, 2014 - visual vocabulary from all the training descriptors was known to be a âgargantuan taskâ ..... categorisation: Generative models and pdf-kernels.
arXiv:1405.7545v1 [cs.CV] 29 May 2014
Feature sampling and partitioning for visual vocabulary generation on large action classification datasets.
1
Michael Sapienza1 , Fabio Cuzzolin1 , and Philip H.S. Torr2 1
Department of Computing and Communications Technology, Oxford Brookes University. 2 Department of Engineering Science, University of Oxford.
Abstract. The recent trend in action recognition is towards larger datasets, an increasing number of action classes and larger visual vocabularies. State-of-the-art human action classification in challenging video data is currently based on a bagof-visual-words pipeline in which space-time features are aggregated globally to form a histogram. The strategies chosen to sample features and construct a visual vocabulary are critical to performance, in fact often dominating performance. In this work we provide a critical evaluation of various approaches to building a vocabulary and show that good practises do have a significant impact. By subsampling and partitioning features strategically, we are able to achieve state-ofthe-art results on 5 major action recognition datasets using relatively small visual vocabularies. Keywords: Action classification, performance evaluation, visual vocabularies
Introduction
Human action recognition on huge datasets collected from the Internet is an increasingly important research area, given the popularity of smart-phone videos and online sharing websites. The recognition of human actions from challenging data is essential to facilitate the automatic organisation, description and retrieval of video data from massive collections [1]. Querying unconstrained video data is hard, for online clips are often of low quality, and affected by erratic camera motions, zooming and shaking. Variations in viewpoint and illumination pose additional difficulties. Furthermore, human action clips possess a high degree of within-class variability and are inherently ambiguous since the start and end of an action are hard to define. So far the best global representation for challenging video data has been in the form of a bag-of-features (BoF) histogram, and its extensions to Fisher vectors [2]. The surprising success of BoF may be attributed to its ability to summarise local features as a simple histogram, without regard for human detection, pose estimation or the location of body-parts, which so far cannot be extracted reliably in unconstrained action videos [3]. Moreover, the histograms provide a fixed length representation for a variable number of features per video, which is ideal for traditional learning algorithms [4]. Despite extensive work showing various aspects in which BoF may be improved to squeeze out additional performance [5,6,7,4,8,9,10], there remains interesting questions yet to be evaluated empirically, particularly when considering huge action classification datasets with a large number of classes [11,12].
2
Michael Sapienza1 , Fabio Cuzzolin1 , and Philip H.S. Torr2
For example, the recent UCF101 dataset [12] contains 101 action classes and ≈ 13, 000 video clips. Using the state-of-the-art Dense Trajectory features, this generates ∼ 679Gb of features. Therefore one cannot simply load all the training features into memory. Furthermore, randomly subsampling the features generates a bias towards action classes associated with a greater share of videos, or disproportionately longer video sequences. Secondly, state-of-the-art space-time descriptors are typically formed by a number of components. The issue arises of whether it is best to learn a single visual vocabulary over the whole, joint feature space, or to learn a separate vocabulary for each feature component. Finally, visual vocabularies may be learnt separately for each action category [4]. Although it generates redundant visual words which are shared among multiple action classes, such a strategy is worth exploring for the dimensionality of the representation increases linearly with the number of classes C. Thus learning multiple dictionaries per-category, each with a small number of clusters K, may still produce large vector representations since the final dictionary size will be K × C. In this work we explore various ways of generating visual vocabularies for action classification that address the following unanswered questions: i) What is the best way to randomly subsample features to build a vocabulary? ii) What are the effects of learning separate rather than joint visual vocabularies when considering multiple feature components or multiple action classes?
2
Related work
Current state-of-the-art human action classification systems rely on the global aggregation of local space-time features [2]. For example, in the bag-of-features (BoF) approach, space-time descriptors are usually clustered into K centroids to form a visual vocabulary. Each video descriptor is then assigned to the nearest cluster in the visual vocabulary, and a video clip is represented by a fixed-length histogram, where each bin represents the frequency of occurring visual words. The areas in which BoF may be improved were broadly outlined by Nowak et al. [7] and Jiang et al. [8]. These include the patch sampling strategy, for which uniform random sampling of the image space was shown to outperform interest point-based samplers such as Harris-Laplace and Laplacian of Gaussian [7]. Previous action recognition BoF evaluation [13] focused on comparing a variety of local spatio-temporal features, and also found that dense sampling consistently outperformed interest point detection in realistic video settings. Later, the authors of [13] proposed a new visual descriptor called Dense Trajectories which achieved the state-of-the-art in action classification [14]. Further areas of improvement were the feature-space partitioning algorithm, for which Nister et al. [9] extended k-means to produce vocabulary trees, and Farquhar et al. [4] used a Gaussian mixture model instead of k-means; the visual vocabulary size also improved performance, though it saturated at some data-dependent size [7]. Another area of improvement was deemed to be the weighting of frequency components in a histogram (tf-idf) [10], and the use of sets of bipartite histograms representing universal and class-specific vocabularies [6]. More recently, Fisher and VLAD vectors achieved excellent results by using small vocabularies and soft quantisation instead of a
Title Suppressed Due to Excessive Length
3
hard assignment to form high dimensional vectors [15,16]. A comprehensive evaluation of various feature encoding techniques on image classification datasets was provided by Chatfield et al. [17]. Finally the choice of classification algorithm has largely been dominated by support vector machines [5,18,14]. In contrast to previous work [7,13,17], here we focus on feature subsampling and partitioning after feature extraction has taken place but prior to encoding. For earlier systems which used BoF for object retrieval in videos [10], building a visual vocabulary from all the training descriptors was known to be a “gargantuan task” [10]. Thus researchers tended to select subsets of the features, dedicating only a sentence to this process. For example, quoting [10], “a subset of 48 shots is selected covering about 10k frames which represent about 10% of all frames in the movie”, amounting to 200k 128-D vectors for learning the visual vocabulary. Csurka et al. trained a vocabulary with “600k descriptors” [5], whilst Nister et al. used a “large set of representative descriptor vectors” [9]. In order to construct visual vocabularies, Jiang et al. used all the training keypoint features in the PASCAL dataset, and subsampled 80k features in the TRECVID dataset [8]. In the evaluation proposed here, we clarify this process by comparing two specific methods to sample features from the smallest to largest action recognition datasets available. The sheer volume of features extracted from each dataset used here is listed in Table 1. It is clear that with thousands of videos in the training set, in practice one cannot use all of the features to build a vocabulary. Also note that in video classification datasets, longer sequences have disproportionately more features than shorter ones, in contrast to image datasets. Moreover, some action classes also have many more videos associated with them than others. To see the extent by which the number of features per video varies in action recognition, check the difference between the ‘Max’ and ‘Min’ row of Table 1. Thus, in general, sampling uniformly at random may result in a pool of features which is biased towards a particular class. For example in the Hollywood2 dataset [19] ‘driving’ action clips are typically much longer than ‘standing up’ clips. We hypothesise that the subsampling strategy may have a significant impact on the classification performance especially when dealing with a large number of action classes and videos. The selection of good partitioning clusters to form a visual vocabulary is also important, as they form the basic units of the histogram representation on which a classifier will base its decision [4]. Thus, for a categorisation task, having clusters which represent feature patches that distinguish the classes is most likely to make classification easier. This motivates per-category clustering, to preserve discriminative information that may be lost by a universal vocabulary [4], especially when distinct categories are very similar. The downside is that learning a separate visual vocabulary per class may also generate many redundant clusters when features are shared amongst multiple categories. On the other hand, since the complexity of building visual vocabularies depends on the number of cluster centres K, clustering features independently allows to reduce K whilst keeping the representation dimensionality high, and makes the vocabulary learning easily parallelisable. So far, per-category training has seen promise on a single dataset with a small number of classes [4]; it is therefore to be seen how it performs on challenging action classification data with a large number of action classes.
4
Michael Sapienza1 , Fabio Cuzzolin1 , and Philip H.S. Torr2
Table 1. Various statistics on the amount of Dense Trajectory features extracted per video from the KTH, Hollywood2 (HOHA2), HMDB and UCF101 datasets. The number of action categories are denoted within parenthesis. The ‘Sum’ and ‘Mem’ are calculated over the whole dataset assuming 32-bit floating point. Following these are the mean, standard deviation, median, maximum, and minimum number of features per video in each dataset.
Sum (×106 ) Memory (GB) Mean (×103 ) Std Dev (×103 ) Median (×103 ) Maximum (×103 ) Minimum
KTH (6) HOHA2 (12) HMDB (51) UCF-101 4 28 99 421 6 45 160 679 9 5 8 36 967
34 44 20 405 438
16 14 13 138 287
32 30 22 410 358
Contributions. First and foremost we demonstrate various design choices that lead to an improved classification performance across 5 action recognition datasets and 3 performance measures. Secondly, we propose a simple and effective feature sampling strategy used to scale the vocabulary generation to a large number of classes and thousands of videos (c.f. Algorithm 1). The outcomes of this study suggest that i) sampling a balanced set of features per class gives minor improvements compared to uniform sampling, ii) generating separate visual vocabularies per feature component gives major improvements in performance, and iii) BoF per-category gives very competitive performance for a small number of visual words, achieving state-of-the-art on KTH with only 32 clusters per category, although Fisher vectors won out on the rest. With a simple and clear-cut algorithm, the results we obtained on the 5 major datasets in action classification are comparable or outperform the state-of-the-art. The code and parameter settings are made available online3 .
3
Datasets and performance measures
The KTH dataset [20] contains 6 action classes, 25 actors, and four scenarios. The actors perform repetitive actions at different speeds and orientations. Sequences are longer when compared to those in the YouTube[21] or the HMDB51[11] datasets, and contain clips in which the actors move in and out of the scene during the same sequence. We split the video samples into training and test sets as in [20], and considered each video clip in the dataset to be a single action sequence. The YouTube dataset [21] contains videos collected online from 11 action classes. The data is challenging due to camera motion, cluttered backgrounds, and a high variation in action appearance, scale and viewpoint. In our tests, 1600 video sequences were split into 25 groups, following the author’s evaluation procedure of 25-fold, leave-oneout cross validation. 3
URL for code
Title Suppressed Due to Excessive Length
5
The Hollywood2 dataset [19] contains instances of 12 action classes collected from 69 different Hollywood movies. There are a total of 1707 action samples each 5-25 seconds long, depicting realistic, unconstrained human motion, although the cameras often have their view centred on the actor. The dataset was divided into 823 training and 884 testing sequences, as in [19]. Note that all videos in this dataset were initially downsampled to half their size. The HMDB dataset [11] contains 51 action classes, with a total of 6849 video clips collected from movies, the Prelinger archive, YouTube and Google videos. Each action category has a minimum of 101 clips. We used the non-stabilised videos with the same three train-test splits proposed by the authors [11]. The UCF101 dataset [12] contains 101 action classes, ∼13k clips and 27 hours of video data. This is currently the largest and most challenging video dataset due to the sheer volume of data, high number of action classes and unconstrained videos. We used the recommended three train-test splits proposed by the authors [12]. To quantify the respective algorithm performance, we followed [22] and report the accuracy (Acc), mean average precision (mAP), and mean F1 scores (mF1).
4
Experiments
In this section we detail the experiments used to answer the questions set out in section 1. We keep some parameter settings constant throughout the tests (§ 4.1) and let others vary (§ 4.2). The specifics of our vocabulary sampling and generation strategy are laid out in Algorithm 1. 4.1
Constant experimental settings
Space-time features. Amongst the wide variety of space-time interest point detectors [23,24] and descriptors [18,25,26,27], the Dense Trajectory features of Wang et al. [14] gave the state-of-the-art results in experiments with challenging action video data [14,22]. A Dense Trajectory feature is formed by the concatenation of five feature components: optic flow displacement vectors, the histogram of oriented gradient and histogram of optic flow (HOG/HOF) [18], and the motion boundary histograms (MBHx/MBHy) [28]. This feature is computed over a local neighbourhood along the optic flow trajectory, and is attractive because it brings together the local trajectory’s shape, appearance, and motion information [14]. These Dense Trajectory features were pre-computed from video blocks of size 32 × 32 pixels for 15 frames, and a dense sampling step-size of 5 pixels, using the code made available by the authors [14]. The features were stored as groups of 4-byte floating point numbers, each associated with a video vi in dataset d, where i = {1, ..., N }. With our settings the size of each feature SGb was ((30traj + 96HoG + 108HoF + 96M BHx + 96M BHy ) × 4)/10243 Gb, where the summed integers denote the dimensionality of each feature component. The approximate number of Dense Trajectory features extracted per dataset and per video is presented in Table 1, together with further dataset specific statistics.
6
Michael Sapienza1 , Fabio Cuzzolin1 , and Philip H.S. Torr2
Visual vocabulary. The k-means algorithm was used to generate the visual vocabulary for BoF and VLAD vectors. The greedy nature of k-means means that it may only converge to a local optimum. Therefore the algorithm was repeated 8-times to retain the clustering with the lowest error. The number of feature samples used to learn the vocabulary was set to a maximum of 10, 000 per cluster. We found that setting the pool of feature size to depend on the number of clusters allows faster vocabulary computation for small K without loss of performance. The maximum number of features was set to a maximum of 1 × 10⁶ in order to limit memory usage and computational time for larger K. Hardware constraints. With Dense Trajectory features [14], 1×10⁶ features translate to ∼ 1.6Gb of memory when using 32-bit floating point numbers, and may thus easily be worked with on a modern PC or laptop. All our experiments were carried out on an 8-core, 2GHz, 32GB workstation. Bag-of-features. In the BoF approach, histograms are computed by quantising features to the nearest cluster (minimum euclidean distance). Each BoF histogram was L1 normalised separately for each feature component and then jointly [3]. The same setup was used for BoF per-category, except that separate vocabularies were generated by clustering the features from each class and then joining them into one universal vocabulary. For both BoF approaches the exponentiated χ2 kernel SVM was used: ! K 1 X (hin − hjn )2 K(Hi , Hj ) = exp − , (1) 2A n=1 hin + hjn where Hi and Hj are the histograms associated by videos i and j, K is the number of cluster centres, and A is the mean value of all distances between training histograms [29,18,13]. VLAD and Fisher vectors. Initially, due to the high dimensionality of both VLAD and Fisher vectors, the Dense Trajectory feature components were independently reduced to 24 dimensions using PCA. We used the randomised PCA algorithm by Rokhlin et al. [30] to solve the U SV 0 decomposition on the same 1 × 10⁶ subsampled features used for dictionary learning. Instead of creating a visual vocabulary by clustering the feature space by k−means, as done in the BoF and VLAD approach [16], for Fisher vectors it is assumed that the features are distributed according to a parametric Gaussian mixture model (GMM). Whereas in BoF, the feature quantisation step is a lossy process [31], a Fisher vector is formed through the soft assignment of each feature point to each Gaussian in the visual vocabulary. Therefore, instead of being limited by a hard assignment, it encodes additional information about the distribution of each feature [15]. Both VLAD and Fisher vectors were computed using the implementations available in the VLFeat library [32]. We followed Perronnin et al. and apply power normalisation followed by L2 normalisation to each Fisher vector component separately [15], before normalising them jointly. Contrarily to expectations, it has been shown that Fisher vectors achieve top results with linear SVM classifiers [33,15]. Support vector machines. For both the χ2 kernel and linear SVMs, multi-class classification was performed using a 1-vs-all approach [34], and we keep the regularisation cost C=100 constant throughout [13,27].
Title Suppressed Due to Excessive Length
7
Algorithm 1 The sequence of steps used for generating a visual vocabulary for action classification datasets. Note that our proposed method (1a) is designed to be robust to an imbalance in the number of videos per category, and to an imbalance in the number of features per video. 1. Extract Dense Trajectory features [14] from videos and store them onP disk; N 2. For each dataset d, calculate the mean number of features µd = N1 i=1 ni , where ni is the total number of features extracted from clip vi , and i = {1, ..., N }; 3. Set the maximum number of videos to sample from Vmax based on the mean number of Gb features per video: Vmax = b µdM×S c, where MGb is the maximum memory available, and Gb SGb is the memory needed to store a single feature; 4. Subsample b Vmax c videos uniformly at random from each class (1a, class balancing), or Cd Vmax videos uniformly at random from the entire set of videos (1b), where Cd denotes the number of action categories in dataset d; 5. Load features into memory by uniformly subsampling min(nl , µd ) features per video (1a), or by loading all the features n in each video (1b), where l ⊆ i denotes the set of subsampled video indices; 6. Subsample min(1 × 10⁶ , K × 104 ) features (1a) at random, with a balanced number from each class, or (1b) at random from the entire set; 7. Perform k-means with K cluster centres separately per feature component (2a) or jointly by concatenating the feature components (2b); 8. Represent videos globally via BoF (3a), BoF per-category (3b), VLAD vectors (3c), or Fisher vectors (3d).
4.2
Variable components of the experiments
Test 1 - comparison of uniform random sampling strategies. We compared two methods of sampling descriptors, which formed the data on which the k-means algorithm operated in order to learn a visual vocabulary. Method 1a sampled a balanced random set of features from the dataset, accounting for an unbalanced number of videos per action category, and an unbalanced number of features per video (see Table 1). A uniform random selection of features without balancing was performed for method 1b. The exact sampling strategy is detailed in Algorithm 1, whilst the comparative performance will be discussed in section 5. Test 2 - comparison of joint and component-wise visual vocabulary generation. Here we learnt a visual vocabulary separately for each feature component (2a) such as the Trajectories, HoG, HoF, MBHx and MBHy components, and compared this to grouping these features together and learning a joint vocabulary (2b). Test 3 - comparison of global representations. For each experimental setting, we assessed the performance of the following four global representations: standard BoF (3a), BoF per-category (3b), VLAD (3c) and Fisher vectors (3d). Each variation was run for 7 values of K cluster centres, ranging from 22 to 28 in integer powers of 2.
5
Results and discussion
Our experiments consisted of 2 binary tests (1a-b, 2a-b) for 7 values of K cluster centres, 4 representation types (3a-d) and 4 datasets, for a total of 22 × 7 × 4 × 4 =
8
Michael Sapienza1 , Fabio Cuzzolin1 , and Philip H.S. Torr2
112 × 4 = 448 experimental runs, the results of which are shown in Figs. 1-4. The best quantitative results were further listed in Table 2 in order to compare them to the current state-of-the-art. For each dataset, we presented: i) the classification accuracy plotted against the number of clusters K, ii) the accuracy plotted against the final representation dimensionality D. Note that the horizontal axis marks for Figs. 1-4 are evenly spaced, thus encoding only the ordering of K and D. The computational time needed to generate the results was approximately 130 CPU hours for KTH, 1290 CPU hours for YouTube, 1164.8 CPU hours for Hollywood2, and 974 CPU hours on the HMDB dataset. The KTH dataset results were plotted in Fig. 1. The accuracy quickly shot up with increasing dimensionality and saturates. By looking at the curves of Fig. 1, one may identify the best performing method under a value of K and representation size D. For example the dotted line in Fig. 1 highlights the methods at D = 192, where several test configurations span an accuracy gap of approximately 12%. In this case, the BoF per-category (3b) at D = 192 (32 clusters ×6 classes) surpassed the current stateof-the-art with 97.69% accuracy, 98.08% mAP, and 97.68% mF1 score. Note that the histogram was formed by sampling the features uniformly at random (1b) and clustering the features jointly (1b). The results from the YouTube dataset did not follow the same pattern as for KTH, as seen in Fig. 2. The inverted ‘U’ pattern generated by the BoF and BoF per-category results indicated that higher dimensional representations, when combined with the χ2 kernel SVM lead to overfitting. This was no so for Fisher vectors and linear SVMs, which outperformed all the BoF results with only 4 cluster centres per feature component (see dotted line in Fig. 2-right). Here one can clearly see the benefit of using separate vocabularies per feature type (see Fisher joint (2b) vs. Fisher separate (2a)), and the advantage of random balanced sampling as the number of classes and videos has increased compared to KTH. Comparing the results obtained as a function of K, on the YouTube dataset, Fisher vectors (3d) outperformed the other representation types 96.43% of the time, generating a visual vocabulary separately per feature was best for 85 .71% of the trials, whilst using a random and balanced feature selection was best 66% of the time. The Hollywood2 results of Fig. 3 (right) highlight the initially increased performance obtained using BoF at low values of K, which were eventually overtaken by the high dimensional Fisher and VLAD vectors with a linear SVM at the top of the curve. In fact, at dotted line (1), BoF per-category with joint features and balanced sampling (3b-2b-1a at D = 48) achieves 5% higher accuracy than the equivalent Fisher vector at D = 192. Even though at the top of the curve Fisher vectors achieve the highest accuracy, note that BoF per-category is very close behind with a separate (2a) and balanced (2a) vocabulary (purple circle). The Hollywood2 dataset has the largest variance in the number of features per video clip (see Table 1), making it more susceptible to randomly selecting an imbalanced feature set for k-means. For example, the outlier for VLAD at D = 192 in Fig. 3 (right, dotted line 2) may be caused by the biased feature sampling of method (1b), which has the undesirable effect of excluding discriminative features from the learned vocabulary, and over-representing features which appear more frequently in the dataset. Again
Title Suppressed Due to Excessive Length
100
100
95
95
90
90
85
85
80
80
75
75
70
70
65
65
60
60
55
55
4
8
16
32
64
128
256
50
4 8
61440 30720 15360 12288 7680 6144 3840 3072 1920 1536 1280 960 768 640 480 384 320 256 240 192 160 128 120 96 80 64 48 40 32 24 20 16
50
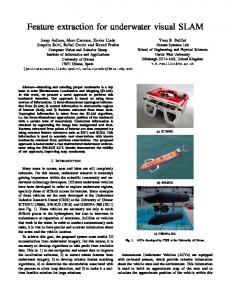
9
Fig. 1. KTH dataset classification accuracy using a global video representation. (left) The Accuracy is plotted against the number of cluster centres K, and (right) against the representation dimensionality. Note that with a small number of cluster centres (left), high dimensional representations may be achieved (right), for example when generating vocabularies separately per feature component or per action class. In the rightmost plot, at a relatively low representation dimensionality D = 192, there are several competing representations within a ∼12% range in accuracy. The best representation method, however, on this dataset is BoF per-category (3b) with a single joint visual vocabulary (2b) and features sampled at random (1b).
100
100
95
95
90
90
85
85
80
80
75
75
70
70
65
65
60
60
55
55
50
50
45
45
40
40
35
35
30
30
25
25 4
8
16
32
64
128
256
20
4 8
61440 30720 15360 14080 12288 7680 7040 6144 3840 3520 3072 2816 1920 1760 1536 1408 1280 960 880 768 704 640 480 440 384 352 320 256 220 192 176 160 128 96 88 80 64 44 40 32 20 16
20
Fig. 2. YouTube dataset classification results. (left) Accuracy vs. K cluster centres, and (right) accuracy vs. representation dimensionality. Notice (right) the inverted ‘U’ paths traced by the χ2 kernel SVM (BoF and BoF per category) as opposed to those generated by the linear SVM (VLAD and Fisher vectors). The dotted line indicates the group of data points at D = 960 and highlights the top performing method, which is Fisher vectors with only 4 clusters per feature component. The error bars over 25 folds have been suppressed for clarity.
Michael Sapienza1 , Fabio Cuzzolin1 , and Philip H.S. Torr2
10
70
70
65
65
60
60
55
55
50
50
45
45
40
40
35
35
30
30
25
25
20
20
4
8
16
32
64
128
256
15
4 8
61440 30720 15360 12288 7680 6144 3840 3072 1920 1536 1280 960 768 640 480 384 320 256 240 192 160 128 96 80 64 48 40 32 20 16
15
Fig. 3. The classification accuracy versus K cluster centres (left) and representation dimensionality (right) on the Hollywood2 dataset. For the BoF method, notice the significant jump in performance (left) between joint (red/blue crosses) and separate (green/black crosses) feature component vocabulary learning. It is also noteworthy (right) that at low dimensionalities, the Chisquare kernel SVM far outperforms the linear SVM, but for higher dimensional vectors, linear SVM surpasses the former. Dotted lines (1) and (2) highlight situations in which (1) BoF-per category achieves competitive performance for small K, and (2) random balanced sampling helps preventing situations in which a bias in the sampled feature pool may give poor results.
55
55
50
50
45
45
40
40
35
35
30
30
25
25
20
20
15
15
10
10
5
5
4
8
16
32
64
128
256
0
4 8
65280 61440 32640 30720 16320 15360 13056 12288 8160 7680 6528 6144 4080 3840 3264 3072 2040 1920 1632 1536 1280 1020 960 816 768 640 480 408 384 320 256 204 192 160 128 96 80 64 40 32 20 16
0
Fig. 4. The classification accuracy versus K cluster centres (left) and representation dimensionality (right) for the HMDB dataset. The differences between the random and balanced features becomes more significant at higher values of K. For example, this is clearly seen between (1) the purple vs. green curves of separate BoF per-category, (2) the yellow vs. pink of joint BoF per-category, and (3) the cyan vs. brown curves of Fisher vectors. The error bars in the figure denote one standard deviation over the three train-test splits defined by the HMDB authors [11]. The grey horizontal bar just under 2% marks the chance level.
Title Suppressed Due to Excessive Length
11
Table 2. The current state-of-the-art (S-O-T-A) results compared to our best results obtained with the global bag-of-features pipeline (Global best). The best results are marked in bold. The Variables row indicates which of the varying parameters in Algorithm 1 gave the best result. The variations ‘a’ are marked in bold to distinguish them from variations ‘b’. K − D indicates the number of clusters K and the representation dimensionality D. For datasets with more than one train-test split (YouTube, HMDB, USF51, c.f. Section 3), we report one standard deviation around the mean. KTH Acc mAP mF1
S-O-T-A 96.76 [3] 97.88 [3] 96.73 [3]
Global best 97.69 98.08 97.68
Variables 3b-2b-1b 3b-2a-1b 3b-2b-1b
K-D 32 - 192 64 - 384 32 - 192
YouTube Acc mAP mF1
S-O-T-A 85.4 [35] 89 [2] 82.43 [3]
Global best 89.62 ±5.41 94.25 ±3.50 87.45 ±6.92
Variables 3d-2a-1b 3d-2a-1a 3d-2a-1b
K-D 128 - 30,720 128 - 30,720 128 - 30,720
Hollywood2 Acc mAP mF1
S-O-T-A 60.85 [3] 63.3 [2] 52.03 [3]
Global best 65.16 59.66 54.55
Variables 3d-2a-1a 3d-2a-1a 3d-2a-1a
K-D 128 - 30,720 256 - 61,440 256 - 61,440
HMDB Acc mAP mF1
S-O-T-A 48.3 [35] 54.8 [2] 52.03 [3]
Global best 50.17 ±0.614 50.07 ±0.33 48.88 ±0.94
Variables 3c-2a-1a 3d-2a-1a 3d-2a-1a
K-D 256 - 61,440 256 - 61,440 256 - 61,440
USF101 Acc mAP mF1
S-O-T-A 43.9 [12], 85.9[36] – –
Global best 81.24 ±1.11 82.35 ±0.97 80.57 ±1.11
Variables 3d-2a-1a 3d-2a-1a 3d-2a-1a
K-D 256 - 61,440 256 - 61,440 256 - 61,440
on this dataset, learning vocabularies separately per feature component greatly outperformed learning vocabularies jointly, for every representation dimensionality value D. Here, the best performing approach made use of Fisher vectors (3d), with randombalanced sampling (1a) and features clustered per component (2a), which outperformed the current state-of-the-art by 4.32% (see Table 2). Large performance differences were also observed in Fig. 4 for the HMDB dataset. With an increased number of action classes, one can more easily see the performance gained by ‘balanced’ sampling rather than uniform random sampling. For example, see the differences between the yellow and pink curves of BoF joint per-category (Fig. 4 right, dotted lines 2), or the cyan and brown curves of Fisher vector joint random vs. random-balanced (Fig. 4 right, dotted lines 3). This was only observed at higher dimensionalities though, and overall ‘balanced’ sampling outperformed random sampling just 53% of the time. Note however that the best accuracy, mean average precision and mean F1 scores on the Hollywood2 and HMDB datasets were obtained using random-
12
Michael Sapienza1 , Fabio Cuzzolin1 , and Philip H.S. Torr2
balanced sampling, as shown in Table 2. In Fig. 4, one can also observe the benefit of BoF per-category, which outperforms BoF by learning separate vocabularies per action class. We estimated that to run an additional 112 experiments on UCF101 dataset would take approximately 1 CPU year, and thus report only a single run with the best performing variable components observed in the experiments so far, namely Fisher vectors, balanced sampling and separate vocabulary learning. UCF101 is the largest current action recognition dataset (see Table 1), however it may not be the most challenging. We achieved, 81.24%, 82.35%, 80.57% accuracy, mAP and F1 scores respectively averaged over the three train test splits provided by the authors [12]. Our reported accuracy is 37.34% higher than the original results reported in [12], and 4.6% short of the result reported in [35], which additionally used spatial pyramids and a variation of the Dense Trajectory features which estimates camera motion information [37]. The computational time needed to generate this result on the UCF101 results was 163.52 CPU hours. Interestingly, a large part of the computational time is spent loading features from disk. Thus even though the chance level of UCF101 is just under 1%, our results indicate that the HMDB dataset remains the most challenging action classification dataset currently available. The overall best results are listed in Table 2; by using our approach (Algorithm 1) with an increased number of model parameters (using a larger K, or by using spatial pyramids[38]) may yield further improvements to the current state-of-the-art results.
6
Conclusion
In this work we proposed to evaluate aspects of the bag-of-features pipeline previously unexplored, on the largest and most challenging action recognition benchmarks, and achieved state-of-the-art results across the board. In particular, we focused on the feature subsampling and partitioning step after features have been extracted from videos, but prior to encoding. Since uniform random sampling of features to create a vocabulary may be biased towards longer videos and action classes with more data, we compared uniform random sampling to sampling a random and balanced subset from each video and action class. The best results obtained showed that the proposed sampling strategies did yield minor performance improvements, and helped preventing poor results that may follow from sampling an unbalanced set of features (see Fig. 3 dotted line 2); other balancing strategies may provide further improvements. We also showed that learning separate vocabularies per feature component caused very large improvements in performance. Furthermore, learning BoF per-category outperformed BoF, but was surpassed by Fisher vectors on the larger and more challenging datasets. Finally, our results demonstrated that competitive results may be achieved by using k-means with a relatively small number of cluster centres K.
References 1. Perronnin, F., Liu, Y., S´anchez, J., Poirier, H.: Large-scale image retrieval with compressed fisher vectors. In: CVPR. (2010)
Title Suppressed Due to Excessive Length
13
2. Oneata, D., Verbeek, J., Schmid, C.: Action and event recognition with fisher vectors on a compact feature set. In: ICCV. (2013) 3. Sapienza, M., Cuzzolin, F., Torr, P.H.: Learning discriminative space-time action parts from weakly labelled videos. IJCV (2013) 4. Farquhar, J., Szedmak, S., Meng, H., Shawe-Taylor, J.: Improving “bag-of-keypoints” image categorisation: Generative models and pdf-kernels. In: ECCV. (2005) 5. Csurka, G., Dance, C.R., Fan, L., Willamowski, J., Bray, C.: Visual categirization with bags of keypoints. In: ECCV. (2004) 6. Perronnin, F., Dance, C., Csurka, G., Bressan, M.: Adapted vocabularies for generic visual categorisation. In: ECCV. (2006) 7. Nowak, E., Jurie, F., Triggs, B.: Sampling strategies for bag-of-features image classification. In: ECCV. (2006) 8. Jiang, Y.G., Ngo, C.W., Yang, J.: Towards optimal bag-of-features for object categorization and semantic video retrieval. In: ACM International Conference on Image and Video Retrieval. (2007) 9. Nist´er, D., Stew´enius, H.: Scalable recognition with a vocabulary tree. In: CVPR. (2006) 10. Sivic, J., Zisserman, A.: Video google: A text retrieval approach to object matching in videos. In: ICCV. (2003) 11. Kuehne, H., Jhuang, H., Garrote, E., Poggio, T., Serre, T.: HMDB: A large video database for human motion recognition. In: ICCV. (2011) 12. Soomro, K., Zamir, A.R., Shah, M.: UCF101: A dataset of 101 human action classes from videos in the wild. Technical report, CRCV-TR-12-01 (2012) 13. Wang, H., Ullah, M., Kl¨aser, A., Laptev, I., Schmid, C.: Evaluation of local spatio-temporal features for action recognition. In: BMVC. (2009) 14. Wang, H., Kl¨aser, A., Schmid, C., Liu, C.: Action Recognition by Dense Trajectories. In: CVPR. (2011) 15. Perronnin, F., S´anchez, J., Mensink, T.: Improving the fisher kernel for large-scale image classification. In: ECCV. (2010) 16. J´egou, H., Perronnin, F., Douze, M., S´anchez, J., P´erez, P., Schmid, C.: Aggregating local image descriptors into compact codes. PAMI 34(9) (2011) 1704–1716 17. Chatfield, K., Lempitsky, V., Vedaldi, A., Zisserman, A.: The devil is in the details: an evaluation of recent feature encoding methods. In: BMVC. (2011) 18. Laptev, I., Marszałek, M., Schmid, C., Rozenfeld, B.: Learning realistic human actions from movies. In: CVPR. (2008) 19. Marszałek, M., Laptev, I., Schmid, C.: Actions in context. In: CVPR. (2009) 20. Sch¨uldt, C., Laptev, I., Caputo, B.: Recognizing human actions: A local SVM approach. In: ICPR. (2004) 21. Liu, J., Luo, J., Shah, M.: Recognising realistic actions from videos “in the wild”. In: BMVC. (2009) 22. Sapienza, M., Cuzzolin, F., Torr, P.H.: Learning discriminative space-time actions from weakly labelled videos. In: BMVC. (2012) 23. Laptev, I., Lindeberg, T.: Space-time interest points. In: ICCV. (2003) 24. Willems, G., Tuytelaars, T., Gool, L.V.: An efficient dense and scale-invariant spatiotemporal interest point detector. In: ECCV. (2008) 25. Kl¨aser, A., Marszałek, M., Schmid, C.: A spatio-temporal descriptor based on 3D-gradients. In: BMVC. (2008) 26. Jhuang, H., Serre, T., Wolf, L., Poggio, T.: A biologically inspired system for action recognition. In: ICCV. (2007) 27. Le, Q., Zou, W., Yeung, S., Ng, A.: Learning hierarchical invariant spatio-temporal features for action recognition with independent subspace analysis. In: CVPR. (2011)
14
Michael Sapienza1 , Fabio Cuzzolin1 , and Philip H.S. Torr2
28. Dalal, N., Triggs, B., Schmid, C.: Human detection using oriented histograms of flow and appearance. In: ECCV. (2006) 29. Zhang, J., Marszałek, M., Lazebnik, S., Schmid, C.: Local features and kernels for classification of texture and object categories: A conprehensive study. IJCV 73(2) (2007) 213–238 30. Rokhlin, V., Szlam, A., Tygert, M.: A randomized algorithm for principal component analysis. SIAM Journal on Matrix Analysis and Applications 31(3) (2009) 1100–1124 31. Boiman, O., Shechtman, E., Irani, M.: In defense of nearest-neighbor based image classification. In: CVPR. (2008) 32. Vedaldi, A., Fulkerson, B.: VLFeat: An open and portable library of computer vision algorithms. http://www.vlfeat.org/ (2008) 33. Fan, R., Chang, K., Hsieh, C., Wang, X., Lin, C.J.: Liblinear: A library for large linear classification. Journal of Machine Learning Research 9 (2008) 1871–1874 34. Chang, C.C., Lin, C.J.: LIBSVM: A library for support vector machines. ACM Transactions on Intelligent Systems and Technology 2 (2011) 27:1–27:27 Software available at http: //www.csie.ntu.edu.tw/˜cjlin/libsvm. 35. Wang, H., Kl¨aser, A., Schmid, C., Liu, C.: Dense trajectories and motion boundary descriptors for action recognition. IJCV 103(1) (2013) 60 – 79 36. Wang, H., Schmid, C.: Lear-inria submission for the thumos workshop. In: ICCV. (2013) 37. Wang, H., Schmid, C.: Action recogntiion with improved trajectories. In: ICCV. (2013) 38. Lazebnik, S., Schmid, C., Ponce, J.: Beyond bags of features: Spatial pyramid matching for recognizing natural scene categories. In: CVPR. (2006)