Feature Selection Paradigm using Weighted Probabilistic Approach Krupal S. Parikh and Trupti P. Shah
ISSN 2005-4238 Volume 100, 2017
International Journal of Advanced Science and Technology Vol. 100 (2017), pp.1-14 http://dx.doi.org/10.14257/ijast.2017.100.01
Science & Engineering Research Support soCiety Copyright © 2017 SERSC All rights reserved
International Journal of Advanced Science and Technology Vol.100 (2017), pp.1-14 http://dx.doi.org/10.14257/ijast.2017.100.01
Feature Selection Paradigm using Weighted Probabilistic Approach Krupal S. Parikh1* and Trupti P. Shah2 1*
Department of Applied Mathematics, Faculty of Technology & Engineering, The M. S. University of Baroda, Vadodara, Gujarat State, India- 390 001
[email protected] 2 Department of Applied Mathematics, Faculty of Technology & Engineering, The M. S. University of Baroda, Vadodara, Gujarat State, India- 390 001
[email protected] Abstract
The data sets having large pool of features with few samples usually suffer from high dimensionality problem in classification tasks. Construction of appropriate model with proper feature selection technique is very important pre-processing step in classification. It reduces over fitting problem and increases accuracy especially when model construction uses classifier such as support vector machine. The paper presents a new weighted probabilistic approach for feature selection, named Filter technique and Partial Forward Search (F_PFS) algorithm and decides the best models of support vector machines to diagnose various skin diseases. Experimental results show efficiency of new algorithm. Keywords: Feature Selection; Filter technique and Partial Forward Search (F_PFS) algorithm; Skin Diseases; Support Vector Machine (SVM); Weighted Probability
1. Introduction There are many bioinformatics applications where data sets contain large number of features but limited samples. Some features are highly correlated, which unnecessarily increase dimensionality. Also, in some applications features are not correlated to the class and increase noise. This may lead the classifier (learning algorithm) to over fit to noise. Dimensionality reduction is an important problem in statistical learning. Using feature selection process a small number of discriminative features can be found which reduce the dimensionality, computational cost and increase accuracy of the classifier. Basically there are three techniques of feature selection: Filter method, Wrapper method and Embedded method. Filter methods use some statistical measure to give ranks to features and use a threshold to obtain a subset of feature set [6].In this method each individual feature is evaluated and the less interesting features are suppressed. It finds the subset of feature set without involving any learning algorithm. It relies only on the general category of the training data [14]. Filter methods such as Correlation based filter technique [14, 8] and mutual information technique [15, 8, 16, 5, 14] use measure of dependency between two attributes to determine rank. To give ranks to all features posterior probabilistic approach is used [13]. Many feature selection algorithms focus on finding correlation between features and labels and finds optimal set of relevant features. But, relevance of feature does not mean that it is in optimal subset of features. Similar is also true for irrelevance of feature. Many machine learning algorithm such as induction of decision tree algorithm, instance-based algorithm are facing the problem of irrelevant features. Their performance degrades if irrelevant features are added in the set of features. In Naive-Based algorithm accuracy does not change significantly if more irreverent features are added to the feature
ISSN: 2005-4238 IJAST Copyright ⓒ 2017 SERSC
International Journal of Advanced Science and Technology Vol.100 (2017)
set but performance affects if correlated features are added. Relief is another algorithm which searches not only most relevance features but searches both weak and strong relevant features [16]. Filter methods index is calculated based on single feature without considering orthogonality between features which is not always true and it is one of the weaknesses of filter methods [19]. Wrapper is another method of feature selection. It uses classifier performance as an objective function to evaluate feature. It conducts a search for best feature subset using induction algorithm. Sequential selection algorithm and Heuristic search algorithms are two main techniques of wrapper methods. Sequential search algorithms include forward sequential algorithm and backward selection algorithm. Forward sequential algorithms start with empty set, add one feature every time and for each subset find accuracy using some classifier. The subset of feature set giving the optimum value of the objective function under study is considered as the best subset of feature set. Backward selection algorithms start with full set, remove one feature in every step and find best model. Another technique, which is heuristic search algorithm evaluate different subsets to find optimum value of the obj ective function. In this method for n features, the size of the search space is O(2 n), which is a NP-hard problem[6]. Kohavi and John[16] presented a more formal discussion of this kind of methodology by introducing variability in choices of classifiers and search strategies. Filtered and Supported Sequential Forward Search (FS_SFS) algorithm takes into account both the discriminate ability of individual features and the correlation between them. It filters out nonessential features and reduces search space [20]. Combination of filter method and wrapper method i.e. Hybrid feature selection method is used by Xie et al. [9]. Wrapper methods are very slow. For larger data sets, less number of folds can be used to train a classifier [16] otherwise, computational cost is very high. Due to these limitations sometimes we may not find the best values of parameters. Third approach of feature selection is embedded methods, in which feature selections are done using classifier. For training data set consisting of labeled as well as unlabelled data, semi supervised learning algorithm is used where the embedded feature selection method is used to extract information about unlabelled data [22]. In [1] an embedded approach used for classification of microarray data sets. The algorithm is combination of a problem specific cross over operator and a dedicated local search procedure. In this paper, using proposed new feature selection algorithm, we remove weakness of both filter and wrapper techniques and use good features of both techniques by using the hybrid feature selection method. We apply our method on two skin data sets to diagnose various skin diseases. Skin diseases are very common and having skin lesion very close to each other, it sometimes become difficult to diagnose at early stage. Out of the two data sets in our study, one data set includes data related to Erythemato-Squamous skin disease. Asian and African race people are less affected by this disease due melanin in their skin. But, Americans are directly affected by ozone depletion, and so many American people are suffering a lot from Erythomato-Squamous skin disease. A differential diagnosis of this disease is a challenging task. Xie et al. [10] used the same data set and applied Improved F-score method of feature selection using SVM. The other data set includes data related to common skin infections such as Bacterial skin Infection, Fungal skin Infection, Eczema and Scabies. Parikh & Shah [11, 12] discussed the importance of diagnoses of such diseases and classifies them using ANN and SVM. Our proposed method (F_PFS method) of feature selection using SVM, obtained good classification accuracy for these two data sets with less number of features. F-measure is used to evaluate accuracy. The rest of the paper is organized as follows. Section 2 reviews the Support Vector Machine (SVM). Section 3 focuses on proposed method (Weighted Probabilistic Approach) for Feature Selection named F_PFS method. Experimental setup, Experiments
2
Copyright ⓒ 2017 SERSC
International Journal of Advanced Science and Technology Vol.100 (2017)
and results to assess the effectiveness of the new algorithm is discussed in section 4 which is followed by the conclusion in section 5.
2. Support Vector Machine(SVM) Support Vector Machine is one of the most popular supervised learning algorithms. It was originally developed for two class classification. It can be used for multiclass classification using one-to-one or one-to-all algorithm [2, 18]. It can separate highly nonlinear data by separating hyper plane in high dimensional feature space using kernel function () : z ( z), where z denotes a vector in feature space. Its attractive feature is kernel trick in which dot product of kernel functions is taken in feature space using input variables. So, dimensionality will not increase. It gives global optimum because of the mercer kernel [3]. Consider training set of N samples X i , yi , where each X i , i 1,2,...N be the m dimensional vector indicating m features in each sample and yi be the corresponding class label. A soft margin SVM classifier aims at solving the following optimization problem, N 1 2 w C i w,b,i 2 i 1
min
(1)
subject to yi wT xi b 1 i, i 0, i 1,2,...N .
Where xi called kernel function which maps xi into high dimensional space, C 0 is the regularization parameter which gives the tradeoff between marginal error and testing error, controls the cost of misclassification errors. Instead of solving the high dimensional vector variable w , we usually solve the corresponding dual problem [3]. min i
N 1N N i j yi y j xi x j i , 2 i 1 j 1 i 1
N
subject to i yi 0 , i 1
(2)
0 i C .
The decision function for input vector z is given by, N sgn w.z b sgn i yi K xi , z b i 1
where w i yi xi , K xi , z xi .z N
i 1
(3) 1, x 0 and sgn x 0, x 0 1, x 0
3. Weighted Probabilistic Approach for Feature Selection (F_PFS method) A new approach called weighted probabilistic approach for feature selection use weighted probability of each feature to assign rank. If a feature frequently occurs in the data set, it is considered as a high probability feature and which indicates its importance in prediction. In any diagnosis the common features are focused first. The common features are the features having high probability. So, we include all common features in
Copyright ⓒ 2017 SERSC
3
International Journal of Advanced Science and Technology Vol.100 (2017)
our base model. The method works on both balanced and imbalanced data sets. It can be applied to multiclass data classification also. The method is divided into three phases. In the first phase we use filter method of feature selection and determine weighted probability of each feature. In the second phase we arrange the features in the descending order of weighted probability value and find its average. We define average weighted probability value as threshold value and finally obtain base model which includes only those features whose weighted probabilities are more than the threshold. In third phase we use Support Vector Machine as classifier to find the best model. Wrapper method is started with the base model and use forward search algorithm. We follow the following procedure: Step 1:Take a training set X i , y i where each X i , i 1,2,..., N be the m dimensional vector indicating m features f1 , f 2 ,... f m in each sample and y i be the corresponding class label taking the values 1,2,..., NC where NC indicate the number of classes. ri , i 0,1,...l be the score given to each feature in the data set according to the intensity of the feature, where l is an integer indicating highest score(maximum intensity) of the feature. For class k , k 1,2,..., NC find total number of scores ni , i 1,2,...,l corresponding to ri , i 1,2,...l respectively for the j th , j 1,2,...m feature. Let d k denote the number of training instances in the k th class where k 1,2,...NC . l
R rj
Step 2: Find
j 1
which is total of scores given to each feature.
Step 3: For each feature the probability of ri , i 1,2,...,l for the class k , k 1,2,...NC be n p ri i , i 1,2,...l dk Step
4:
Then
l r p k i . p ri , i 1 R
the
probability
of
the
j th
feature
for
the
class
k be
i r k 1,2,...NC . i 1 i 1 R
N
Step 5: Weight for the jth feature for the class k is Wk
NC
dk
N
k 1
d k
,
k 1,2,...NC
NC
wk 1 k 1 NC
Step 6: Weighted probability of j th feature is p j Wk pk , i 1,2,...,m k 1
Step 7: Find the threshold which is the average of the weighted probability of m features m p for the entire training data set. i.e. T j m j 1 Step 8: Arrange the features in the decreasing order of weighted probabilities. Step 9: Set the base model as the subset of feature set including only those features whose weighted probabilities are more than threshold value.
4
Copyright ⓒ 2017 SERSC
International Journal of Advanced Science and Technology Vol.100 (2017)
Step 10: Apply Partial Forward Search Algorithm which start finding accuracy of the base model using Support Vector Machine (SVM). We use Radial Bases Function (RBF) as
kernel function defined as exp x y
2
.
Step 11: Add one feature at each step with weighted probability just lower than that of the feature added in the previous step. Each time find the accuracy of the model obtained by adding new feature using SVM learning algorithm. Step 12: Compare accuracy of all model and select the model as the best model which gives the highest classification accuracy. This approach is tested on two different skin data sets. Description of the data set is given in the next section.
4. Experimentations and Results 4.1 Data Sets 4.1.1 Data set-1 Common skin diseases such as bacterial infection, fungal Infection, eczema and scabies: We collected the data from Department of Skin & V.D., Shrikrishna Hospital, Karamsad, Gujarat, India. The data set contains 470 patients information. We have prepared detailed proforma under the guidance of dermatologist. The proforma contains 47 features. Out of 470 samples, 139 samples are of Bacterial infection, 146 are of Fungal Infection, 98 are of Eczema and 87 are of Scabies. Features investigated during data collection are mentioned in Table 1. Table 1. Attributes Information for Data Set-1 Chief Complaints & OPD:
Associated With
1. Pain 2. Fever 3. Itching Seasonal relation 4. Summer 5. Winter 6. Monsoon Past History 7. Diabetes Mellitus 8. Family History
23. 24. 25. 26. 27. 28. Shape 29. 30. 31. Sites
Lichenification Oozing Crusting Scaling Excoriation Discharge
32. 33. 34. 35. 36. 37. 38. 39. 40. 41. 42. 43.
Webspaces Wrist Forearm Arm Chest Abdomen Genitals Thigh Legs Dorsa of feet Back Buttocks
Occupational History: 9. Hot and humid environment 10. Exposure to irritants 11. Excessive sun exposure Type of Lesion 12. Macules 13. Patches 14. Papules 15. Pustule 16. Nodule 17. Plaques 18. Vesicles 19. Bullae
Copyright ⓒ 2017 SERSC
Linear Annular Grouped
5
International Journal of Advanced Science and Technology Vol.100 (2017)
Colour 20. Erythematous 21. Hyperpigmented 22. Hypopigmented
44. 45. 46. 47.
Palms & Soles Hair Nail Face
4.1.2 Data set-2 Erythemato-Squamous Skin Disease: This data set is from UCI (University of California Irvine) machine learning database[10]. Actual database contains 34 attributes, 33 of which are linear valued and one of them is nominal. We consider only 33 features in our study. The last feature which is the age of patient is omitted . The differential diagnosis of erythemato-squamous diseases is a real problem in dermatology. They all share the clinical features of erythema and scaling, with very little differences. The diseases in this group are psoriasis, seboreic dermatitis, lichenplanus, pityriasis rosea, cronic dermatitis, and pityriasis rubra pilaris. Usually abiopsy is necessary for the diagnosis but unfortunately these diseases share many histopathological features as well. Another difficulty for the differential diagnosis is that a disease may show the features of another disease at the beginning stage and may have some characteristic features in the following stages. Patients were first evaluated clinically with 11 features. Afterwards, skin samples were taken for the evaluation of 22 histopathological features. The values of the histopathological features are determined by an analysis of the samples under a microscope. In the dataset constructed for this domain, the family history feature has the value 1 if any of these diseases have been observed in the family and 0 otherwise. Every other feature (clinical and histopathological) is given a degree in the range of 0 to 3. Here, 0 indicates that the feature was not present, 3 indicates the largest amount possible, and 1, 2 indicate the relative intermediate values. Number of patients in the data set is 366. Patients for Psoriasis is 112, for Seboreic dermatitis is 61, for Lichen planus is 72, for Pityriasis rosea is 49, for Chronic dermatitis is 52 and for Pityriasis rubra pilaris is 20.Features included in the data set are discussed in Table 2. Table 2. Attributes Information for Data Set -2 Clinical Attributes: 1 Erythema 2 scaling 3 definite borders 4 itching 5 koebner phenomenon 6 polygonal papules 7 8 9 10 11
follicular papules Oral mucosal involvement knee and elbow involvement scalp involvement family history, (0 or 1)
Histopathological Attributes: 12 melanin incontinence 13 eosinophils in the infiltrate 14 PNL infiltrate 15 fibrosis of the papillary dermis
6
Histopathological Attributes: 17 Acanthosis 18 hyperkeratosis 19 parakeratosis 20 clubbing of the rete ridges 21 elongation of the rete ridges 22 thinning of the suprapapillary epidermis 23 spongiform pustule 24 munro microabcess 25
focal hypergranulosis
26 27
disappearance of the granular layer vacuolisation and damage of basal layer spongiosis saw-tooth appearance of retes follicular horn plug
28 29 30 31 32
perifollicular parakeratosis inflammatory monoluclear inflitrate
Copyright ⓒ 2017 SERSC
International Journal of Advanced Science and Technology Vol.100 (2017)
16
exocytosis
33
band-like infiltrate
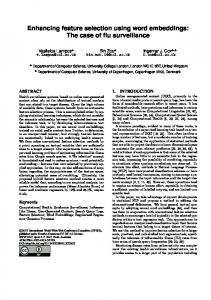
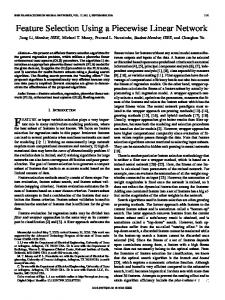
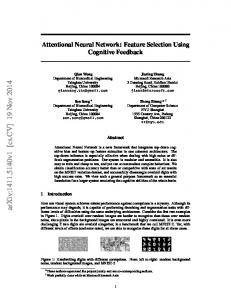
4.2 Experimental Set Up In the experiment, SVM is used as a classifier. The SVM was implemented using LIBSVM-3.18[4]. All experiments are performed in MATLAB interface. For each data set experiments are carried out on 60-40%, 70-30% and 80-20% training-testing data partitions. We use Radial Bases Function (RBF) as kernel function defined as 2 exp x y . The 10 folds cross validation criteria is used to set values of the parameter of RBF kernel and regularization parameter C of the SVM optimization problem (1) in each case. 4.3 Result Analysis and Comparative Study Table 3 and Table 4 show the results of proposed method (F_PFS method) applied to the data set-1 and data set-2 respectively. For comparison of proposed F_PFS method with that of Improved F-score sequential forward search (IFSFS) [9], we apply improved F-score method to Data set-1 to assign rank and corresponding results are discussed in Table 5. For data set-1, 19 features have weighted probability greater than threshold value and that of for data set-2 is for 13 features. So base model for data set-1 contains 19 features out of total 47 features and that for data set-2 contains 13 features of total 33 features. We use support vector machine as classifier to find best model for data set-1 and Data set2 using wrapper method. From table 3 we see that by applying wrapper method to data set-1, the highest accuracy obtained is 89.36% for 35 features (model #17) for 70-30% data partitions. For the same model obtained accuracy is 86.70% and 88.30% for 60-40% and 80-20% data partitions respectively. When F_PFS method is applied on data set-2(Table-4), highest accuracy achieved is 97.27% for 20 features out of 33 features (model #8) by taking 70-30% data partitions and for the same model 93.15% and 95.89% accuracy is obtained taking 60-40% and 80-20% data partitions respectively. Xie et al. [9] used the same data set and achieved highest accuracy of 98.65% for the 70-30% training-testing data partitions. This is slightly more than the accuracy obtaining for our proposed probabilistic approach method. But, this accuracy is obtained for 21 features, while the highest accuracy by our method is for 20 features. Also, because of our partial forward search algorithm in which wrapper technique starts from base model containing 13 features, we can say that the computational effort using our method is less. When the method used in [9] is applied to data set-1(Table-5), the highest accuracy obtained is 89.36% for 70-30% data partitions for the model contains 38 features, while the same accuracy obtained by our method is with 35 features. The graphical representation of results of Table 3, Table 4 and Table 5 is given in Fig 1, Fig 2 and Fig 3 respectively which gives more clarity and easy analysis of this work. In all cases partitions are generated using random method.
Copyright ⓒ 2017 SERSC
7
International Journal of Advanced Science and Technology Vol.100 (2017)
Table 3. Weighted Probability Approach Applied on Data Set-1
8
Model No. #
Total Number of selected features
1
19
2
20
3
21
4
22
5
23
6
24
7
25
8
26
9
27
10
28
11
29
12
30
13
31
14
32
15
33
16
34
17
35
18
36
19
37
20
38
21
39
22
40
23
41
Selected features
3,20,4,31,30,5,14,8,38,13, 9,11,17,7,1,21,16,26,32 Features of Model No. 1+ Feature No.24 Features of Model No. 2 + Feature No.25 Features of Model No. 3 + Feature No.43 Features of Model No. 4 + Feature No.23 Features of Model No. 5 + Feature No.27 Features of Model No. 6 + Feature No.47 Features of Model No. 7 + Feature No.37 Features of Model No. 8 + Feature No. 6 Features of Model No. 9 + Feature No.10 Features of Model No. 10 + Feature No.40 Features of Model No. 11 + Feature No.42 Features of Model No. 12 + Feature No.33 Features of Model No. 13 + Feature No.29 Features of Model No. 14 + Feature No.28 Features of Model No. 15 + Feature No.34 Features of Model No. 16 + Feature No. 2 Features of Model No. 17 + Feature No.12 Features of Model No. 18 + Feature No.35 Features of Model No. 19 + Feature No.18 Features of Model No. 20 + Feature No.36 Features of Model No. 21 + Feature No.39 Features of Model No. 22 + Feature No.41
SVM Classification Accuracy in(%) for Different TrainingTesting Partitions 60-40%
70-30%
80-20%
77.13
80.14
77.66
74.47
82.27
74.47
79.26
82.98
75.53,
85.65
84.40
76.60
82.45
86.52
77.66
77.13
85.82
78.72
82.45
84.40
80.85
80.85
84.40
84.04
84.57
87.23
81.91
82.45
86.52
80.85
82.98
85.12
84.04
86.70
84.40
86.70
85.64
85.11
86.70
86.70
82.98
86.70
81.91
84.40
87.23
82.45
84.40
87.23
86.70
89.36
88.30
86.70
86.52
84.04
85.64
88.65
84.04
84.04
89.36
86.17
84.04
87.23
84.04
84.57
89.36
84.04
84.57
87.23
85.11
Copyright ⓒ 2017 SERSC
International Journal of Advanced Science and Technology Vol.100 (2017)
24
42
25
43
26
44
27
45
28
46
29
47
Features of Model No. 23 + Feature No.22 Features of Model No. 24 + Feature No.44 Features of Model No. 25 + Feature No.15 Features of Model No. 26 + Feature No. 45 Features of Model No. 27 + Feature No.46 Features of Model No. 28 + Feature No.19
84.57
87.23
84.04
83.51
87.23
86.17
82.98
87.23
86.17
85.64
89.36
84.04
84.57
87.23
81.92
85.64
87.234
81.92
95 90
Accuracy
85 60-40%
80
70-30%
75
80-20% 70 65 19 21 23 25 27 29 31 33 35 37 39 41 43 45 47 Number of Fetures
Figure1. F_PFS Method Applied to Data Set-1 Table 4. Weighted Probability Approach Applied on Data Set-2 Model No. #
Total Number of selected features
1
13
2
14
3
15
4
16
5
17
6
18
7
19
Copyright ⓒ 2017 SERSC
Selected features
1,17,32,2,16,28,3,19,4,7,3 1,9,30 Features of Model No. 1 + Feature No. 18 Features of Model No. 2 + Feature No.21 Features of Model No. 3 + Feature No.5 Features of Model No. 4 + Feature No.15 Features of Model No. 5 + Feature No.33 Features of Model No. 6 + Feature No.10
SVM Classification Accuracy(%) for Different Training-Testing Partitions 60-40%
70-30%
80-20%
84.93
79.09
93.15
86.30
84.55
86.99
88.18
90.41
92.73
94.52
93.15
94.55
94.52
89.73
95.45
95.89
92.46
95.45
90.41 94.52
95.89
9
International Journal of Advanced Science and Technology Vol.100 (2017)
8
20
9
21
10
22
11
23
12
24
13
25
14
26
15
27
16
28
17
29
18
30
19
31
20
32
21
33
Features of Model No. + Feature No.14 Features of Model No. + Feature No. 24 Features of Model No. + Feature No.27 Features of Model No. + Feature No.6 Features of Model No. 11 + Feature No.25 Features of Model No. + Feature No.11 Features of Model No. + Feature No.12 Features of Model No. 14 + Feature No.8 Features of Model No. + Feature No.20 Features of Model No. 16 + Feature No. 26 Features of Model No. 17 + Feature No.22 Features of Model No. + Feature No.23 Features of Model No. 19 + Feature No.13 Features of Model No. + Feature No.24
7 8 9 10
12 13
15
18
20
93.15
97.27
95.89
93.15
96.36
95.89
91.78
92.73
94.52
91.78
92.73
94.52
91.78
92.73
94.52
91.10
92.73
94.52
91.10
92.73
94.52
89.04
92.73
94.52
89.73
90.91
94.52
92.47
92.73
93.15
93.15
90.91
93.15
89.73
90.91
94.52
91.78
92.73
94.52
91.78
92.73
94.52
120 100
Accuracy
80 60-40%
60
70-30% 40
80-20%
20 0 131415161718192021222324252627282930313233 Number of Features
Figure 2. F_PFS Method Applied to Data Set-2
10
Copyright ⓒ 2017 SERSC
International Journal of Advanced Science and Technology Vol.100 (2017)
Table 5. IFSFS Applied on Data Set-1 Model No. #
Total Number of selected features
1
16
2
17
3
18
4
19
5
20
6
21
7
22
8
23
9
24
10
25
11
26
12
27
13
28
14
29
15
30
16
31
17
32
18
33
19
34
20
35
21
36
22
37
23
38
Copyright ⓒ 2017 SERSC
Selected features
32,17,21,16,14,25,47,38,2 4,27,1,26,15,20,13,28 Features of Model No. 1+ Feature No. 23 Features of Model No. 2 + Feature No.5 Features of Model No. 3 + Feature No.30 Features of Model No. 4 + Feature No.33 Features of Model No. 5 + Feature No.45 Features of Model No. 6 + Feature No.3 Features of Model No. 7 + Feature No.22 Features of Model No. 8 + Feature No. 31 Features of Model No. 9 + Feature No.4 Features of Model No. 10 + Feature No.29 Features of Model No. 11 + Feature No.35 Features of Model No. 12 + Feature No.2 Features of Model No. 13 + Feature No.41 Features of Model No. 14 + Feature No.18 Features of Model No. 15 + Feature No.44 Features of Model No. 16 + Feature No. 8 Features of Model No. 17 + Feature No.12 Features of Model No. 18 + Feature No.40 Features of Model No. 19 + Feature No.10 Features of Model No. 20 + Feature No.37 Features of Model No. 21 + Feature No.42 Features of Model No. 22 + Feature No.11
SVM Classification Accuracy in(%) for Different TrainingTesting Partitions 60-40%
70-30%
80-20%
80.32
83.69
80.32
83.69
82.98
82.45
81.56
86.17
86.70
83.69
80.85
83.51
83.69
82.98
82.98
83.69
80.85
84.57
82.98
80.85
83.51
81.56
80.85
86.17
82.98
84.04
84.04
83.69
84.04
85.11
87.23
85.11
85.11
86.53
84.04
84.57
86.53
84.04
85.11
85.11
82.98
84.04
86.53
85.11
85.11
84.40
85.11
85.64
86.53
84.04
85.64
87.23
84.04
86.17
85.82
84.04
86.17
86.53
82.98
85.64
86.53
82.98
85.11
86.53
85.11
85.11
89.36
85.11
85.11
11
International Journal of Advanced Science and Technology Vol.100 (2017)
24
39
25
40
26
41
27
42
28
43
29
44
30
45
31
46
32
47
Features of Model No. + Feature No.43 Features of Model No. 24 + Feature No.9 Features of Model No. 25 + Feature No.39 Features of Model No. 26 + Feature No. 6 Features of Model No. + Feature No.19 Features of Model No. + Feature No.34 Features of Model No. 29 + Feature No.47 Features of Model No. + Feature No.36 Features of Model No. + Feature No.7
23
27 28
30 31
86.17
88.65
85.11
86.17
87.94
87.23
85.64
88.65
87.23
87.23
87.23
87.23
87.23
87.23
87.23
84.57
87.23
86.17
83.51
87.23
86.17
86.17
87.23
86.17
85.11
87.23
86.17
92 90 88 Accuracy
86 84
60-40%
82
70-30%
80
80-20%
78 76 74 16 18 20 22 24 26 28 30 32 34 36 38 40 42 44 45 47 Number of Features
Figure 3. FSFS Method Applied to Data Set-1
5. Conclusion In this paper a novel hybrid feature selection method is given, which takes advantage of filter and wrapper methods and overcome the weakness of wrapper technique. The algorithm uses a novel weighted probability approach to give rank to each feature. Then the partial forward selection algorithm with SVM as classifieris applied, which reduce computational effort of wrapper method. The new approach is tested on two different skin data sets. The detailed study and analysis of the new approach is done and results are displayed. The results show that new approach of feature selection (F_PFS ) reduced 26% features from data set-1 and reduced 39% features from data set-2 with good classification accuracy and hence reduces computational efforts.
12
Copyright ⓒ 2017 SERSC
International Journal of Advanced Science and Technology Vol.100 (2017)
Acknowledgment Authors are thankful to Shrikrishna Hospital for giving us permission for data collection. Authors are also thankful to the department of Skin & VD for their help in collecting data. Lastly, we are thankful to UCI Machine Learning Repository for keeping their data source open for research purposes.
References [1]
[2] [3] [4] [5]
[6] [7] [8] [9]
[10] [11] [12] [13] [14] [15] [16] [17] [18] [19] [20] [21]
[22]
B. Duval, J. K. Hao and J. C. Hernandez Hernandez, "A memetic algorithm for gene selection and molecular classification of cancer", Proceedings of the 11th Annual conference on Genetic and evolutionary computation, ACM, (2009); Montréal, Canada. B. E. Boser , I. M. Guyon and V. N. Vapnik, "A training algorithm for optimal margin classifiers.", In Proceedings of the fifth annual workshop on Computational learning theory, ACM,(1992). B. Schölkopf and A. J. Smola, “Learning with kernels: support vector machines, regularization, optimization, and beyond”, MIT press, (2001). C. C. Chang and C. J. Lin. "LIBSVM: a library for support vector machines", ACM Transactions on Intelligent Systems and Technology (TIST),vol. 2, no. 3,(2011), p. 27. C. Lazar, J. Taminau, S. Meganck, D. Steenhoff, A. Coletta, C. Molter, V. de Schaetzen, R. Duque, H. Bersini and A. Nowe, "A survey on filter techniques for feature selection in gene expression microarray analysis", IEEE/ACM Transactions on Computational Biology and Bioinformatics (TCBB,) vol. 9, no. 4, (2012),pp. 1106-1119. G. Chandrashekar and F. Sahin, "A survey on feature selection methods",Computers & Electrical Engineering, vol. 40, no. 1, (2014), pp. 16-28. G. Forman, "An extensive empirical study of feature selection metrics for text classification", Journal of machine learning research, vol. 3, no. Mar, (2003), pp. 1289-1305. I. Guyon and A. Elisseeff, "An introduction to variable and feature selection", Journal of machine learning research, vol. 3, no. Mar, (2003), pp.1157-1182. J. Xie and C. Wang, "Using support vector machines with a novel hybrid feature selection method for diagnosis of erythemato-squamous diseases", Expert Systems with Applications, vol. 38, no. 5, (2011), pp. 5809-5815. K. Bache and M. Lichman, "UCI Machine Learning Repository [http://archive. ics. uci. edu/ml]. University of California, School of Information and Computer Science", Irvine, CA, (2013). K. Parikh and T. Shah, “Diagnosing Common Skin Diseases using Soft Computing Techniques”, International Journal of Bio-Science and Bio-Technology, vol. 7, no. 6, (2015), pp. 275-286. K. Parikh and T. Shah,” Support Vector Machine - a Large Margin Classifier to Diagnose Skill Illnesses”, Procedia Technology Elsevier Publisher, (2016). K. Q. Shen, C. J. Ong, X. P. Li and E. P. Wilder-Smith, "Feature selection via sensitivity analysis of SVM probabilistic outputs", Machine Learning, vol. 70, no. 1, (2008), pp. 1-20. L. Yu and H. Liu, "Feature selection for high-dimensional data: A fast correlation-based filter solution", Twentieth International Conference on Machine Learning (ICML), (2003); Washington D.C. U.S.A.. R. Battiti, "Using mutual information for selecting features in supervised neural net learning", IEEE Transactions on neural networks, vol. 5, no. 4, (1994), pp. 537-550. R. Kohavi and G. H. John, "Wrappers for feature subset selection", Artificial intelligence, vol. 97, no. 1, (1997), pp. 273-324. S. Maldonado and W. Richard, "A wrapper method for feature selection using support vector machines", Information Sciences, vol. 179, no. 13, (2009), pp. 2208-2217. V. N. Vapnik, "An overview of statistical learning theory", IEEE transactions on neural networks, vol. 10, no. 5,(1999), pp. 988-999. Y. Kuang, “A Comparative Study on Feature Selection Methods and Their Applications in Causal Inference”, Institutionenfördatavetenskap, Lundsuniversitet, (2009). Y. Liu and Y. F. Zheng, "FS_SFS: A novel feature selection method for support vector machines", Pattern recognition, vol. 39, no. 7, (2006), pp. 1333-1345. Y. Yang and J. O. Pedersen, "A comparative study on feature selection in text categorization”, Proceeding of the Fourteenth International Conference on Machine Learning (ICML), (1997); Nashville, Tennessee, USA. Z. Xu, I. King, M. R. T. Lyu and R. Jin. "Discriminative semi-supervised feature selection via manifold regularization" , IEEE Transactions on Neural Networks, vol. 21, no. 7, (2010), pp. 1033-1047.
Copyright ⓒ 2017 SERSC
13
International Journal of Advanced Science and Technology Vol.100 (2017)
Authors Krupal S. Parikh, received her Master of Science in Applied Mathematics from M. S. University of Baroda, Gujarat, India. Currently she is working as an Assistant Professor in the department of Applied Science and Humanities, G. H. Patel college of Engineering & Technology, Gujarat, India and also pursuing Ph.D. in Applied Mathematics from M. S. University of Baroda. Her current research of interest includes soft computing techniques and its applications in medical informatics. Email:
[email protected] Trupti P. Shah received Ph.D.(Applied Mathematics) from M. S. University of Baroda, Vadodara and P.G. Diploma in Computer Science and Application (P.G.D.C.A.) from the Sardar Patel University, Vallabh Vidyanagar. She is working at Department of Applied Mathematics, M.S. University of Baroda since 1994. Her research work includes controllability and stability problems of discrete dynamical systems using functional analytic techniques. Her interest includes soft computing techniques and its applications in medical informatics and control. Email:
[email protected]
14
Copyright ⓒ 2017 SERSC