Journal of Robotics and Mechatronics Vol.17 No.2,2005 pp.164-172
PRE
Field Monitoring Using Sensor-Nodes with a Web Server Tokihiro FUKATSU, and Masayuki HIRAFUJI National Agricultural Research Center 3-1-1 Kannondai, Tsukuba, Ibaraki 305-8666, Japan E-mail:
[email protected]
In order to realize field and environment monitoring over long periods of time, we propose a new method of remote monitoring system that can flexibly and dynamically respond to changes. Field Servers are one of the small monitoring sensor-nodes that are equipped with a Web server to be accessed via the Internet and use wireless LAN to provide a high-speed transmission network differing from traditional sensor-nodes. The monitoring system with Field Servers allows for easy installation, monitoring field information, and remote operation in any field. By mounting the function of a Web server for all modules, we can treat them collectively via the Internet. In order to evaluate the monitoring system, we have managed numerous Field Servers installed in various countries using an agent program. The result of field experiments shows that the system is both safe and effective for remote monitoring applications.
Keywords: sensor-node, remote monitoring, Internet, Web server, wireless LAN
1.
Introduction
In agricultural and environmental sciences, it is important to monitor crop growth and field environmental information in various places under harsh conditions over long periods of time. However, field monitoring is difficult to perform because installation sites mostly lack infrastructure for providing power or networking capabilities and precision instruments must endure exposure to heat, moisture, rain, and dust. It becomes necessary to install numerous measurement devices and to change their positions and configuration according to the situation because such monitoring fields are generally wide and undergo changes, unlike closed environments. In ordinary monitoring, field information has so far been acquired by collecting data periodically through the installation of a data logger; such monitoring systems produce inaccurate data and require a great deal of effort for field use. Recently, sensor network research has enabled large-scale environmental monitoring using many small sensors with radio data links. Mote [1], developed in the “Smart Dust” project, and Sensor Web [2], developed in the NASA for Mars mission have been proposed as a typical research of sensor network. It is possible to improve measurement
accuracy, acquire more useful information, and arrive at a greater understanding of each exact situation by combining data from various sensors. Research on sensor networks to date has focused primarily on the networks themselves, examining issues such as routing and data transmission [3-4], or on the sensor unit, exploring position sensing, synchronization and optimal arrangement [5-6]. There has been little research on system construction for field monitoring or long-term management. In other research, a new approach for measuring sensor data using Ethernet LAN technologies has been proposed for sensor networks. Monitoring with Ethernet LAN gives high noise tolerance for data transmission and simplifies the wiring of sensor cables [7]; because of these advantages, some research has been adapted in structural health monitoring [8-9]. Other reports have proposed monitoring and operating with a Web interface [10] and wireless monitoring via the Internet [11-12]. However, these systems can only consider situations in which many identical specific units are only arranged: for instance, monitoring the load distribution of the bridge in a closed system. Such a system is not well-equipped to deal with general-purpose usage, or handling units with differing functions, and changing the operation mode according to the situation. In the case of agriculture, measurement data is available for growth simulation of crops [13] for predicting the occurrence of disease and pest infestations [14]. What is desired is a flexible, adaptable monitoring system that can utilize various type of information, change the measurement program as necessary for each growth stage, and control and operate peripheral equipment in a remote site. In addition, the need for a system that can treat large blocks of data such as images that help determine crop or livestock conditions, has emerged [15]. various units/data severe condition
undergo changes open environments
sensor network
long-term field monitoring broadband long-distance
simple node remote manage Web server
save power sensor network
wireless LAN
A.I. node
Field Server
Fig. 1. Concept of the long-term field monitoring system.
AC 100-240 V DC 12V battery Solar Cells
Wireless LAN
DC-DC Converter
Main Computer
Web Server
Web Server
Network Camera
D/A Web Server
Relay
⋮
In order to meet such needs, we propose a long-term remote field monitoring system consisting of a sensor network equipped with a Web server for measurement and wireless LAN for data transmission (Fig.1). Traditional sensor networks use exclusive radio communication and must minimize the amount of data and communication time to save power. The wireless LAN of our proposed system does slightly increase power consumption, but it also provides a high-speed transmission network and long-distance communication for large image files at a low price. For sensor-nodes to process measured data and cope with various situations on their own, they would have to be constructed with artificial intelligence and would require a high-performance CPU, substantial memory, and a large program file, all of which are costly and increase the risk of generating “bugs”. In our much simpler remote system, the sensor-node is mounted on a Web server built by simple firmware and on a low-end CPU. Moreover, it becomes possible to respond to perform various monitoring and managing complicated operations, either by remote computer or a user through a wireless LAN network. In the present research, we developed a general-purpose sensor-node for fields called “Field Server (Fig.2)”, which is equipped with a Web server and wireless LAN in order to realize long-term remote field monitoring. By installing numerous Field Servers in a field, we constructed a long-term remote monitoring system that can easily treat various data from any place at any time.
Ethernet
Peripheral equipment
A/D DDS
FPAA
Sensors
Fig. 3. System construction of the Field Server.
example, Field Server can be available for introducing the latest and high performance module of IT. The standard size of Field Server is about 20*20cm2, and its standard weight is about 1kg. It is designed with easy installation and removal in mind. The power supply for Field Servers can be selected by various methods, such as a commercial power supply (AC100-240V), DC12V battery, and private electric generators (solar cells, etc.) according to installation conditions and purposes. Inside a Field Server, the power supply is DC12V and the proper voltage of each module is exchanged by a DC-DC converter. The standard power consumption is about 6W and differs by the kind and setting of wireless LAN, network camera, and peripheral equipment (Table 1). In sites without an external power supply, a standard Field Server requires a 1*2m2 or larger solar cell in order to drive continuously; other energy-saving Field Servers that work intermittently can be managed with a small solar cell (about 15*15cm2) embedded on their rooftop [16]. Table 1. Power consumption of the parts of Field Server. Module
Model (Corp.)
Field Server
Main Computer LED Light Electric FAN WLA-G54 (BUFFALO) GW-EN11H (PLANEX) WRT54G (LINKSYS) CG-NCMN (Corega) KX-HCM170 (Panasonic) RDC-i700 (RICOH) Halogen lamp Buzzer RS232C converter FA-21 (CENTURY SYSTEMS)
Wireless LAN
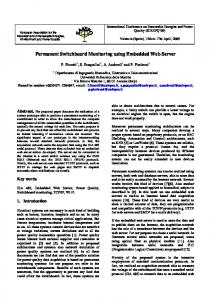
Fig. 2. A standard Field Server.
Network Camera
Option
2.
Field Server
The Field Server, a small monitoring sensor-node, was developed so that it could easily be installed outside, equipped with a wireless LAN with broadband, and managed various sensors and peripheral equipments, equipped with a Web server housed in a main small computer. Figure 3 shows the system construction of the Field Server. In the Field Server, every module is equipped with a Web server and connected to other modules with Ethernet, making it is easy to exchange or add modules. For
Power consumption 0.6 W 1.2 W 1.2 W 3.0 W 1.3 W 5.3 W 2.3 W 6.0 W 9.0 W 10.0 W 6.0 W 1.1 W
Using Field Servers for field monitoring allows for much easier installation than with ordinary large systems. Easy installation and removal of equipment used for field monitoring is especially important for agricultural work which varies according to the different stages of crop growth. Field Servers reduce the effort of the field user in long-term outdoor monitoring by using the following key technologies.
2.1.
Web server
A Web server is software that can present Web information to a client based on TCP/IP. By building a Web server into measurement equipment, we can easily access and manage the equipment using a Web browser such as Internet Explorer, without installing exclusive software. The equipment with a Web server is simple firmware mounted on the inside, yet it can respond to various types of monitoring and operating stably. In this way, it is possible to treat various types of equipment with the Web server in the same manner. And, we can construct a high scalability system which is not affected by the number of measuring devices. Besides the Field Server, many kinds of equipment compatible with the Web are beginning to spread, such as network cameras, digital cameras and Ethernet converters which make it possible to use many outdated devices with the RS232C port. Constructing a system in such a way that every unit can be treated on the Web reduces legacy problems in which old measurement equipment cannot be adapted to a new system. This is an important point because long-term field monitoring requires a great deal of measurement equipment. Table 2 shows the specifications for the Field Server’s main monitoring computer with a Web server. The Field Server has a computer such as “PICNIC (TriState Company)”, which is a commercial product, or “Field Server Engine (Fig.4)”, which was developed by our previous Table 2. Specifications of Field Server’s main computer.
research [17]. It has some functions in which several sensors’ output voltage is exchanged by an A/D converter and displayed on the Web, and in which peripheral equipment connected to the digital output by relay circuit can be operated with the CGI function of HTTP. In the Field Server Engine, various functions such as high-speed sampling A/D, DDS (Direct Digital Synthesizer), FPAA (Field Programmable Analog Array), and analog multipliers can be operated on the Web. DDS can generate an alternative signal up to 70MHz. FPAA serves to construct dynamically analog circuits such as low-pass filters using its embedded 20 CABs (Configurable Analog Block) and analog multipliers. By combining these functions we can monitor various kinds of sensors. Sensors connected to the Field Server monitor air temperature, relative humidity, and intensity of solar radiation by standard equipment, UV and CO2 concentration by DC output, soil moisture and pH by impedance measurement, and leaf wetness by original sensors (Table 3). Table 3. Sensors connected to a Field Server Model (Corp.) Temperature Humidity Solar radiation CO2 UV
PICNIC PIC16F877 4ch (10bit, 0∼5V) In 4ch / Out 4ch RS232C×1, RJ45×1
CPU A/D ch(bit) D/A ch Port Option Cost
US$70
FS-Engine H8/3069 16ch (24bit, 0∼5V) Out 2ch with relay RS232C×1, RJ45×1 DDS (∼70MHz) FPAA (20CABs) US$200 (estimate)
Soil moisture pH
2.2.
Spec.
Cost
Output
LM35 (National) CHS-UPS (TDK) Embedded
-55 – 150C±0.2C, US$2 Direct current +10.0mV/C US$70 Direct current 5 - 95%±3%, +10.0mV/% --- Direct current 0 – 100 klx ±5%, +30mV/klx GMW22 US$800 Direct current 0 – 5000ppm± (Vaisala) 30ppm, +2mV/ppm G5842 260-400 (370) nm, US$10 DC with (Hamamatsu) 60mA/W circuit --Capacitance Handmade 0 – 70%±2% with calibration --Impedance Handmade 0 – 14.0pH±0.1pH with calibration
Wireless LAN
A wireless LAN (Wi-Fi, IEEE802.11b/g) provides a high-speed transmission network at a low price. Using it for the Field Server spares the cost of laying cable and reduces communication charges. There are various features of mode
http://192.168.0.185
operate relay switch
Bridge/Repeater Mode
Access Point Mode
75mm sensors' output voltage
(a)
(b)
Fig. 4. (a) Field Server Engine and (b) displayed Web page in which we can monitor sensors’ output voltage and operate peripheral equipment with On/Off button.
Fig. 5. Mode in wireless LAN.
Client Mode
(access point, bridge/repeater, and client) in wireless LAN, and the standard Field Server is equipped with an access point and bridge/repeater mode simultaneously (Fig.5).
Hotspot
・ Access point mode In this mode, wireless LAN provides hotspots where it can be connected to the Internet by client connections such as laptop PC. Using this mode for the Field Server, we can only access this type of Field Server within own hotspot. Furthermore, we can’t use it in cooperation with two or more access points. It is impossible to monitor over a long distance. ・ Bridge/Repeater mode In this mode, identical wireless LANs can connect with each other and make a network in total like an Ad-Hoc network. On this network, we can access any equipment connected to this wireless LAN from any place at any time. By constructing this mode as the backbone network for Field Servers, the monitoring area can be extended to a long distance easily with relay from several Field Servers. However, transmission speed decreases according to the relay count with a limit of about 6 times (Fig.6). When installing numerous Field Servers in a narrow area, we have to consider the network topology so that the whole relay count does not increase.
wireless LAN : GW-AP110 : 100m interval
4
20 times average except max. and min.
3
Interconnection between Bridge/Repeater mode
Standard Field Servers
Fig. 7. Installing many Field Servers in a narrow area with client mode.
The communication distance of wireless LAN, which changes according to models, configurations, environmental conditions, antenna type, etc., can generally reach the ranges where viewing would take place. Figure 8 shows experimental results for the relation between communication distance and the transmission speed of Field Servers. In this experiment, Field Servers were equipped with wireless LAN, which is WLA-G54 (BUFFALO Inc.) for 802.11g and GW-AP110 (Planex Communications Inc.) for 802.11b. The transmission speed of the wireless LAN for 802.11g is faster than that for 802.11b at a short distance, but it rapidly decreases speed as distance increases, becoming the same as 802.11b at about 300m. Although 802.11b becomes slow according to distance, it can maintain the transmission speed
2 (a) 16
1 0 1
2
3.8M
Relay count
3
4
3.8M less
3.8M
1.0M
3.8M less
2.6M 1.8M
Transmission speed (Mbps)
Transmission speed (Mbps)
5
Client connection Field Servers
Cable
12
8
25m
6 4 2 0 0
2.6M 1.0M
20 times average except max. and min.
10
2.6M
2.6M
(b)
802.11g (WLA-G54) 802.11b (GW-AP110)
14
100
200 300 400 500 Communication distance (m)
600
700
Field Server
2.6M
Fig. 6. Change of the transmission speed according to the relay count. By considering the network topology, the transmission speed of terminal Field Servers will be increased.
Fig. 8. (a) Relation between transmission speed communication distance and (b) experimental aspect.
・ Client mode By interfacing to the wireless LAN in this mode, which is also called an Ethernet converter, the equipment that does not have a wireless LAN function can connect to the network in hotspots. A standard Field Server is connected to the backbone by bridge/repeater mode and simultaneously provides hotspots by access point mode. Therefore, by utilizing the Field Servers with this client mode, we can install many Field Servers in a narrow area without considering the relay count limit or decreasing the transmission speed (Fig.7).
Transmission speed (Mbps)
5
and
0.4M
4
(a)
3
(b)
2
2.6M 1 obstacle 0 0
100
(a)
without obstacle with obstacle
200 300 400 500 Communication distance (m)
(b) 600
1.7M (b')
700
Fig. 9. Effect of the obstacles on the transmission speed. (a) It becomes too slowly when connecting through obstacles directly. (b’) But by relaying with more Field Server, it is kept enough.
0deg
Mbps 16
0deg 45deg
Antenna
12
+ 25m
10 270deg
Antenna
90deg
8
225deg
+
135deg
35
180deg
Fig. 10. Direction dependency of the transmission speed.
Metrological equipment Air -Temp.(C)
14
315deg
relative humidity. By adopting a measurement method that uses ventilation both for the sake of maintaining measuring accuracy and cooling of electronic equipment, the Field Server resolves the problems of environmental exposure without excessive power consumption. Figure 11 shows the advantageous effect of accuracy and cooling. Without an electric fan, the daytime CPU temperature increases rapidly; with a fan, the CPU temperature can be maintained within the guarantee range at which measurement equipment can function normally. At the same time, the air temperature measurement has greater accuracy because the influence of solar radiation is excluded. In order to examine the measurement accuracy of the Field Server, we compared the results of commercial metrological equipment (MS352-10, Yokogawa Weathac Co.) and Field Servers. In this experiment, (a) one Field Server was equipped with a 10 bit A/D converter and 0.5C resolution, (b) another with a 10 bit A/D converter with 5 times Op amplifier and 0.1C resolution. The results of correlation coefficients of both Field Servers with commercial equipment were more than 0.99, and the standard deviations were (a) 0.31 and (b) 0.22 (Fig.12). These figures indicate sufficient accuracy for both (a) and 30
(a) : 10bit A/D
25
30
y = 0.999 x - 0.068 R2 = 0.996
frequency rate (%)
of 2.8Mbps (about 70% of the transmission speed in a short distance) even at 650m. This result suggests sufficient performance for practical use such as monitoring high-resolution images (ex. 3M pixels jpeg, 1Mbytes) at field block intervals (ex. 100m/block in paddy field). However, this distance becomes shorter when obstacles such as windbreaks are present because of the absorption and reflection of the electric waves (Fig.9). In connecting to the network where there are obstacles, the communication performance of Field Servers is maintained by bypassing from another point or installing a Field Server in the obstacles, depending on the situation. Figure 10 shows the direction dependency of the transmission speed in the Field Servers, and reveals that a sideways direction to the antenna decreases the communication speed.
25 20 2004/6/14 - 6/16 sampling time : 1min. Condition : fine & cloudy
15
20 15 10 σ = 0.31 5
10
0 10
In order to install in the severe field over a long period of time, Field Servers require contrivances to maintain stable measuring accuracy and a casing that can endure heat, moisture, rain, and dust. Especially, it is important how electronic measuring equipment that generates heat is cooled without excessive power consumption in places of severe environmental conditions. In terms of measuring accuracy, the “Assman aspirating psychrometer measure”, which measures with ventilation in a sensor, was employed in order to maintain measuring accuracy about air temperature and
CPU Temp. (C)
65
outside guarantee range
condition: fine 2004/10/1
55 45
with FAN without FAN
15
20 25 Field Server Air-Temp. (C)
35
-2
-1
0 variations (C)
1
2
30 25
30
y = 1.003 x - 0.089 R2 = 0.999
25 20 2004/6/14 - 6/16 sampling time : 1min. Condition : fine & cloudy
15
20 15 10 σ = 0.22 5
10 10
15
20 25 Field Server Air-Temp. (C)
30
35
-2
-1
0 0 variations (C)
1
2
Fig. 12. Measurement accuracy of the Field Server.
Rain-proof
Outflow
Wireless LAN cooling Main Computer
35 25 15
sunrise
36 Air Temp. (C)
30
(b) : 10bit A/D + Op amp. frequency rate (%)
Hardware
Metrological equipment Air -Temp.(C)
2.3.
35
32 28
Filter
shade
Air Temperature with FAN without FAN
Electric FAN
24
Sensor
20 16 0:00
Inflow
3:00
6:00
9:00 Time (JST)
12:00
15:00
18:00
Fig. 11. Effect of the FAN on the measurement accuracy and CPU temperature.
Thermal insulation
Fig. 13. Casing of the Field Server for heat-resistance, rain-proof, and dust-proof.
12
0.8
11.5
0.6
11
0.4
10.5
0.2 Voltage Current
10 0
5
Output Current(A)
Output Voltage(V)
(b) to monitor environmental data in an agricultural field, and it can be further improved by raising the resolution. Besides heat-resistance, the casing of the Field Server was improved to be rain-proof by shielding air outlets with a series of overhangs and to be dust-proof by installing a filter in the inflow (Fig.13). In addition, the Field Server was equipped with PoE (Power over Ethernet), which transmits electric power and information signals by one Ethernet cable. By using PoE, the difficulty of cable installation, such as a power supply line and signal lines to peripheral equipment, can be mitigated. The PoE of a Field Server has a 12V supply unlike the PoE of IEEE802.3af standard and the lowest input voltage of DC-DC converter is 10V, so the maximum length of an Ethernet cable is about 20m from the vantage point of voltage drop and safety standards (Fig.14).
Data
Data Rx+ Data RxData Tx+ Data Tx-
0
10 15 Cable length (m)
20
12V GND
spare cable
Fig. 14. Power over Ethernet of a Field Server.
3.
System architecture
We can access a Field Server easily by connecting to a computer, either fixed-line or wireless. By installing several Field Servers at various monitoring points and relay points, all Field Servers are connected to the network and each other at all times. By connecting with this network, we can easily monitor and manage all Field Servers in the network. Moreover, by connecting this network to the Internet, we have constructed a long-term Internet-based monitoring system. When performing long-term monitoring using the Field Servers, it is also possible to manage Field Servers by periodic local access using a local network not connected to the Internet. But such a system gives the field user the burden of installing a computer, storing large quantities of data, and managing a program for each local network all day. In this research, we have constructed a system which lightens the load of the field user by managing various spots collectively from a remote place via the Internet.
Table 4. Parts list of Field Server monitoring system
Address VPN Router Start Point Field Server (per 1 unit)
Option
Model ADSL(global IP) YAMAHA RT56v BUFFALO WLA-G54
Costs US$ 30/month∼ US$ 300∼ US$ 100∼ US$ 70∼ US$ 100∼ US$ 100∼ US$ 100∼ US$ 50∼ US$ 20∼ US$ 100∼ US$ 50∼ US$ 400∼ :
Main Computer Wireless LAN Sensors(standard type) Case Electronic circuits Power supply Network Camera LED Light ECHO sensor :
Figure 15 shows the construction of this Field Server monitoring system, and Table 4 shows the parts list of this system required in a site. In this monitoring site, we install several Field Servers for monitoring and relaying, the wireless LAN as the start point, and the broadband router for safely connecting to the Internet from the local network. The start point wireless LAN and the broadband router are mainly installed in a building where a broadband line such as xDSL or CATV is provided. To ensure security, access from a remote place is mainly performed by a VPN (Virtual Private Network) function or by the port forwarding function of the router [18]. In the case of a severe network conditions such as severe security requirements or a narrowband connection, alternative methods such as using a HTTP post, FTP, and Mail function are also being examined [19]. Using the Internet, it is easy to periodically collect monitoring data from a remote place since all measuring equipment included in the Field Server system has a built-in Web server. In our previous work, we developed a general-purpose program (Field Server Agent) which not only collects data automatically, but also controls equipment flexibly and outputs useful information via the Internet [20]. Using this agent program, many kinds of Field Servers in several sites can be managed automatically on a remote computer via the Internet. Moreover, the field user can Top Page
09
Image data
Real-time data
click
site
VPN Agent
Stored data
Field Server
Wireless LAN
zoom in
Router Internet
Web server
local IP
Field Server
Fig. 15. Standard construction of Field Server system.
Fig. 16. Web top page of monitoring results with clickable map which is linked with real-time data, stored data, and image data page created by agent program.
acquire the monitoring data easily, not only by accessing Field Servers directly from the inside of a local network, but also by accessing the Web pages created by the agent program. Figure 16 shows an example of the Web page. The top page has a clickable map linked with the data of Field Servers. The results of sensors’ data are provided by real-time data and stored data in graph form. As regards image data, this Web page is displayed with thumbnailed animation which is linked to original high-resolution image.
4.
collected. Despite the fact that some sites experienced severe environment conditions such as extreme seasonal changes and typhoon, and underwent the addition or removal of Field Servers, it has been possible to collect data stably over a long period of time (Fig.18). (c)
(a)
Field Experiments
In order to evaluate this long-term remote field monitoring system, we installed numerous Field Servers in various countries and managed them with the agent program. Approximately 40 Field Servers (as of October, 2004) are currently installed in various parts of Japan, the United States, Thailand, China, Korea, and Taiwan (Fig.17). The participants in these experiments include farmers, companies, universities and research institutes. This system has performed reliably for more than two and a half years since February, 2002. The agent program has been executed on the PC cluster in our laboratory (Ibaraki, Japan) and has accessed these Field Servers at intervals of 1-10 minutes depending on the network speed or the amount of data
(d)
(b)
Fig. 19. Effective usage of Field Servers. (a):monitoring, (b):controlling, (c):surveillance, (d): publicity.
This system uses Field Servers not only for the purposes of monitoring various types of weather data but also for managing greenhouses, field surveillance, and publicity (Fig.19). The collected data in our laboratory has been opened to the public on trial Web pages [21], and has been connected to “MetBroker [22]”, a middleware for weather data that provides agricultural models with consistent access to many different weather databases. MetBroker-compatible models and applications for agriculture involving on-site field information from the Field Servers’ databases could prove to be very useful. Furthermore, it is easy to access real time data by cellular phones that can use the Internet through functions such as i-mode (Fig.20). The field user clearly reaps the benefits of this Field Server system. user
∼ 2004.10
weather data A
Fig. 17. Sites of Field Servers. weather data B
:
Air-Temp. (C)
40 30 20
Field Server
10 Field Server is removed
0 -10 -20 03-Jan
Field Server is restarted
‥ Hawaii
03-Mar
03-May
03-Jul
03-Sep
03-Nov
04-Jan
04-Mar
04-May
04-Jul
04-Sep
application
40 Air-Temp. (C)
MetBroker
30 20
Fig. 20. Access to Field Servers’ database by MetBroker & cellular phones.
10 0 -10 -20 03-Jan
Ibaraki 03-Mar
03-May
03-Jul
03-Sep
03-Nov
04-Jan
04-Mar
04-May
04-Jul
04-Sep
Air-Temp. (C)
40 30 20
Field Server is installed
5.
10
Conclusion and Discussion
0 -10 -20 03-Jan
Hokkaido 03-Mar
03-May
03-Jul
03-Sep
03-Nov
04-Jan
04-Mar
04-May
04-Jul
04-Sep
Fig. 18. Monitoring results of long-term field experiments.
In order to realize long-term monitoring in a field, we introduced the sensor-node “Field Server” equipped with a Web server and a wireless LAN and proposed a remote field
monitoring system by which many Field Servers can be managed via the Internet. Using this system, a field user with only basic networking knowledge can easily install and monitor Field Servers in severe places and can control and operate the peripheral equipment flexibly via the Internet. In the agricultural research, it generally seems that the robotics and mechatronics system is not so important, but it can be greatly effective only by changing the object as shown in this sensor-network system. By adapting the engineering system to the condition of severe environment, open system, and long-term operation, it becomes easily possible to adjust to the agricultural field. Furthermore, it will achieve “field informatics” that constructs the lab-based measurement in the actual field. In agriculture, although some monitoring equipment and automatic management equipment are used, it is difficult to perform a fine judgment by automatic sensor, and there is understandable anxiety about sensor error because of the possible consequences to living things [15]. In our proposed system, the sensor-nodes are constructed, not with the artificial intelligence to judge for themselves, but with a Web server so that they may be controlled via the Internet. Hence, we can choose between management by automatic control with a remote computer or by manual operating using the field user’s judgment. This system can also construct a man-machine system in which the field user himself can check and operate the peripheral equipment with a sense of security in the case of an important subject. Field Servers are networked at all times with each other and provide hotspots. Since the network is connected to the Internet, this system can be utilized not only as a wireless sensor network but also an infrastructure for ubiquitous networking. This ubiquitous networking solves the last mile problem and provides the possibility of adaptations for green tourism in rural areas (Fig.21) [23]. Using this network, the field user can also get advice, for instance, on methods of cultivation and pest control via the Internet. By utilizing the features of concurrent access possessed by a Web server, we have distributed data storage for backup data or improvement of reliability by accessing Field Servers from various places. If anyone can access the monitoring data, which records the history of “who, what, when performed” in real time, this data can be used as traceability data that the Field or Forest FTTH, ADSL, i-Space
Greenhouse house
Field Server
Hot Spot
Mountain
Amenity farm Farmer’s market
Farm inn
Wireless relay communication
Fishing spot
Camping site Farmer’s restaurant
Fig. 21. Ubiquitous networking in rural area by Field Servers
general public can check as a juror. Various kinds of equipment with a built-in Web server including Field Servers will tend to increase in the future, and it is very important to manage this equipment appropriately. The proposed system is effective as one of the new methods of managing measurement equipment with a Web server, and for utilizing a remote field monitoring system over long periods of time.
References: [1] J. M. Kahn, R. H. Katz, and K. S. J. Pister, "Next Century Challenges: Mobile Networking for “Smart Dust”," ACM/IEEE Intl. Conf. on Mobile Computing and Networking (MobiCom 99), pp.271-278, 1999. [2] Kevin A. Delin, and Shannon P. Jackson, "Sensor Web for In Situ Exploration of Gaseous Biosignatures," In Proc. IEEE Aerospace Conference, vol.7, pp.465-472, 2000. [3] SD. Servetto, and G. Barrenechea, "Constrained Random Walks on Random Graphs: Routing Algorithms for Large Scale Wireless Sensor Networks," WSNA, pp.12-21, 2002. [4] F. Ye, H. Luo, J. Cheng, S. Lu, and L. Zhang, "A Two-Tier Data Dissemination Model for Large-scale Wireless Sensor Networks," MOBICOM’02, pp.148-159, 2002. [5] A. Savvides, CC. Han, and MB. Strivastava, "Dynamic fine-grained Localization in Ad-hoc Networks of Sensors," MOBICOM’01, pp.166-179, 2001. [6] J. Elson, and K. Romer, "Wireless Sensor Networks: A New Regime for Time Synchronization," HotNets-I, 2002. [7] D. L. Tate, and F. W. Williams, "Ethernet Options for the Ex-USS Shadwell," NRL Letter Report 6180/393A.1, 1993. [8] A. Todoroki, Y. Takeuchi, Y. Shimamura, A. Iwasaki, and T. Sugiya, "Fracture Monitoring System of Sewer Pipe with Composite Fracture Sensors Via the Internet," Structural Health Monitoring, Vol. 3, No. 1, pp.5-17, 2004. [9] A. Iwasaki, T. Sugiya, and A. Todoroki, "Unmanned structural health monitoring via internet with unsupervised statistical diagnosis (application for damage detection of jet fan)," Proc. of the first European Workshop on Structural Health Monitoring, pp.1270-1277, 2002. [10] Kyle Mitchell, Nghia Dang, Pengxiang Liu, Vittal S. Rao, and Hardy J. Pottinger, "Web-Controlled Wireless Network Sensors for Structural Health Monitoring," Smart Structure and Materials 2001 Smart Electronics and MEMS, Proc. of SPIE, Vol.4334, pp.234-243, 2001. [11] Xu, R., Chen, J., and Kwan, C., "A remote diagnosis tool via Internet," Proc. of SPIE, 4389, pp.47-50, 2001. [12] A. Todoroki, Y. Shimamura, and T. Inada, "Plug & monitor system via Ethernet with distributed sensors and ccd cameras," Structural Health Monitoring 2000, pp.571-580, 1999. [13] R. Sameshima, "A new method for predicting flowering stage in soybean," JARQ, 25, pp.149-153, 1991. [14] T. Ohtani, K. Sugahara, K. Tanaka, M. Laurenson, T. Watanabe, and S. Umemoto, "Web based IPM system for Japanese pear diseases in Japan. III. Weather data acquisition system to estimate leaf wetness duration and scab infection severity," The 2001 KSPP International Conference and Annual Meeting. Plant Disease Forecast: Information Technology in Plant Pathology, Program and Abstracts pp.63, 2001. [15] T. Kida, M. Kamo, A. Sawamura, and D. Matsumoto, "Study on the Development of Dairy Facilities and a Cow Herd Monitoring System (in Japanese)," Agricultural Information Research, 12(4), pp.299-306, 2003. [16] M. Hirafuji, T. Fukatsu, and Hu, Haoming, "Full-Wireless
[17]
[18]
[19]
[20]
[21] [22]
[23]
Field Monitoring Server for Advanced Sensor-network," Proc. of AFITA/WCCA2004 Joint Conference, pp.692-697, 2004. M. Hirafuji, and T. Fukatsu, "Architecture of Field Monitoring Servers," Proc. of the 3rd Asian Conference for Information Technology in Agriculture, pp.405-409, 2002. T. Kiura, T. Fukatsu, and M. Hirafuji, "Field Server Gateway: Gateway Box for Field Monitoring Servers," Proc. of the 3rd Asian Conference for Information Technology in Agriculture, pp.410-413, 2002. T. Fukatsu, M. Hirafuji, T. Kiura, A. Imada, and S. Ninomiya, "Long-Term Monitoring System using Field Monitoring Servers," Proc. of AFITA/WCCA2004 Joint Conference, pp.685-691, 2004. T. Fukatsu, and M. Hirafuji, "The Agent System for Field Monitoring Servers to Construct Smart Sensor-Network," Proc. of Fifth International Workshop on Artificial Intelligence in Agriculture, pp.1-5, 2004. http://model.job.affrc.go.jp/FieldServer/index.html M.R.Laurenson, T. Kiura, and S. Ninomiya, "Providing Agricultural Models with Mediated Access to Heterogeneous Weather Databases," Applied Engineering in Agriculture, 18(5), pp.617-625, 2002. M. Hirafuji, "Creating Comfortable, Amazing, Exciting and Diverse Lives with CYFARS (Cyber Farmers) and Agricultural Virtual Corporation," Proc. of the 2nd Asian Conference for Information Technology in Agriculture, pp.424-431, 2000.