FIELD TESTING OF A VARIABLE RATE SPRINKLER AND CONTROL SYSTEM FOR SITE-SPECIFIC WATER AND NUTRIENT APPLICATION B. A. King, R. W. Wall, D. C. Kincaid, D. T. Westermann ABSTRACT. Development and implementation of site-specific sprinkler irrigation management has been limited due to the lack of variable rate sprinklers. Thirty-two prototype variable rate sprinklers were constructed and field tested on a three-span linear-move irrigation system. An algorithm was developed for a distributed control network to allow each sprinkler to be individually controlled in groups of six or seven along the linear-move lateral. Water application uniformity was monitored over a 36% to 100% range in application rate. Measured application uniformity equaled or exceeded 90%. Variable rate nitrogen application was monitored over a 1.1-ha area. Measured nitrogen application rate was within 4% of the target application rate. Results indicate that the prototype variable rate sprinkler and control system allows water and chemical application to vary over a 36% to 100% range in application rate with minimal effect on water application uniformity. Keywords. Center pivot, Uniformity, Chemigation, Site-specific management.
I
nterest in site-specific irrigation management has risen over the past decade due in part to compliment successful commercialization of other site-specific management technologies and the fact that both deficit and excess water availability greatly impact crop yield and quality. Center pivot and linear-move irrigation systems provide a natural platform upon which to develop site-specific irrigation management technologies due to their current and increasing usage, large area of coverage, and relatively high degree of automation. Site-specific irrigation management hardware and control systems have been reported in the literature (Fraisse et al., 1995; King et al., 1996; Sadler et al., 1996; Evans et al., 1996; Harting, 1999; Perry et al., 2003). In each case, spatially variable water application was successfully achieved on a limited scale. However, with each successful implementation, one common impediment was the lack of a variable rate sprinkler to facilitate spatially variable water application. King and Kincaid (2004) reported the development of a variable rate sprinkler applicable to center pivot and
Article was submitted for review in November 2004; approved for publication by the Soil & Water Division of ASAE in April 2005. Presented at the 1997 ASAE Annual Meeting as Paper No. 972216. Mention of trade name, proprietary product or specific equipment does not constitute a guarantee or warranty by the authors or their institutions and does not imply approval of product to the exclusion of others that may be suitable. Approved as Manuscript No. 04B01 of the Idaho Agricultural Experiment Station. The authors are Bradley A. King, ASABE Member Engineer, Associate Professor, Department of Biological and Agricultural Engineering, University of Idaho, Aberdeen, Idaho; Richard W. Wall, Associate Professor, Department of Electrical and Computer Engineering, University of Idaho, Moscow, Idaho; Dennis C. Kincaid, ASABE Member Engineer, Agricultural Engineer, USDA-ARS, Northwest Irrigation and Soils Research Laboratory, Kimberly, Idaho; and Dale T. Westermann, Soil Scientist, USDA-ARS, Northwest Irrigation and Soils Research Laboratory, Kimberly, Idaho. Corresponding author: Bradley A. King, University of Idaho, P.O. Box 870, Aberdeen, ID 83210-0870; phone: 208-397-4181; fax: 208-397-4311; e-mail:
[email protected].
linear-move irrigation systems. Variable sprinkler flow rate is achieved by cycling a retractable concentric pin into the sprinkler nozzle orifice to provide a time-averaged variable flow rate over a range of 36% to 100% in flow for a particular nozzle size. The application pattern radius of the variable rate sprinklers tested was reduced roughly 15% under variable flow conditions. This suggests that application uniformity should be comparable to conventional sprinklers on center pivot and linear-move irrigation systems over an application rate range of 36% to 100%. The objective of this study was to implement a control system algorithm for individual sprinkler control and test the variable flow rate sprinkler on a three-span linear-move irrigation system to evaluate water application uniformity and application of spatially varied target amounts of water and chemical under field conditions.
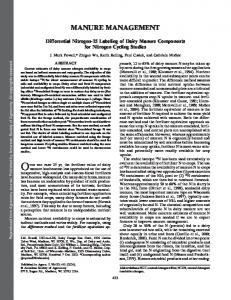
MATERIALS AND METHODS IRRIGATION SYSTEM Thirty-two of the Prototype II variable rate sprinklers (fig. 1) described by King and Kincaid (2004) were constructed. The selected concentric pin size was 4.76 mm (3/16 in.) in combination with a straight-bore brass nozzle size of 5.95 mm (15/64 in.) to theoretically provide a 36% to 100% range in flow from the variable rate sprinkler due to change in orifice area, assuming constant nozzle pressure. Pulse width modulation (PWM) refers to modulation of voltage on- and off-times over a specified time period. A 1-min time period was used in this study. A 10% duty cycle means that the voltage on-time is 10% of the specified time period, 6 s in this case. Thus, by specifying a duty cycle of 0 to 100%, the control system energized the solenoid to insert the concentric pin in the nozzle bore 0 to 100% of the time, which was repeated at 1-min intervals. The prototype sprinklers were installed on a three-span 100-m (327-ft) linear-move system located at the University of Idaho Aberdeen Research and Extension Center (44.493°N,
Applied Engineering in Agriculture Vol. 21(5): 847−853
2005 American Society of Agricultural Engineers ISSN 0883−8542
847
Solenoid
Enclosure
Pin guide Elbow Pin Nozzle Spray head Rotating plate
Figure 1. Prototype II variable rate sprinkler.
112.973°W). Sprinkler height was approximately 1.5 m (4.9 ft) above ground level with 3-m (9.84-ft) spacing between sprinklers. Each sprinkler utilized a fixed 138-kPa (20-psi) pressure regulator to maintain nearly constant pressure to the sprinkler regardless of system pressure fluctuations, location along the linear-move lateral, and concentric pin setting. The theoretical high flow rate of the sprinklers was 26.31 L/min (6.95 gpm) and low flow rate was 9.46 L/min (2.50 gpm). Field testing was completed over an 18-day period spanning 23 September through 10 October 1996. CONTROL SYSTEM The distributed control system for site-specific center pivot irrigation described by King and Wall (1998) was modified to implement variable rate water and chemical application along the linear-move system using the prototype variable rate sprinklers. The control system software was modified to implement PWM control of each individual sprinkler along the linear-move lateral using a 1-min time period. Specific location of the linear-move was estimated using a given starting location and the calculated travel
distance based on monitored time of motion and calibrated ground speed. The calculated field location was periodically visually verified. The 0- to 20-ma output of the control system was used to control chemical injection rate proportional to computed time-averaged system total flow rate. This was accomplished using a positive displacement hydraulic diaphragm pump equipped with a linear actuator to control the stroke length of the hydraulic diaphragm proportional to a 0- to 20-ma input signal (Milton Roy Co., Ivyland, Pa.). As implemented, the control system network consisted of five sprinkler control nodes designated as nodes B through F and a master node designated as node A. Nodes B and F provided individual control to seven variable rate sprinklers. Nodes C, D, and E provided individual control to six variable rate sprinklers. Distribution of the sprinkler control nodes along the linear-move lateral is shown in figure 2. Every variable rate sprinkler was individually addressable by the master controller according to a variable rate control map. The five sprinkler control nodes operated independently from each other in regards to PWM cycle timing. Variable rate chemical application was achieved by varying water application depth while maintaining a time-averaged constant chemical concentration in the applied water. This approach requires variable rate chemical injection proportional to total system flow rate. Since each sprinkler control node operates independently, total system flow rate is continually changing in response to instantaneously variable sprinkler flow. However, time-averaged total system flow rate is equal to the sum of the time-averaged flow rate of the individual sprinklers. Maximum system travel distance during a 1-min PWM period was 1.8 m (6 ft), which is about 15% of the sprinkler 12.2-m (40-ft) wetted diameter. To simplify control system operation, we elected to use chemical injection proportional to time-averaged total system flow rate rather than proportional to instantaneous total system flow rate. A flow-dampening algorithm was implemented at each sprinkler control node to minimize system flow rate fluctuations and thus chemical concentration fluctuations with chemical injection proportional to time-averaged total system flow. The flow-dampening algorithm requirements at each sprinkler control node were: S Minimize fluctuations in total sprinkler flow rate for the node over the PWM period. S Limit each sprinkler to two changes in flow status over the PWM period. The purpose of the second requirement was to minimize mechanical actuation of the sprinkler to maximize its operational lifetime. The computational scheme of the node flow-dampening algorithm implemented at each control node, independent of other nodes, is shown in table 1. The algorithm utilizes a two dimensional sprinkler control array,
Figure 2. Catch can layout used for measuring water application uniformity and control node distribution along lateral-move system.
848
APPLIED ENGINEERING IN AGRICULTURE
Table 1. Local flow dampening algorithm computational scheme. Time Slot Valve No. j=1 j=2 … … j=M Time flow total Block flow total
t=1
t=2
V[1,1] V[2,1] … … V[M,1] F1 = ΣV[j,1] S1 = ΣF[t]
V[1,2] V[2,2] … … V[M,2] F2 = ΣV[j,2] S2 = ΣF[t]
…… … … … … … … …
t=N
… V[1,N] … V[2,N] … … … … … V[M,N] … FN = ΣV[j,N] … SN = ΣF[t]
V(j,t): j = 1,M; t = 1,N. The rows, m, of the array define the number of sprinklers at each node while the columns, n, define the number of time slots, t. Each cell is assigned a value of one if the sprinkler is to be at high flow or zero if at low flow rate (concentric pin engaged in nozzle orifice). The PWM period is the total of the number of time slots multiplied by the period allocated for each slot. A total of 20 discrete time slots over a 1-min PWM period were used which provided PWM control with a 5% resolution over the PWM period. Each time the algorithm steps from one time slot to the next at the predetermined rate (selected as 3 s in this application), each sprinkler is tested whether it is to be set on or off. The last two rows of the array are used to hold intermediate computational values. The second to the last row of the array contains the sum of the sprinkler states for each time slot, Ft. The numerical value of Ft is indicative of control node flow rate during time slot t. The last row of the array St is the sum of Ft (St = Ft + Ft+1 …. Ft+k−1) over the next K time slots inclusive. The value for K is determined by the PWM value for the sprinkler sent by the master controller. For example, a PWM value of 50% results in K = 10 for the 20 time slots. Calculation of St uses circular array referencing to calculate St near the end of the PWM period. St is computed only when a change in PWM schedule for a particular sprinkler occurs. The flow-dampening algorithm starts by setting the state of the sprinkler to be scheduled to zero (low flow) over all time slots. Starting with time slot 0 (t = 1) and working to time slot N, the new PWM for a sprinkler is tentatively scheduled in the sprinkler control array and new values for Ft and St are computed. This process is repeated for each of the N time slots. A low value for St indicates the beginning of the time slots where sprinkler flow can be increased while maintaining minimal total flow rate fluctuations for the control node. Using the constraint that individual sprinklers can change state only twice each PWM cycle greatly limits the patterns and starting positions that must be included in the search algorithm for minimal flow rate fluctuations. The maximum flow rate fluctuation between any two adjacent time slots is done on a per node basis. Randomly selecting the starting time slot for each node is sufficient to guarantee low probability that flow rates for all nodes will simultaneously peak. Differences in the crystal frequency of the microprocessor clocks between nodes further randomize time slot switching and distribute the flow fluctuations for the linear-move system as a whole. UNIFORMITY TESTING The catch can arrangement used to test water application uniformity of the linear-move irrigation system equipped with the prototype variable rate sprinklers is shown in figure 2. Catch can opening size was 152 mm (6 in.) and
Vol. 21(5): 847−853
height was 178 mm (7 in.). The opening of the catch cans was 30 to 38 cm (12 to 15 in.) above the bare ground surface and leveled by visual inspection. Two rows of catch cans spaced 4 m (13.1 ft) between rows were placed parallel to the linear-move irrigation system lateral. The spacing between cans within a row was 2 m (6.6 ft) along the total system length with additional catch cans along the middle span of the linear-move system to provide 1-m (3.3-ft) spacing within the span. Three rows of catch cans with 1-m (3.3-ft) spacing, aligned perpendicular to the system lateral, were located under the middle span of the linear-move system to monitor water application uniformity in the direction of system travel. Application depth was determined by measuring the volume of water in each can using a graduated cylinder and dividing the measured volume by the opening area of the catch cans. The tests were conducted when wind conditions were the most favorable. A weather station located within 400 m (1312 ft) of the irrigation system was used for monitoring climatic conditions. System travel speed was set to provide a 30.4-mm (1.2-in.) application depth at the 100% application rate. The corresponding system travel speed was 0.29 m/min (0.95 ft/min) and percentage timer setting was 16%. Time required for the linear-move irrigation system to pass over the two rows of catch cans was approximately 1 h. Time required to measure the water volume in each catch can was about two hours. Variable rate water and chemical application accuracy was also evaluated. A 1.1-ha (2.7-acre) field area was divided into twelve 32-m (105-ft) square plots, which corresponds to the span length on the linear move irrigation system. Four nitrogen application maps were developed and applied to test the ability of the variable rate sprinklers to deliver target water and nitrogen applications. For nitrogen application maps two through four, each application rate was applied once under each span of the linear-move system. The four arbitrary nitrogen application maps are shown in figures 3 through 6. The nitrogen source injected into the irrigation system was urea-ammonium nitrate (URAN), which is 24.4% nitrate, 24.4% ammonia, and 51.2% urea nitrogen composition by mass. A set of 10 catch cans was used to measure water application depth at the center of each plot. The catch cans were arranged in three rows perpendicular to system travel. There were three catch cans in the left and right rows and four in the center row which were offset one-half the 1-m (3.3-ft) can spacing to provide a diagonal arrangement between catch can rows. Application depth was determined using the same catch can measurement procedures as for the uniformity tests. System travel speed was the same for each test. The corresponding travel speed was 0.67 m/min (2.2 ft/ min) and the percentage timer setting was 39%. Time required for the linear-move irrigation system to pass over the 12 plots was approximately 3.5 h. The time required to measure the water volume in the catch cans was approximately 2 h. Water samples for NO3-N analysis were collected at four locations near the center of each plot, one in each quadrant using water capture devices which collected the water samples directly in plastic bottles for storage prior to analysis. Immediately following sample collection, the water samples were treated with boric acid to stabilize the NH4-N. Both NO3-N and NH4-N concentrations were determined with flow-injection analysis (Lachat Instruments, Milwaukee, Wis.). The URAN was injected into the linear-move irrigation system at a steady rate proportional to the time
849
Relative Application 100% 95% 90% 80%
Relative Application 100% 80% 60% 40%
75% 70% 60% 50%
Figure 3. Target nitrogen application map used for chemigation test number one.
Figure 5. Target nitrogen application map used for chemigation test number three.
averaged total flow rate of the system, calculated as the sum of the time-averaged flow rate of each sprinkler.
sprinklers were placed in the middle span. Since each prototype variable rate sprinkler was hand constructed, there were minor differences in their performance, namely the concentricity of the nozzle restricting pin. Also, there tended to be more travel speed variation near the ends of the lateral due to functioning of system guidance mechanism. Measured relative application rates were close to target relative application rates with exception of the 36% relative application rate test. The only plausible explanation for this anomaly is operator error in setting the percentage timer. The desired percentage timer setting was 16%, but the measured relative application rate corresponds to a percentage timer setting of 26%. Since the other measured relative target application rates were close to the target relative application rates and the pin was engaged on the nozzle bore continuously to provide 36% sprinkler flow rate, the only reasonable explanation for the low measured relative application rate is incorrect system speed. Any failure of the control system would have caused the pin to be retracted from the nozzle, increasing sprinkler flow rate and resulting in a measured
RESULTS AND DISCUSSION WATER APPLICATION UNIFORMITY Measured water application uniformities (ASAE Standards, 2003) of the linear-move system equipped with the prototype variable rate sprinklers for various target application percentages are shown in table 2. Water application uniformities for the whole linear-move system based on 2-m (6.6-ft) catch can spacing and for the middle span based on 1-m (3.3-ft) catch can spacing are both given in table 2. Water application uniformities were calculated using a composite of all catch cans in both rows rather than the average of each catch can row. Numerically there was little difference between the two calculation methods. Application uniformity for the middle span was generally greater than for the whole system. We attribute this to the absence of end effects and the fact that the best functioning prototype variable rate Relative Application
Relative Application
100%
100%
80%
85%
60%
65% 45%
45%
Figure 4. Target nitrogen application map used for chemigation test number two.
850
Figure 6. Target nitrogen application map used for chemigation test number four.
APPLIED ENGINEERING IN AGRICULTURE
Target Relative Application (%) 100 84 68 52 36
Table 2. Measured water application uniformity for various application percentages. Application Uniformity (%) Time Pin in Avg. Application Measured Relative Lateral Traverse Nozzle Depth Application Whole System Middle Span Mean (%) (mm) (%) 0 30.4 −−− 94.5 96.2 97.5 25 25.0 82 95.1 94.8 97.2 50 21.0 69 93.6 95.4 96.9 19.7 65 92.5 94.1 96.3 75 15.0 49 89.9 90.9 97.4 15.5 55 90.4 93.8 96.2 100 7.0 23 85.7 89.7 93.0
relative application rate greater than the target relative application rate. The traverse water application uniformity shown in table 2 represents water application uniformity parallel to the direction of system travel averaged for the three catch can rows perpendicular to the middle span of the linear-move system. The traverse application uniformities all exceeded 92% for the travel speed tested indicating excellent performance of the prototype variable rate sprinklers. There is a noticeable difference in traverse water application uniformity between 36% and 52% relative application rate. This is attributed to the 15% reduction in wetted diameter of the sprinkler when the restricting pin in engaged in the nozzle. For the 36% relative application rate, the wetted diameter remains smaller which reduces sprinkler overlap and results in a lower traverse application uniformity. This suggests that the variable rate nozzle may achieve higher application uniformity under reduced flow rates than an equivalent fixed flow rate sprinkler due to its the greater effective wetted diameter when the restricting pin is cycled. Measured water application uniformities for the various target application percentages indicate that application uniformity decreases slightly with decreasing water application depth. This is likely due to the general decrease in effective wetted diameter of the variable rate sprinkler as application rate decreases (King and Kincaid, 2004). As a general rule, field scale water application uniformity of center pivot and linear-move irrigation systems should exceed 85% as a minimum performance standard. All measured application uniformities exceeded 85%. With the exception of the 36% application test, where the sprinkler wetted diameter was the smallest and wind speed was the greatest, the measured application uniformities exceeded
Avg. Wind Speed (m/s) 0.5 0.5 1.1 0.7 1.1 1.2 2.5
90% over a 52% to 100% range in target application depth. Overall, the measured water application uniformities were within acceptable limits, and the results indicate that the variable rate sprinkler functioned very well in this regard. Higher application uniformities could likely be achieved with development of manufacturing techniques that guarantee concentric placement of the restricting pin in the nozzle. These results indicate that the variable rate sprinkler is capable of high water application uniformity over a 36% to 100% range in flow rate. CHEMICAL APPLICATION Results of the variable rate nitrogen application test for the target application map depicted in figure 3 are given in table 3. This variable rate nitrogen application test included eight target percentage rates, most of which were not duplicated. The 5% PWM resolution of the control system limits water application resolution to 3.2% over the controlled application percentage of 36% to 100% of sprinkler flow rate. This resolution is partially responsible for some of the differences between measured and target water application percentages in table 3. By definition, 90% water application uniformity results from a 1.6-mm average deviation for an average application depth of 16 mm. Since a 10% deviation from the target application depth occurs on average over a small sample area under a properly functioning linear-move irrigation system having 90% water application uniformity, a target application difference of 5% may not necessarily be detected with a single test. The fact that measured water application percentages were within 5% of the target percentages showed that the prototype variable rate sprinklers performed within expectations.
Table 3. Water application and NO3−N concentration in the applied water for chemigation test one. Target Application (%) 100
95
90
80
75
70
60
50
3
1
2
1
1
1
1
2
Water application Average (mm) Std. deviation (mm) Relative application (%)
15.8 1.0 −−−
15.6 0.4 98.7
13.8 0.4 87.3
12.2 0.4 77.0
11.5 0.6 73.0
10.4 0.7 65.9
9.1 0.3 57.6
7.1 0.5 44.9
NO3−N concentration Average (mg/L) Std. deviation (mg/L)
101.8 1.9
110.3 4.3
103.2 2.2
109.4 0.3
103.0 2.3
100.9 2.0
102.5 3.8
110.3 7.4
NO3−N application Average (kg/ha) Std. deviation (kg/ha) Relative application (%)
16.1 1.18 −−−
17.2 −−− 107
14.2 0.20 88
13.3 −−− 83
11.9 −−− 74
10.5 −−− 65
9.3 −−− 58
7.8 0.75 49
No. plots
Vol. 21(5): 847−853
851
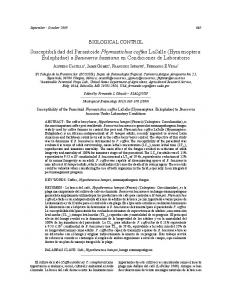
The mean measured NO3−N concentrations in the applied water for the first variable rate nitrogen application test are included in table 3. Under the conditions of constant irrigation system flow rate and constant chemical injection flow rate, NO3-N concentration in the applied water would be constant. However, since system flow rate was constantly changing and the chemical injection rate was set proportional to the time-averaged total flow rate at a given lateral location, nitrogen concentration in the applied water was also constantly changing. This, coupled with the fact that water application rate varies considerably along the wetted radius of the sprinkler pattern, is one reason for the ±5-mg/L variation in measured NO3-N concentrations for the various target water application percentages. Thus, the measured NO3-N concentrations in the applied water are within expectations for the given operating conditions. The flowdampening algorithm likely helped reduce variability in measured NO3-N concentrations in the applied water, but it did not eliminate it. These results are likely representative of what can be expected when using on/off pulsing to achieve variable rate water application while injecting chemicals into the irrigation system at a constant proportional rate. The mean computed mass of NO3-N applied to each target application percentage is also shown in table 3. Since the mass of applied NO3-N is the product of measured water application depth and measured NO3-N concentration of applied water, a 10% deviation in either can result in a 10% deviation in the computed applied mass. In general, the actual NO3-N application percentages are very close to the target percentages. The most notable exception is with the 95% target application where the high computed NO3-N application is due to a high measured water application and a high measured NO3-N concentration in the applied water. This measurement is considered to be an outlier since the remaining six applications are within 5% of the target application percentages. This outlier is the result of both high NO3-N concentration and volume measured in catch cans. This outlier would likely have averaged out with replication of this application percentage. Mean measured water depths, measured NO3-N concentrations, and computed applied mass of NO3-N for the variable rate nitrogen application maps depicted in figures 4, 5, and 6 are given in tables 4, 5, and 6, respectively. These three target nitrogen application maps were designed to apply four levels of nitrogen replicated three times in each application test. This was done to obtain a good measure of water and nitrogen application for each target application rate. The results show that water application was within 4% of the target percentage for the three tests and NO3-N mass application was within 4% of the target percentage with one exception that was within 6% of the target percentage due to a high measured NO3-N concentration in the applied water. Overall these results demonstrate that the prototype variable rate sprinkler is capable of providing a 40% to 100% range in nitrogen application with good accuracy. Comparison of target versus measured NO3-N mass application percentage for all four chemigation tests is shown in figure 7. Linear regression analysis results in an intercept of 2.3% and slope of 1.045, both of which are not significantly different (P < 0.01) than 0 and 1, respectively. This indicates that overall the variable rate sprinkler and control system applied target amounts of NO3-N to the test plots with a high degree of accuracy.
852
Table 4. Water application and NO3−N concentration in the applied water for chemigation test two. [a] Target Application (%)[a] 100
80
60
45
Water application Average (mm) Std. deviation (mm) Relative application (%)
16.1 1.5 −−−
12.2 1.1 75.8
9.0 0.5 56.0
6.7 0.6 41.5
NO3−N concentration Average (mg/L) Std. deviation (mg/L)
109.0 4.8
108.9 7.3
112.0 6.1
117.3 5.6
NO3−N application Average (kg/ha) Std. deviation (kg/ha) Relative application (%)
17.5 0.91 −−−
13.3 2.40 76
10.1 0.86 57
7.8 0.92 45
[a]
Each target application was replicated three times.
Table 5. Water application and NO3−N concentration in the applied water for chemigation test three. [a] Target Application (%) 100
80
60
40
Water application Average (mm) Std. deviation (mm) Relative application (%)
15.7 1.0 −−−
12.5 0.6 79.4
9.2 1.2 58.2
6.1 1.0 38.5
NO3−N concentration Average (mg/L) Std. deviation (mg/L)
101.9 3.2
104.8 4.2
116.3 28.3
113.3 5.9
NO3−N application Average (kg/ha) Std. deviation (kg/ha) Relative application (%)
16.0 0.87 −−−
13.1 0.66 82
10.6 1.63 66
6.9 1.38 43
[a]
Each target application was replicated three times.
Table 6. Water application and NO3−N concentration in the applied water for chemigation test four. [a] Target Application (%) 100
85
65
45
Water application Average (mm) Std. deviation (mm) Relative application (%)
16.3 0.8 −−−
13.8 0.7 84.7
10.1 1.2 62.0
6.7 0.6 41.0
NO3−N concentration Average (mg/L) Std. deviation (mg/L)
96.3 3.8
98.5 4.9
103.0 5.6
108.7 4.6
NO3−N application Average (kg/ha) Std. deviation (kg/ha) Relative application (%)
15.7 1.03 −−−
13.5 0.44 86
10.4 1.01 66
7.3 0.65 46
[a]
Each target application was replicated three times.
It is interesting to note that in general the difference between target and measured water application increases with decreasing application percentage. Concurrently, there is an increase in NO3−N concentration with decreasing application percentage. These trends are especially apparent in table 6. Since three plots were chemigated at any given time, NO3-N concentration would be the same for each plot assuming adequate mixing of the injected fertilizer. Since the location of each target nitrogen application occurred once
APPLIED ENGINEERING IN AGRICULTURE
Measured Application Percentage
120
CONCLUSIONS
100
y = 1.0454x − 2.3772 R2 = 0.9503
80 60 40 20 0 0
20
40
60
80
100
Target Application Percentage Figure 7. Comparison of target against measured nitrogen application percentage for all four chemigation tests.
under each span of the linear-move, any chemical concentration gradient along the linear-move lateral would average out. One explanation of the evident trends with decreasing application percentage is evaporation from the catch cans. Evaporation of 1 mm (0.04 in.) from the catch cans represents a 6% loss for the 100% application rate but 15% for the 45% application rate. This difference in evaporation percentage between application percentages would explain the increase in nitrogen concentration with decreasing application rate. The relative application error for the 45% application rate (table 6) is 8.89%. An 8.89% increase in nitrogen concentration due to evaporation relative to the concentration measured for the 100% application rate would result in a NO3-N concentration of 105 mg/L. If the depth of water evaporated from the catch cans is assumed to be the same for both the 100% and 45% application rate (table 6) and the concentration in the applied water is maintained constant, solving for evaporation depth using two equations and two unknowns results in an evaporation depth of 1.59 mm (0.063 in.) and a NO3-N concentration in the applied water of 87.8 mg/L. Using these values and computing the concentration of NO3-N in the catch cans for the 85% and 65% application rates (table 6) yields 97.9 and 101.6 mg/L, respectively, which are within 2% of the measured values. Average daily well-watered alfalfa reference crop evapotranspiration (Wright, 1982) over the 18-day period during which the tests were run was 3.8 mm (0.15 in.) and average maximum daily temperature was 23.6°C (75°F). The corresponding average hourly evapotranspiration rate was 0.32 mm/h (0.0125 in./h) or 1.58 mm (0.062 in.) over a 5-h period. Heat stored in the catch cans from incident solar radiation prior to a test run would also contribute to evaporation. The estimated catch can evaporation of 1.59 mm (0.063 in.) during the 5-h test duration is reasonable. Thus, catch can evaporation partially explains why the difference between target and measured water application increases with decreasing application percentage and measured NO3-N concentration increases with decreasing application percentage. Since NO3-N application is NO3-N concentration multiplied by application depth, the mass of NO3-N concentration is within 1% of the target application (table 6) regardless of evaporation influence.
Vol. 21(5): 847−853
Field-scale testing of a prototype variable rate sprinkler on a three-span linear-move irrigation system provided water application uniformities of 90% or greater over a 36% to 100% range in application rate. Variable rate water application was within 5% of the target depth for all tests spanning a 40% to 100% range in application rate. Similarly variable rate nitrogen application was within 4% of the target rate for a 40% to 100% range in application rate. The control algorithm successfully implemented individual control of the sprinklers and produced good results in regards to water application uniformity and spatially variable nitrogen application. The test results are quite remarkable considering the simple hand-made prototypes that were used. Better performance could likely be achieved with development of manufacturing techniques that guarantee concentric placement of the restricting pin in the nozzle. The results show that the variable rate sprinkler is capable of high water application uniformity over a 36% to 100% range in application rate. Additional research and development is needed to evaluate performance over a greater range in flow rates, long term reliability, and manufacturing and economic feasibility.
REFERENCES ASAE Standards, 50th ed. 2003. S436.1 Test procedure for determining the uniformity of water distribution from center pivot and lateral move irrigation machines equipped with spray or sprinkler nozzles. St. Joseph, Mich.: ASAE. Evans, R. G., S. Hans, M. W. Kroeger, and S. M. Schneider. 1996. Precision center pivot irrigation for efficient use of water and nitrogen. In Proc. 3rd Intl. Conf. on Precision Agriculture, eds. P. C. Robert, R. H. Rust, and W. E. Larson, 75-84. Madison, Wis.: ASA. Fraisse, C. W., D. F. Heerman, and H. R. Duke. 1995. Simulation of variable water application with linear-move irrigation systems. Transactions of the ASAE 38(5): 1371-1376. Harting, G. B. 1999. As the pivot turns. Resource 6(4): 13-14. King, B. A., J. C. Stark, I. R. McCann, and D. T. Westermann. 1996. Spatially varied nitrogen application through a center pivot irrigation system. In Proc. 3rd Intl. Conf. on Precision Agriculture, eds. P. C. Robert, R. H. Rust, and W. E. Larson, 85-94. Madison, Wis.: ASA. King, B. A., and R. W. Wall. 1998. Supervisory control and data acquisition system for site-specific center pivot irrigation. Applied Engineering in Agriculture 14(2): 135-144. King, B. A., and D. C. Kincaid. 2004. A variable flow rate sprinkler for site-specific irrigation management. Applied Engineering in Agriculture 20(6): 765-770. Sadler, E. J., C. R. Camp, D. E. Evans, and L. J. Ursey. 1996. A site-specific center pivot irrigation system for highly-variable coastal plain soils. In Proc. 3rd Intl. Conf. on Precision Agriculture, eds. P. C. Robert, R. H. Rust, and W. E. Larson, 827-834. Madison, Wis.: ASA. Perry, C., S. Pocknee, and O. Hansen. 2003. Variable-rate irrigation. Resource 10(1): 11-12. Wright, J. L. 1982. New evapotranspiration crop coefficients. J. Irrigation and Drainage Div. ASCE 108(IR2):57-74.
853
854
APPLIED ENGINEERING IN AGRICULTURE