Nov 7, 1989 - 500 eV. Tile continuously variable altitude grid allows altitude steps of ..... by a plus while the excitation ...... T()RR FT ti ...... and P. A. Sachet,.
i 4
Differential
Final Technical Progress Report Collision Cross-Sections for Atomic
Contract
Oxygen
NAS8-36955
Delivery
Order
48
George C. Marshall Space Flight Center Space Sciences Laboratory National Aeronautics and Space Administration Marshall Space Flight Center, Alabama 35812
by
Dr. Douglas G. Torr Principal Investigator The University of Alabama in Huntsville Center for Space Plasma and Aeronomic Research and Physics Department Huntsville, Alabama 35899
February
1991
N91-24547
(NA_A-CR-/_'Z/_/// CROSS-$ECTIn.NS Technic,_I
Jut.
]990
OTFFE"ENTTAL CI3LLTSTON FjP _TqMiC OXYGEN final PFO_F,_.SS Report, II Jui. 19Q9 - IO (A1,_bdma Univ.) I_8 p CSCL 20H G3/7_
Unclas 0330320
.-Report _?3Ce
1. Report
Title
4.
Documentation
Page
AOm_:_Br,al
@ O _ f',l
TI-
•,-I _
2_ ,iO
.D
w IE2
_N
t_ •,-t 4J ,..-t m o'. I n" e* I
b.I
•,i't _-t
WO_dlSONV
_3d
SHOI3-1IVB
NI
IIISN31NI
,I_
llllllllIlllIIIIIIllIlllllIIIIIIlllllllIIlllIIIlllllllrTIllIIIIlililiillililil
14 0 -,-t
GO
i
ill
ii
L
@ J_ (D -_I
z
"o w
@
-_I _D CO 0_
i
0 rr k-u_ (__ Z
IL. I h iL. • 0
0 _J @ U]
I 'II'
0
(N Z
W J
w
"Ii
,.n
-
(D r_J Z r_ W _J w
Z
S
gg
_0 .,i t .1_ w _D p.. L_
Ii-
_-_
.T_.I-II
o" I
I
(_ rO ,:r
w 6-
lllIllllIllllllllllllillllllIlllllllllIllllllllllltiiilllillliiillllIllllllll
_0 _DPO
.0 _,i
I
WO_ISgNV
W3d
SHgI39kVW
NI
I
AIISN31NI
T
T
o
"_
0
i
IIIIIIIIIIIIIIIIIIIIIlllllltlllllllllllltlltllllll|]l|lillllllllltlllllllllll_
o_-_ 0
E_ E_ 00 E_
(11 •,-t .,-t @ @
O3 E_
0
_
E_ _O O3 O" U _ (.,'3 o rr or) E_ cN i tD co o,,I I
Z
e14 ° O_
z
@ @ m
-IE_ E_ Lo r,J z r_ i,i _J bJ
[, Z
_ -,.-t _
,D Xl
w _D r_ L_
_
_'"_
E_ o" L_
I
E_
!
_O
@
@_0 _0_
E_ II
IIIIIIJlllllllllilllllllll_l
III[lllllttlllllllll
illtllllltliiill
Q O0
H0_ISgN_
_3d
SHOI3"]IV_
N]
-,.-I Q).,-I
tlillflllll
qO E_OO CO f
L_
f
_I]SN31NI
I
I
123
i I I
I I I
I I I
I'1
t
I I I
I I I
i I I
I I I
I I
I I I
I I I 11
I
I I I I I
I I I
I I I1
I I|
I
I I
I I 1 I
I I I
I il
i
ii
i
i
i
1 i
i
I 1 I
I't
I
C 0 CO
C .,.4 C
-CO 0
C 0
:c"
r o
o M
Fto z
0
_r
z !
@ -r
!
_D o,J Z W
iic
_D
W I'N
W 0 0 @ _4 @ U_
,D ._ ,-t
..@ r--
m
I--
o-
m_
I
n,m I
fXl
6IIIIIIIIlllllllllllilllllllllllllllllllltlllllllllllLllllllllllllll!llllllllll
* lad
/ io o
I
I
'
"%'"J
io o
,
J : =.l.lJ
I01
10 2
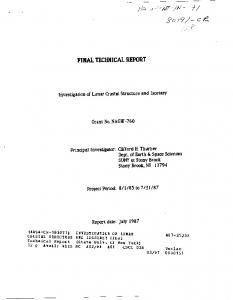
ENERGY Fig. 1. Average electron energies The
average
energy (E,,.)
ionization
excitation
potential
JO 4
(ev)
losses per collision and average secondary as a fu.nction of primary electron energy. potential
ergy loss per ionization potentials are indicated tential is set equal to
10 3
is labelled
I and
the
total
en-
is labelled I+E,,,. The average excitation by an asterisk and the O; excitation pothat of N2. Note that below 6 eV, the N2
is set
at
1 eV.
The dependence of the average secondary energy on the primary energy is shown in Figure 1 along with the average total energy loss of the primary (I + E_). The average energy of the secondaries increases steadily from 0 near threshold to 52 eV for 10 keV primary electrons. The total energy loss per ionizing collision for 10 keV electrons is 72 eV, when the 20 eV ionization potential is included. The average energy of the secondaries is approximately equal to the ionization energy for 200 eV primary electrons. A quantity of interest, in relation to energy degradation of high energy electrons, is the average energy required to produce each electron-ion pair. The average energy required to produce e_ch electron-ion pair is a quantity that is independent of electron energy and is also remarkably independent of the species being ionized. The experimental value for the energy lost per electron-ion pair for high energy electron is 35 eV [V_lentine and Cgrran, 1958]. This energy loss per electron-ion pair was used in early auroral electron deposition codes [Rees, 1963: Rees et al. 1969; Rees and Jones, 1973]. An approximate value for the energy loss per electronion pair can be deduced by using the average energy losses depicted in Figure 1, assuming that for electron energies above approximately 100 eV the energy lost to excitation collisions is small and can be neglected. With this assumption, it requires about 160 ionizing collisions to thermalize a single 10 keV electron. Thus, on the average, 62 eV is lost in the creation of each of the 160 electron-ion pairs. Since the ionization energy is 20 eV for electron energies above 100 eV, the average energy of the secondaries is -_42 eV. This means that
I0.340
the
RICHARDS
160 secondary
create
one
daries
created
number per
electrons
more
of
an
reality
would
excitation the
does
ergy and produced 160.
would not
processes
ionization
320
begin
to
and
excitation
attd
only
a 42
half
sections
than
a half,
of
primaries
100
eV
10
the
[Richards
and
Tore,
electron
would
ion
pairs
electron-ion
pair
an
eV.
This
calculation
including
the
value.
actual
[1971]
that
to
system
the
act
auroral
ergy
loss
per
than
our
estimate
the
by
al.
loss
and
we
obtain
pair
but
Foz
and
average
electron
has
per
to do
likely
to
the of
[1988]
using
their
with
a 1 keV
the
loss
per
37 eV
tend
electron
will
average
of only
tllem
undergo
than
they sion
are
much
less
Richards
and
Tore
established
cross sections and are much
cross
sections
decay less im-
both
because
because the energy loss per total ionization cross sections
than there
the
are
total
some
Dunn, 1966]. We have ionization cross sections
excitation
cross
differences
adopted of Rapp
colliare sec-
[Kieffer
and
the N2 and O2 total and Englander-Golden
[1965] elers.
which have also been used by most other modThe total ionization cross section for O is from
Brook
et al.
[197'8].
The
important We have
because used tile
al. [1988] The total
and also their cross sections
shown
in Figure but
at high because
fluxes.
The
land ours
at higher
section. total
et
section
[1988] The
below
differences
little effect on the calculated fluxes cross section is smaller than the However,
30 eV produce
N.,
cross
et al.
energies.
very
coefficients. model are
excitation
Solomon
are
transport. Solomon
differences
comparable
excitation
cross
in cross
differences section
of
in
$teiek-
et al. [1983] is ahnost a factor of two larger than at all energies and their fluxes would be a facof
two
where of
of
sections
backscatter in our auroral
N2 total
that
is smaller
cross
cross
in inhibiting sections of
elastic used
2. Our to
below
elastic
of their role elastic cross
energies have the excitation
ionization
lower
below
Nx is the
Solomon
et
primary
tion.
Moreover,
30
eV,
donfinant
at
least
species.
al,
[1988]
by
sunmfing
and
the for
possibility example, Strickland
below
The
Strickland tile
cross
of double those that
km
sections
et al.
partial
et al.
200
cross
[1983] sections
counting some lead to dissocia-
[1983]
included
large
energies degrade are
10"14
.......
,
........
,
........
I
.......
ex-
ionizing
eV before have an
likely
excitation energy
ionization and The
although
there is sections;
22
to the
tile
are smaller is smaller.
better
by
energies.
portant
and cross
For
of 45 electrons
to higher
between
which
only
loss
published
the same cross sections have been used they have been reparameterized to ex-
100 eV, the with increasing
obtained
ionization.
energy secondary
been
Basically study but
were
as they
secondaries
25 eV compared
and
the
have
RATR
Above rapidly
tor was
discrete
initial
collision
secondary
an average Thus, the
and
higher
energy
collisions with it thermalizes.
the 10 keV electrons additional ions.
laboratory
relationship
energy with
higher generate
energy
with value
electron
energy
produce
en-
is smaller
The reason that the energy is not a strong function of
Electrons
a greater they
in our
average
which
higher
Victor
secondary
energy.
an
of 35 eV,
in agreement
rate
EMISSION
100 eV
[1988]. in this
25 eV
ef
A
is comparable
be lost
energy
production
A slightly
energy
ample,
will
ion
energy loss method. per electron-ion pair
more
of
to determine Banks
the
per
detailed
by
total
electron-ion
value.
obtained
but
loss
a more
out
240
estimate
electrons
to increase
calculation,
measured
suffer
all
is required
pointed
original
about
energy
and
de-
below
the
low
sections
SUlnmed
full
the
pair
by
pair.
We have
electron
Thus
is only
backscattered
and
electron-ion
local lost
was
to pro-
energies
3371
tions
equal
produce
transport It
en-
ionization
is created
average
electron-ion
escaping
total
be expected
1985b].
yield
per
with
approximately
ultimately
and
lost
eV,
electron
with
of 42
the energy
100
effectively
ionization
secondaries
electron
eV.
pair. This agrees with show that a third rather
and
keV
to 31
below
the
could
total
total
energy
electron-ion pairs would be less than
are
the secondaries
to
secon-
the
62
available
electron
duce all additional electron-ion our previous calculations that graded
from
additional electrons
eV
cross
pair,
compete the
all
average
because,
for
the number of by the secondary for
If
the
decrease
happen
processes
In fact,
and
AURORAL
energetic
each.
electron-ion
be
pair
this
pair
additional
pairs
TORR:
sufficiently
electron-ion
electron-ion
In
are
AND
42 eV for
I0"
IS
E
to produce
I 10-*°
2.4.
Cross
Sections
In a number photoelectron tation tween
cross theory
of previous flux we have
by
section
Pitchford with
where
atomic
sion duced
cross
Phelps PES
oxygen
sections
good
surements.
the
was
measurements.
total
by
between cross
found At
dominant
measured
mobility
theory
high
species,
Zipf and sections
to
and for
At to-
studies be
altitudes
PES energies
0 i0-17
iO-II I i0 0
,
L|*.J,i
: _0 !
.
|:.*.,I
I I0 z
I
Ill
*HI 10 3
I
I
I I''" 10 4
com-
the emis-
co-workers
0
bemea-
et al., 1980]. species, the
electron
[1982]
is the
agreement These
front
ionospheric total exci-
good agreement spectrometer
AE-E satellite [Lee N2 is the dominant
obtained and
patible
of the measured
sectious that produce and the photoelectron
surements front tile low altitudes where tal cross
studies chosen
promeabe-
£NER(;Y
(,V)
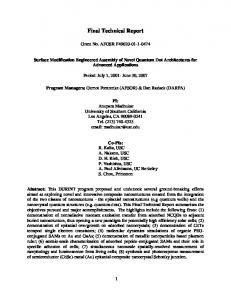
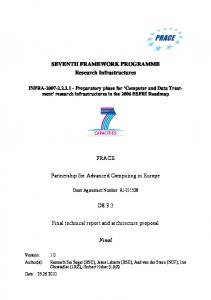
Fig. 2. Total elastic, excitation, and ionization cross sections employed in the model. The ionization cross sections arc indicated by a plus while the excitation cross sections are indicated by an asterisk.
RICtIARDS
AND
TORn:
3371
AURORAL
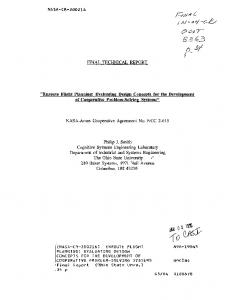
Rydberg cross sections from Green and S_olarski [1972] which have been revised sharply downward by Porter et al. [1976]. There is now good agreement between the total cross section of Pitchford and Phelps [1982] and the sum of the partial excitation cross sections of Cartwright et M. [1977a, b] as revised by Trajmar et aI. [1983], below 20 eV. Above 20 eV, the ionization cross section becomes an increasingly important component of the total inelastic cross section and it is not easy to compare the two cross sections. The total atomic oxygen excitation cross section employed by Solomon et al. [1988] is a factor of 2 larger than ours above 15 eV and will produce a siluilar difference in flux above 250 km where O is the dominant species but the atomic oxygen cross section has little effect on the integrated emission rates. Our atomic oxygen excitation cross section was obtained by summing the measured emission cross sections for 1304, 1356, and 1027 _. [Zipf and Erdman, 1985], the 989 cross section from Gulctcek and Doertng [1988], and the theoretical ID and 1S from Henry et al. [1969]. hnplicit in this procedure is the assumption that the higher lying triplet and quintet states are included in the 1304 and 1356 emission cross sections via cascade. We have left out some theoretical Rydberg cross sections proposed by Jaekman et al. [1977] and some minor states that radiate directly to the ground state but for which there is no experimental data. Thus, our cross section must be regarded as a lower limit. Figure 3 shows the excitation cross sections for the second positive (C3r.) and Lyman-Birge-Hopfield (air,l) systems of N._. Also shown is the cross section
A
EMISSION
10.341
RATE
by multiplying the 3371 ./_ cross section of Imami and Borst [1974] by 4 and the (air,l) cross section is front Ajello and Shemansky [1985]. We have examined the sensitivity of the emission rate ratios to cross sections and this will be discussed later. In all these calculations we have used the 1 erg cm-'_s -t Gaussian incident flux distribution, and the neutral atmosphere employed by StrickIand ef al. [1983]. 3. 3.1.
Comparison
RBSULTS
With
We have calculated
Previous
Work
the N._ 3371 ./_, N + 3914 A., N +
4278 _, , O 1356 _ , and several N2 LBH band emission rates as a fimction of energy and these are shown in Figure 4. This figure shows that both the 3371/_. and 3914 _. emission rates are independent of the characteristic energy of the precipitating flux for energies above 2 keV in agreement with the results of Stricktand et al. [1983] and Daniell and S_rickland [1986]. Not only is the shape in good agreement but, except for the 1356 _. emission rates, the magnitudes are also in good agreement. Although the shape of the 1356 }k curve is in good agreement with that of Strickland et al. [1983], the magnitude is a factor of 2.5 lower owing to the use of the revised cross section of gipf and Erdman [1985].
3914
used for calculation of the 0(5S) 1356 _ emission rate. We obtained this cross section by reducing the measured cross section of Stone and Zipf [1974] by the factor 3.1 which is the same factor that the 1304 _ emission cross section of Stone and gipf[1974] was reduced by Zipfand Erdman
[1985].
The
(C3r,,)
cross
section
was obtained
,- "i l
al
e IO-17
0 0
2
0 -
I*l,*lZ||l|llJ
6
ENERGY
(keV)
-_llmllll._,*..
4
O
I0
I0-11' 0
5
I0
18
20
25
30
35
40
48
50
Fig.
4. Calculated
tic energy ENERGY
(eV)
energy are
Fig. the
3.
Cross
emissions
sections studied
for in
the this
three p_per.
excited
states
giving
rise
to
flux of i
taken
culations Daniell
emission
for a G aussian
into in and
erg
cm
account,
Figure Strtckland
rates energy
-2
s -i . When
there
(1986).
with
in cross
agreement
et al. (1983)
characteris-
a total incident
differences
is excellent
8 of Strickland
of the
as a function distribution
and
sections
with
the
Figure
cal11 of
ORIGINAl. PAGE '" OF POOR QUALITY I0.342
R[CHARDS
We have included affects both the bands
when
electrons
02 Schuman-Runge 1356 ]k and the
the
characteristic
penetrate
1983].
The
of
LBH
for
3914
tile
._
[1979]
N__ emissions.
ratio
and
is 0.3
our
3371
to 0.8 from Solomon agreement between ratios
but
there
parameters
3.2.
have
acterize
cross
is 0.98
uncertainty the
parameter
sensitivity
of the
ratio
a similar flux
0.3
to
rate. of up
sections
0.25
and of
of
10%
in
species. but
the
finally
and
of the
is next
through
he escaping
flux
ch
smaller
and
heat
of the
energy small
ill molecular more higher
Downward
on
are
available
shown
with
(20%)
wifile
backscattered than
the
45%
for high oxygen
energy
the
(35%).
is lost
This
escape
by
but
incident
fluxes.
Ab-
opposite
deeper
,
•
•
6
•
,
7
II
•
•
•
•
11
I0
Spectra
moving
fluxes
in Figure
pronounced
and
i
!
........
120,
174,
223,
incident
and
326
Gau_ian
of 1 erg cm-2s -t. The incident at 5 keV in Figure 6. At the there is very the degradation at
|
at
6 for a 5 keV
'
120
kin.
' ' ..... ,
'
little is
degradation noticeable
Because
there
' '''"'!
.......
at
is so
,to
10"
io'r
io I X ,.J 14,
IOB
IO4
absorption
energy the
•
Banks
use of different Below 1 keV, energy,
with
•
5
flux
electron the
•
Exci-
15%
obtained
Fluz
174 km
capture
for the shows
•
4
+her-
escape
oxygen
•
3
altitudes, flux but
5 shows tile excitations,
flux.
of atomic sinks
important
a greater proportion the characteristic e,
for
only
|
an energy flux be seen centered
patti-
N_ ions
energy
,
two highest of this initial
ionization
backscattered energy.
excitation
e important
becoming
and
effect
and
et al. [ "4], possibly as a result of the cross sec:ions and backscatter coefficients.
sorption
Electron
flux with flux can
relative
a possible
into space. Figure amongst ionizations,
heating
share
become
3.4.
the
is initially
as
!
2
pro-
km
negligible
flux
emerges
of characteristic
of N_
they
_,
excitation
of excitation
.
I
N2 the
oxygen inelastic cross
estimate
has
energy
number it
iectron
"uization
3914
and
t
Fig. 5. The initial partitioning of the incident I erg em -3 s -1 energy flux between ionization, excitotion, thermRl electron heating, and backscatter as a function of characteristic energy. The largest proportion of the energy (_35%) goes in::mlly into the ioldzation potential of the N + wlfile (--.20%) goes into N2 excitation. Only (_16%) is backscattered out of the thermosphere. O is an important absorber of energy at the lowest energies while 02 becomes increasingly important as the characteristic energy ncrenses.
IOI
is radiated partition
a function greatest
low
of the
is not sensitive to most other param-
average
this
the
for most
increase in the 100 eV reduces
We
computed
electron
before
thermal
a 30% above
•
0
ENERGY(keY)
Budget
mosphere or gross energy
is
input
positive
decreasing
coefficients,
the
a large
processes
et
to char-
second
atomic and molecular the O, O.+, and Nz
our
incident into
by
increasing
backscatter
Energy
tation
of tile
is responsible
by
ionization potentials our computed ratios.
tile
studies
The integrated ratio to a factor of two in
concentrations
as
the
emission rates to possible Obviously, a reduction of rate cross section would
effect
which
including: the cross sections,
T!:_
in
calculated and measured values into excellent but a 30% increase in tile N_. total excitation
from
tioned
compared
.0!
ratio
3.3.
et al.
differences.
some
has
"_." .... 1
to
./k ratio
_ emission. Likewise, ionization cross section
error
X
Solomon obtained better ratios and tile measured
3371 total
eters elastic
3371 Sharp
....
7.. 2
emisval-
[1989]. his model for
RATE
_____
from
._, to 4278
is sufficient
electron
duct:-, chan_es
our
EMISSION
the
taken
negative measured
10 keV,
A
et al.,
of Ratios
section
energy
and
from
to first negative integrated errors m the model inputs. 20% in the 3371 ./t emission bring the agreement
are
to first of the
performed
the
high
3371
which LBH
]k
to 0.25
to account
Sensitivity
We
At
compared
AURORAL
[Strickland
bands
Ajello and Shemansky [1985]. Our calculated second positive sion rate ratios are within 20% ues
are
altitudes
the
ToRn:
absorption 1200-1600
energies
to lower
ratios
AND
I0 a iOo
Thermal
electrons
of the :gy.
available
energy,
io |
IO 4
ENERGY (ev)
penetration
fluxes.
ioz
ioI
trend, capture the
lower
Fig. 6. Downward moving tudes for a 5 keV Gaussian flux is 1 erg cm -2 s -l
electron incident
flux spectra at several altiflux. The incident energy
RICHARD$ AND TORn: AURORAL little interaction with tile thermosphere for high energy electrons at the high altitudes, there are few degraded primaries to fill ill the region between 300 eV and 5 keV. However, at the lowest altitudes this intermediate energy range is filled in. Comparison of the downward fluxes in Figure 6 with tile upward fluxes ill Figure 7 reveals that, below 225 km, where transport is inhibited, the electron flux is isotropic for energies less than 300 eV. At 326 kin, tile upward (escape) flux is a factor of 2 larger than the downward flux at low energies and orders of magnitude larger at intermediate energies. 4.
3371 A
EMISSION
I0.343
RATE
REFEP_ENCES Ajetlo, J. M., and D. E. Shemansky, A reexamination of important N,. cross sections by electron impact with application to the dayglow: Tile Lyman-BirgeHopfield band system and N I (119.99 nm), J. Geophys. Res., 90, (A10), 1985. Banks, P. M. and C. R. Chappell, and A. F. Nagy, A new model for the interaction of auroral electrons with the atmosphere:
spectral
degradation,
backscat-
ter, optical emission, and ionization, J. Geophys. Res., 79, 1459, 1974. Borst, W. L., and E. C. Zipf, Cross section for electron-
CONCLUSIONS
We have developed an efficient two-stream auroral electron model that incorporates the concept of average energy loss. This model produces integrated emission rates that are in excellent agreement with the more sophisticated multi-stream model of Strickland et al. [1983] but is in disagreement with tile model of Rees and Lummerzheim [1989] with regards to tile energy dependence of the N_. 3371 A second positive emission rate. Our calculations give a value of 35 eV for tile average energy lost per electron-ion pair produced independent of primary electron energy and we have explained this behavior in terms of tile variation ill the energy of the secondary electrons. We find that more than 30% of the initial energy flux is stored initially as ionization energy of N + while about 20% goes into excited states of N_. while only 15% is backscattered out of tile thermosphere. All other processes are minor except at low incident energies where 20% of the energy is stored in atomic oxygen ions.
impact excitation of the (0,0) first negative band of N + from threshold to 3 keV, Phys. Rev. A, 1, 834, 1970. Brook, E., M. F. A. Harrison, and A. C. H. Smith, Measurements of the electron impact ionisation cross sections of He, C, O and N atoms, J. Phys. B, II, 3115, 1978. Cartwright, D. C., W. R. Peadleton, and L. D. Weaver, Auroral emission of the N_+ Meinet bands, J. Geophys. Res., 80,651, 1975. Cartwright, D. C., A. Chutjian, S. Ttajmar, and W. Williams, Electron impact excitation of the electro,tic states of N.,, I, Differential cross sections at incident energies from 10 to 50 eV, Phys. Rev. A, I6, 1013, 1977a. Cartwright, D. C., S. Trajmar, A. Chutjian, and W. Williams, Electron impact excitation of the electronic states of N.,, II, Integral cross sections at incident
energies from 10 to 50 eV, Phys. Rev. A, 16, 1041, Acknou, ledgments. This work was supported by NSF grants 1977b. ATM-8713693, ATM-8716036, ATM-8907808. and ATM-8714461 ; Daniell, R. E., and D. J. Strickland, Dependence of the and NASA grants NAGW-922, and NAGW-996 at The University of Alabama in Huntsville. auroral middle UV emissions on the incident electron The Editor thanks R. E. Daniell and M. H. Rees for their spectrum and neutral atmosphere, J. Geophys. Res., assistance in evaluating this paper gI, 321, 1986. Erdman, P. W., and E. C. Zipf, Dissociative excitation I0 l of the NI(OS) state by electron impact on N,.: Excitation function and quenching, J. Geophys. Res., 91, 1986. I01
7
Fox, J. L., and G. A. Victor, Electron energy deposition in N2 gas, Planet. Space Sci., 36,326, 1988. Garstang, R. H., Multiplet intensities for lines 4S-'-D of SII, OII and NI, Astrophys. J., 115, 506, 1952. Green, A. E. S. and R. S. Stolarski, Analytic nmdels of
I0 7
% o
i0I
X J
loSi
I0 4
I0 s
&
I0 o
l
l
Illlll
l
I0 !
I
I
Iml,ll
,
l
lO 1
I
l
tlllJ
I
I0 $
I
I
l
ill
I0 4
ENERGY(iV) Fig. 7. Upward moving electron flux spectra for the 5 keV Gaussian incident flux shown in Figure 6.
electron impact excitation cross sections, J. Atmos. Terr. Phys., 3_, 1703, 1972. Gulcicek, E. E., and J. P. Doering, Absolute differential and integral electron excitation cross sections of the atomic oxygen 3p and oP states at 30 eV, J. Geophys. Res., g2(A4), 3445-3448, 1988. Henry, R. J. W., P. G. Burke and A. L. Sinfailam, Scattering of electrons by C, N, O, N +, O + and O ++, Phys. Rev., 178 218, 1969. Jackman, C. H., R. M. Garvey, and A. E. S. Green, Electron impact on atmospheric gases, I. Updated cross sections, J. Geophys. Res., 8_, 5081-5090, 1977.
I0.344
RICHARDS ANDTORR:AURORAL 3371A EMISSION RATE
Kieffer,L. J., andG. ization diatomic
cross
section
molecules:
H. Dunn, Electron impact iondata for atoms, atomic ions and I. experimental
data,
Rev.
Mod.
phy,., as, l, 1966.
ondary electrons in aurora, Planet. Space Sci., 17, 1997, 1969. Richards, P. G., and D. G. Tort, An investigation of the consistency of the ionospheric measurements of the
Lee, J. S., J. P. Doering, T. A. Potemra, and L. H. Brace, Measurements of the ambient photoelectron spectrum from Atmosphere Explorer, I, AE-E mea-
photoelectron flux and solar E2zV flux, d. Geophys. Res., 89, 5625, 1984. Richards, P. G., and D. G. Tort, The altitude variation
surements below 300 km during solar ufinimunl conditions, Planet. Space 5cz., _8, 947, 1980. Liliana, D, and J. A. D. Stockdah, Dissociative ioniza-
of the ionospheric photoelectron flux: a comparison of theory and measurement, J. Geophys. Res., 90, 2877, 1985a. Richards, P. G. and D. G. Tort, On the production of N + by energetic electrons, Y. Geophys. Res. 90, 9917, 1985b. Richards, P. G., and D. G. Tort, Ratio of photoelectron to EUV ionization rates for aeronomic studies
tion of molecules by electron impact, II, Kinetic energy and angular distributions of N + and N ++ ions from N_,, J. Chem. Phys., 63, 3898-3908, 1975. Lummerzheim, D., M. H. Rees, and H. R. Anderson, Angular dependent transport of auroral electrons in the upper atmosphere, Planet. Space Sci., 37, 109, 1989. Mahmood, I, and Walter L. Borst, Electron excitation of the (0,0) second positive band of nitrogen from threshold to 1000 eV', d. Chem. Phys., ai, 1115, 1974. Nagy, A. F., and P. M. Banks, the ionosphere, d. Geophys. Opal, C. B., W. K. Peterson, surements of secondary-electron
Photoelectron fluxes in Res., 75, 6260, 1970. and E. C. Beaty, Measpectra produced by
J. Geophys. J2es., 93, 4060, 1988. Sharp, W. E., M. H. Rees, and A. I. Stewart, Coordinated rocket and satellite measurements of an auroral event, 2, The rocket observations and analysis, d. Geophys. Res., 8_, 1977, 1979. Shepherd, G. G., J. D. Winningham, F. E. Bunn, and F. W. Thirkettle, An empirical determination of the production efficiency for auroral 6300- _ enfission by energetic electrons, J. Geophys. Res., 85,715, 1980. Solomon, S. C., Auroral excitation of the N,. 2P(0,0)
electron impact ionization of a number of simple gases, J. Chem. Phys., 55, 4100, 1971. Pitchford, L. C., and A. V. Phelps, Comparative calculations of electron swarm properties in N,. at moder-
and VK(0,9) bands, J. Geophys. Res., 95, 17215, 1989. Solomon, S. C., P. B. Hays, and V. J. Abreu, The auroral 6300 _, emission: Observations and modeUng,
ate E/N values, Phys. Rev. A _5, 540, 1982. Porter, H. S., C. H. Jackman, and A. E. S. Green, Efflciencies for production of atomic nitrogen and oxygen by relativisitic proton impact in air, Y. Chem. Phys.,
J. Geophys. Res., 93(A9), 9867, 1988. Stone, E.J., and E.C. Zipf, Electron-impact excitation of the 3S_ and 5S° states of atomic oxygen, J. Chem.
65, 154-167, 1976. Rapp, D., and P. Englander-Golden, tions for ionization and attachment tron impact I, Positive ionization..L
Total cross secin gases by elecChem. Phys.,
43, 1464, 1965. Rees, M. H., Auroral ionization and excitation dent energetic electrons, Planet. Space Sci., 1963. Rees, M. H. ,rod R. A. Jones, Time dependent of the aurora, II, Spectroscopic morphology,
by inci11, 1209, studies Planet.
Phys., 60, 4237, 1974. Stricktand, D. J., J. R. Jasperse,
and J. A. Whalen,
De-
pendence of auroral FUV emissions on the incident electron spectrum and neutral atmosphere, J. Geophys. Swartz,
Res., 88, 8051, 1983. W. E., Optimization
ergy degradation
calculations,
of energetic d. Geophys.
electron Res.,
en90,
6587, 1985. Trajmar, S., D. F. Register, and A. Chutjian, Electron scattering by molecules, II, ExperimentM methods and data, Phys. Rep., 97, 219, 1983. Vallance Jones, A., A model for the excitation of electron .arora and some applications, Can. J. Phys.,
Space Sci., 21, 1213, 1973. Rees, M. H., and D. Luckey, Auroral electron energy 53, 2276, 1975. derived from the ratio of spectroscopic emissions, 1, Zipf, E. C., and P. W. Erdman, Electron impact exciModel computations, J. C,eophys. Res., 79, 5181, tation of atonfic oxygen: Revised cross sections, J. 1974. Geopays. Res., 90, 11087, 1985. Rees, M. H., and D. Lunuuerzheim, Characteristics of auroral electron precipitation derived from optical spectroscopy, J. Geophys. Res., 95, 6799, 1989. Rees, M. H., D. Lummerzheim, R. G. Roble, J. D. WinP. G. Richards and D. G. Tort, University of Alabama, Research Institute C-10, Huntsville, AL 35899. ningham, J. D. Craven, and L. A. Frank, Auroral Energy deposition rate, characteristic electron energy and ionospheric parameters derived from Dynamics Explorer 1 images, J. Geophys. Rees, M. H., A. I. Stewart, and
Res., 93, 12841, 1988. J. C. G. Walker, See-
(Recieved October accepted November
18, 1989; 28, 1989.)
G_:,G,',_. ;,.. _,,.GE
JOURNAL
OF
GEOPHYS[CAL
The Dependence
RESEARCH.
of Modeled
VOL.
Auroral
Emissions G.
Space
0I
S_ iem'e
A.
Luboratorv,
95.
1356
GERMANY
PAGES
M.
Space
R.
7725-7733.
Lyman
N2
Neutral
aND
Mar,dufll
A6.
and
on the
NASA
NO.
JUNE
IS
I. 1990
Birge
Hopfield
Atmosphere TORR
Fl&,ht Center,
Huntsvdle.
Alabama
P. G. RICHARDSAND D. G. TORR of Alabama
University
m Huntsville,
Huntsvdle,
Alabama
Images of the enure auroral oval at carefully selected wavelengths contain information on the global energy influx due to energetic panicles and some information on the characteristic energy of the precipitating panicles In this paper we investigate the sensitivity of selected auroral emissions to changes in the neutral atmosphere. In parlicular, we examine the behavmr o( Ol 1356 A and two Lyman Birge Hopfield (LBH) bands and their ratios tt'_ each other with changing atmosphenc composmon. The two LBH bands are selected so that one lies in the region ol slrong O2 ab_,orptu)n it 46..1 A) and one lies at a wavelength where Oz absorption is effectively negligible ( 1838 A ). We find that for annc_pated average uncertainties in the neutral atmosphere (factor of 2 at auroral altitudes), the resultant change m the modeled intensities _s comparable to or less than the uncertainty in the neutral atmosphere. The smallest vanatmns, for example, are R)r 1 1838 (approximately 10 to 20%) while the largest varmtmn Is seen m the t)l 1356 A ,emission which is linear with IO] to within 20%. We have also investigated the dependence ol these intensities, and their ratios, to much larger changes in the composition tie.. [OI/IN:I) xuch as m_ght be encountered m large magneuc storms, or over seasonal or solar cycle extremes. We find that the variatmn in the I 1356d 1838 ratio over the equivalent of a solar cycle is less than 50%. The ',ummer-to-wmter changes are approximately a factor of 2, The I 1356/I 1838 ratio is a very. sensitive indicator of the characteristic energy, showing a change of 13 over the energy range 200 eV to l0 keV The corresponding change in the LBH long-to-short wavelength ratio is much less (about a factor of 3). However. the latter is insensitive to changes in the neutral atmosphere ! :i bt_er :llliludc;_ilh the renullin_ hi_zher emission
41 and beyond
r
.
°° _
qucnchin,.: t_iII__iII_ilh
14[¢.
l, li,
ti .I } I
I •
•
dominalcs
-t _ " °
{.1. •"" • "
• •
• :
•
iii
lhe _-
,mallcr ,talc hci,_'hc m
l
and
of alomic irl
Plalc
el bc.d time. This plalc
,how,, the exlcnl Io _liich ,,ea,,onaJhcmi,,pheric _l_,,mmelrles _rc rcduu'ed _hen
lhe dala arc pb[Icd
in lhi_ formal.
PI.=I¢ ] I-he7320-.-%.,. ,tmeem',,,i nrale ph_n..'`.:m_-'_:.i_p_ik_)_._h_averasa_un_`_n_ahi_ud_`i_ud_.a ndloculllilie _[,,il_lludcl or llft ('T Th,: upper pbl ,,h_w,, lh_ peak volume ¢111is_.iolIr;JlC only a', a luncllon ul l,,lliludc ,Ind local llme. l-he ,.ollJlll¢ _'mi,.,41m roll,..' i,, _u'i ;i b,-" ,_.,ik." The result,. ,ire onl,, _.,ilid V.ilhin lh¢ L _ 4 bound-',ri_.", ,h{_,._.n in Fi_zurc 5.
Pl,llC /UIlllh
2
Fhc ,InL'l'..'
7
___}-
FIle
_
_,t_lUnlC
"+_ilUIlIC
CI1)l_.xl()rl
rJIC (phc)ldrl_
¢rtl
_ _-' I ,11 the peJk
_)1 the [_t'_cr _
;1 IunctlOll
o| J]tilud¢.
[aliludc.
_ll_d ,_t}lJr
.+.'rlllx,,It)F] I',LIC Is ++T+l,I +t+_ xL'+IIC
600 +
550
.... ++"++':'+"FAG_
: :+ 7] _:;-,,,+-;,+'+_'+;'-
IS
C_ #+'c,C?P, QUALITY 500 I
450 I 400 _--
a 10 "_
10 0 Production
Fi-.6.
_.|idday.
,,1) _'._rthcrn
1 d-a
hcm_,,phcr,:
tudeproducti(m h+r 4() \.
12 [.T.
101 Rate
ndh_.,',raleslorO'l'P'_:l(ziJnd(l_)',t_uthernhcnli',ph \
(-,IF
10 2
O+ (2P) (cm ",1Im¢ "i )
CrCtt_r4F'_S.
[.T. ",,: 2H':( 30% FOR 130 < X < 200 nm
,,, 3 nm FWHM BLOCKING
< 10-3%
APPLICATIONS: SPECTRAL ISOLATION EMISSION FEATURES: HLy_
121.6
nm
OI
130.4
nm
OI
135.6
nm
AND OTHER FEATURES
OF THE TERRESTRIAL
FILTERS
FOR
CONCEPT
FOR THE DEVELOPMENT PERFORMANCE FILTERS
LACK OF LOW ABSORPTION
PROBLEMS:
VUV FOR ALL-DIELECTRIC
=_
ALTERNATIVES:
POOR TRANSMISSION,
REFLECTIVE AFFECTED
A MEASURE
TRANSMISSION
AND BLOCKING
COATINGS
HAVE A
PASSBAND
OF SUCCESS
PREVIOUSLY
FILTERS
EFFECTS
REFLECTIVE BROAD
IN THE
ARE NOT AS SEVERELY
BY ABSORPTION
RELATIVELY
FILM MATERIALS
BANDWIDTH
COATINGS
BUT TYPICAL
OF HIGH
HAS BEEN ACHIEVED
BY COMBINING
SEVERAL
REFLECTORS
IN TANDEM
£J&ELOJ£J
THE RATIO OF IN-BAND REFLECTIVITY
(RIN/RouT)N
=_
IMPROVED
TO OUT-OF-BAND
(R) INCREASES
AS
WHEREN = NUMBER OF REFLECTORS
BANDWIDTH
AND OUT-OF-BAND
BLOCKING
Our Objective Available VUV
and Commercially Narrowband Filters
T(X)
=@ ,J
T>35Z
4O 30
Bandwidth
20
i0
< 5 nm
T, (nm)
>
15
150
nm
160
I,,,,,4
CO 0"_
c5
¢',q
II
I!
Z
Z
r.O 0%
Z
\
\
0 ,
\ 0% •
0 ° e"'-I
c5
\ ,
\ O_ 0%
\ i
20 nm. t
Blocking
for terestrial
in the
FWHM
design
has relatively
useful
than
with
available
typical
centered
Lyman-a
= 9 nm.
filter
not very
the
hydrogen
- 135 nm; close filter
filters
and 25%
reported
centered
commercially
of transmittance
of the
20%
MalherbO
are
120 nm to 160 nm have
transmittance
10-s%.
that
much
of 25%, smaller
and experimentally
of a surface
plasma
wave
A variable from
7 nm
bandwidth
to 20 nm with
was centered windows
longer
Narrowband
some
nm
1° are
e-9.
smaller
available
band
and
Taking narrow
and
spectrum.
higher
waves
of the
metal
of vacuum
ultraviolet
high reflectivity
the
shape
reflection
can be achieved
The
filter
from
pass
that
for some
25%
the
by
developed centered
transmittance
at in
applications.
curve
a more
120 nm
reported
we have
greater
transmittance
applications
also
than
filters,
from
than
10 nm have
is similar
rectangular
shape
to that for the
is required.
as are
are
that
the
the VUV
available
certainly
and
in order
bandwidths
suffered
(VUV)
greater
all-dielectric
of the
For most
such
a measure
had
were
filters
transmittance were
it is clear
for this
in series
of some
with bandwidths
for metal-dielectric
2 achieved
reflectors
those
above
filters
and
filters,
peak
listed
broadband
transmittance
reasons
to those
blocking
filters
filters,
range
insumcient
broadband The
all-dielectric
provided
account,
for all-dielectric
more
Since
all this into
al
20% to 40%, respectively.
wavelength
bandwidths
with
filters t,4-s,l*.
VUV
Hunted
properties
5 nm
VUV
low transmittance
ultraviolet
FWHM
region
of Fabry-Perot-type pass
The than
wavelength
Currently relatively
optical
as low as 135 nm.
longer
from
by Elias _et
region.
for the vacuum
similar
authors
wavelengths the
reported
transmittance
wavelength
filters
with
other
recently
peak
filter
at 17fi rim, and as in the case of other
in the
to 230
transmission
in the
a lack
coupling
spectral visible
range
and infrared
of low absorbing
of the
incident
lacks
light
high parts
film materials into
plasma
quality of the in the surface
filters.
of success
in solving
to achieve
desired
polarizers
and
within
passband,
the
2
this
problem
spectral
analyzers. then
by combining
performance The
idea
the in-band
for the
is that
two or design
if sufficiently
exponential
loss of
reflectivity
with
out-of-band
additional
exponential
the
ratio
of in-band
eg.
90%
and
reflectivity
10%,
paper
reflection
into
desired ple,
The multilayer of several with
nm)
of 39.3%
next
centered
section
options
was
A multiple
of this
which
narrowband
A summary
In this
paper
called
including
is given
the
the
rl filters
filters thin
in Section
are
a throughput
is better
design
and
in Section and
in-band
so on.
and
broad-
combined and
the
For examcentral
wavelengths performance
of 11 nm and than
of 10,
at the
the
is of a
throughput
3x10-s%.
of quarterwave
film deposition,
the
then
of out-of-band
are presented
V.
reduce
applications.
a bandwidth
13. The
order
wavelengths
to illustrate
theory
be the
filters
net
to be viable,
of narrow
broadband and
to the
to 1%, and
for out-of-band
designed case
then
These
Blocking
blocking
reviews
broadband
techniques
was
should
fabrication
of 3.2 nm
Out-of-band
we have
and
and
approach
is reduced
and
blocking
achieved.
reflector
at 175 nm.
realized.
reflectivity
excellent
a bandwidth
54% was
experimental
preparation.
to provide
surface
90% reflectance.
with
10-4%. filter
desired
compared
for the
for example,
design
filtering
better
than
successful
narrowband
(135.6
greater
the
for both
wavelength
broadband
we report
shape
narrowband
than
out-of-band
the
at each
reflections,
the
reflector
spectral
Two
insignificant
However,
reflectivity
whereas
with
becomes
reduction.
respectively.
filters
a multiple
surfaces
reflectance
to out-of-band
to 81%,
In this band
reflective
(QW), spectral III.
substrate
and
other
performance
Section
IV deals
handling
and
II.
ABSORBING
A.
Reflectance
The
intensity
incident
MULTILAYERS
Transmittance
reflection
on a multilayer
and stack
and
Absorptance
transmission are given
coefficients
for a plane
electromagnetic
wave
by 14
(Mli + Ml:Ts)_o - (M_I + M227s) r = (MtI + M127s)7o + (M31 + M_27s)'
(1)
2_ t = (MH + M_27s)7o + (M2_ + M:27s)' where
,10 and
substrate,
7s, which
are
are the
defined
for s polarization,
effective
optical
functions
(2)
of the incident
medium
and
the
as
and
7o ----no ¢os8o,
(3)
7s = as ¢osOs
(4)
as cos_o
7o--
,
(5)
,
(0)
no
7s --
cos_s ns
for p and
polarization. the
substrate indices
that
the
therefore characteristic layers
e0 and
are measured
refractive both
Angles,
of the
substrate
relative
incident and
real optical
functions.
matrix
M which
e,, for light
to the normal
medium
incident The
propagation
and
medium terms
is defined
the have
through
the
to the film plane,
substrate, negligible
respectively. extinction
Mu, i, j = 1, 2 are the elements as the
product
of the
MI = (cos6, i7t sin 6z
_sin6,) cos 6t
"
matrices
incident
medium
n0 and
ns are the
It is assumed coefficients
and
of the
multilayer
of the
individual
Mr, where (7)
The
phase
thicknesses
of the
films
6 are
given
by
271"
6 = -_--Ntdl cos O.
(8)
,4O
where
_0 is the
referred
vacuum
to as "optical
wavelength constant")
of the incident of the
l-th
light.
layer
defined
Nt = nt(1 + iKt) = nz + inter
with the
,q = kdm. physical
The
where
and
thickness,
reflection
¢,
where
and
reflectance
et
and
are
nt is the
and
Oa is the
transmission
the
refractive
phase
R, transmittance
complex
Quarterwave
Multilayer stack
are
Tuned
stacks
usually
as
(9)
kz is the of the
r and
extinction
light
within
t are complex
coefficient, the
l-th
numbers
dt
is
film.
of the
form
t = Itl_'_',
(11)
on
reflection
absorptance
and
transmission.
A of a multilayer
are
The given
intensity
by
R = rr',
(12)
T = rl-s-tt', 7/0
(13)
1-(R+T).
(14)
Multilayers
formed
referred
(usually
(lO)
changes
T, and
function
, = I,.1_'_,
A=
B.
angle
optical
= nl + ikh
index,
coefficients
Nt is the
by high
to as tuned
and
low index
filters
or tuned
materials
alternating
multilayers.
The
throughout basic
design
a of
sucha multilayer stack is given in either symmetric [(HL),H] Symmetric of the
[(LH)pL]
basic
index
design,
medium
and
[(LH)p]
L designate
respectively,
of a stack
optical
and p
are determined
tuned
multilayers
thicknesses
is the number
by the refractive
represent of high
of (HI,) indices
form
of the
another
and
pairs.
[(HL)p]. form
low refractive
The
form
substrate
and
the
and incident
1'.
If the
optical
and
its refractive
film
is referred
on the fact interfaces
thickness index)
of a film (defined is equal
for an incident
will all be in phase,
with
shown
that
absorbing
following
to one
to as a quarterwave
that
We have stack
asymmetric
tt
film materials
symmetry
the
and
or asymmetric
quarter
(QW)
so the
at zero
of some
reference
beams
obtained
of incidence,
is achieved
,x, then
multilayers
reflected
of a film
from
this
are based the
various
is a maximum.
the
when
thickness
wavelength
of QW
A0 = A, the
reflectance
angle
of a physical
. Applications
wavelength
film materials
condition
as a product
the
maximum number
reflectance of (HL)
pairs
of a QW p
satisfies
1°
( (
R
_H
-- t_L
))'
p = po = "_ tan-' i7 In"_L
'
(15)
where kH
_H= --,
(16)
nH
and kL
XL --
•
(17)
71L
nH and
nL are refractive
corresponding pairs
for which
extinction both
the
indices
of high
coefficients. absorptance
and Values
and
low index
film materials,
of v > p0 correspond
reflectance
of the
stack
and
ku and
to numbers are
constant
kL are of (HL)
and
sum
to unity
i.e. R+A---*
resulting
in a value
An
alternative
films
might
is the
ratio
theory wave
for the
stack
of the
in terms
of the maximum
it is the formed
ratio
QW
of the and
of the
by the
a symmetrical
transmittance
description
be given
standing
minimum
maximum
interference
the
R is the
maximum
reflectance
absorbing.
intensity
cannot
ultimate
stack
an exact
(20)
provides
able
with
an absorbing
the
stack.
However,
represent
reflectance,
stack
and
with
absorbing
18. The
SWR
in general
in a standing
electric
field
reflected
wave.
amplitude
In multilayer in the
electromagnetic
standing
waves.
For
QW
form
k_H_+ n_l.f
2_rn0
Eq.(20)
saturated
[(HL)pH]
stack
referred
is given
value
maximum
the
obtained
therefore
by ts
(20)
to as the
with
optical
for
the
7
the
Koppelmann
limit.
forming
the
Thus,
stack
maximum angle
Therefore,
approximations of a QW
maximum
properties
for zero
for 00 _ 0°.
some
reflectance
between
RK is derived
reflectance
and
are
R --, 1 as p--, oo.
relationship and
level
kL nL21
was derived
of the
simple
In addition, ultimate
1
SWR
R -, RK as p -_ oo, if film materials
calculation
the
--
(19) The
of the
is usually
that
an extremely
the
ratio
stack
1+v_ = -1-v_
film materials
be emphasized
as an estimate.
(SWR)
of the stack.
of a QW
For non-absorbing
replace
wave
of the incident
reflectance
of a QW
It should
of a QW
amplitudes
_
the
to zero.
stack lr
reflectance
RE, the
equal
properties
to minimum
RK
where
(18)
essentially
optical
SWR where
1,
of film
stack.
it
Equation
reflectance
obtain-
materials
forming
reflectance
must
of incidence
and
we shall
is and
reference
be treated it does the
not
exactly
calculated reflectance[Eq. (12)] as the
"Koppelmann
limit"
for a QW
stack
at any
angle
of incidence.
The
Koppelmann
limit
theoretical
and
of the
thicknesses
film
materials
BaF_
than
which
and
LaFs
are
They
both
below
200
techniques
for the
wavelength
range.
optical
thickness
film material VUV
all multilayer index H/L
< 1 have
with
have
values
< 1 instead
lower
and
Tuned
The
definition
of the
quarterwave
stacks.
thickness
is 100 times and
of above
QW
therefore
Since greater higher
index
thicknesses
of an
for which
order
than
low index
that
reflection
and
referenced to the
stacks H/L
VUV
with
the
= 1. MgFu entire
film
material
for
coefficient
of the
high
stacks
with
of MgF3, than
at
10 -2 for
of 10 -4 for almost
the extinction than
identified
applicable
multilayer
stacks
as the
materials greater
are not
of the
used
the
high
of the extinction
mentioned
is to utilize
coefficient
it is exclusively
film
coefficient
limit
of standard
in this paper.
index
extinction
problem
for
refinement
in the
values
of
reflectance.
high
most
of a number
numerical
amplitude
formulas
Koppelmann
extinction
LaFs)
absorption
assuming
that
to this
presented
(BaF_
means
of the
region 22, and
authors,
VUV
subject
involve
field
maximum
of the
the
electric
approximating the
been
approaches
the
available
This
it have
Some
Other
provide
only
of the
Thirdwave
optical
the
H/L
C.
of the
would
approach
values
designs
materials
derived
nm.
Our
wavelength
t°-2t.
to reduce
improvement
ratio
has
studies
10 -8,
pair
wavelengths
to extend
side of incidence.
(HL)
time 22.
how
in order
to the
lower
optimum
this
experimental
close
coefficient
and
stacks
the with
H/L
= 1.
Multilayers
thirdwave
equal
(TW)
It is defined to one
third
multilayers
here
as a tuned
of some
is not
standardized
multilayer
reference
which
wavelength,
as in the
case
has one material while
the
optical
thickness
of the
other
material
is equal
to one
nLdL
Since
kH/k
BaF:,
)___100 for presently
L
and
MgF2),
the
choice
available of which
sixth
=
high
of a reference
wavelength,
i.e.
--. 3
and
material
low index
should
materials
in the
have
the
optical
an
(HL)
pair
VUV
(LaF3,
thickness
of ;_r/6
is obvious.
The
two
H and
thickness
equal
Similarly,
an (HL)
which
again
principle
pair
D.
which
are discussed
at
has
phase
an overall
of the
next
optical
of the
TW
with
thickness
wavelength
concept
in the
phase
thickness
a reference
The
form
to a total
multilayer
to a total
stack.
multilayer
corresponds
of a TW
reflectance
of a QW
in a QW
which
corresponds
to that
multilayers
total
of the
thickness
pair
equal
of a TW multilayer
leads
pair
equal to r.
tuned
optical 6 = 7r. to At/2
Thus,
the
multilayer
to other
is
kinds
of
section.
II Multilayers
We define ,_,/2.
to ,L/2
of a high
similar
L films
a N multilayer
Optical
thicknesses
as one whose of individual
basic
H and
(HL)
L films
pair
has
a total
forming
a pair
optical satisfy
thickness the
of
following
condition
H + L = 5-' where pair
>,, is the is equal
special in phase,
cases
reference
to r,
i.e.
wavelength 6H + 6L = r.
of 17 multilayers.
while
of the
in a thirdwave
multilayer.
Thus,
other
The
quarterwave
In a quarterwave and
(2a)
stack
17 multilayers 9
total
and
light light
phase
thirdwave
thickness stacks
of the are
the is
reflected
from
all interfaces
reflected
from
each
(HL)
pair
is in phase.
Obviously,
in the
and
visible
than
other
do not lower
a 11 multilayer
of incidence.
It shows
stacks
plotted
(I-I/L).
The
against
filter
= 1/4.
This
The
55-layer
has
optical
ratio the
maximum
reflectance
zero
of incidence,
in the
maximum
VUV
smaller
the
where
of optical
as the
with The
reflectance
of H = ;_,/8 of 93.6% stacks
and
for the with
the
over what
35-layer
H/L
the
for zero
55-, and
LaF3
H/L
with
The
thicknesses
and
which
Fig.
< 1 provide
rl
as the low index
of optical
= 1/3
From
35-layer
is RK = 90.8%.
ratio
ratio
angle
film materials
of H = ),,/10
The
can be achieved
to L can provide
low index
high,
for H/L
II stack.
99-,
limit
thicknesses
L = 3,_,/8.
ratio
as the
when
of 95.3%
layers
film materials
extended
and
Koppelmann
to the optical
fewer
stack.
of high
of 96.5%
index
of H relative
for the
MgF2
(available
with
high
can be easily
thicknesses
reflectance
corresponds
of the
materials
reflectance
thickness
calculated
substrate.
maximum
higher
limit
is 145 nm,
film
low-absorbing
reflectance
reflectances
ratio
low-absorbing
provide
Koppelmann
maximum
reflectance
with
physical
higher
maximum
thicknesses
angle
with
how
silica
has the
H/L
in the
wavelength
fused
stacks
of spectrum)
therefore
the
reference and
99-layer
and
1 illustrates
materials,
parts
However,
absorptance
Figure
the
infrared
rl stacks.
exist,
quarterwave
L = 4a,/10.
corresponds
= 1/2
provides
1, it follows
a significant
to the
that
at
improvement
QW
stacks
for which
and
bandwidths
H/L
=
1.
Shown measured 55-,
in Figures
and
35-layer material
as the
for the
3 are
at half of reflectance
low index LaF3
2 and
QW
17 stacks, (H/L).
high index stack
maximum
nlaxinlum) plotted
The
material,
is R_- = 89.5%
respectively,
against
reference and
fused
reflectances
the
ratio
wavelength silica
0o = 450 at 10
calculated of optical is 135.6
as the
angle
nm,
(full
width
at 00 = 450 for the thicknesses with
substrate.
The
of incidence.
The
MgF2
of high
and
as the
low,
Koppelmann 99-and
99-,
limit
55-layer
17
multilayers the
(Fig.
ratio
high
and
2) have
a maximum
of optical
thicknesses
low index
film materials
reflectance
is H/L
= 1/3.
L
The
35-layer
optical
_ stack
thicknesses
(Fig.
1) has
for this
of 93.0% This
92.7%
corresponds
respectively,
to optical
when
thicknesses
of
3,_ 8
_
m
a maximum
H to L ratio
and
reflectance
of the
of 91.4%
17 multilayer
for H/L
are given
by
for the
QW
= 1/2.
The
3
The
lowest
number
of films
saturation the
decrease
is decreased
the
case)
within
the
level
for the
QW
From 135.6
nm,
stack
with
QW
Figs. the this
occurs
SWR
decreases
with
physical
thickness
of the
high
index
is largest
for the
QW
stack.
multilayer stacks the
stack
2 and 17 stack ratio
reflectance
99 to 35.
be expected
nm for the
maximum from
level of the
multilayers
should
of the
is achieved bandwidth
and
6.9 nm
3, it follows with has
H/L
optical
This
an increase
with
fewer
decreases for the
stack
for the
= 1/4
seems
thicknesses
design
of a narrowband
to be the
A nHdH
=m
10
4A L =
11
--.
10
(Fig.
by
most
feasible
since
the
Of all particular
SWR
saturation
to other
of of the
= 1/5
the
in this
the
compared
when
absorption.
(LaF8
Therefore,
H/L
expected
multilayer
material
a decrease
with
given
is certainly
of the
layers
with
that
nLd
result
stack
ratio
17 stacks. H/L.
As
It is 17
3).
reflector choice.
centered The
at
35-layer
Calculated values of the maximum reflectance
R_,_
= 7.2 nm.
Figure
4 shows
calculated
fused
as the
substrate
silica
135.6 nm is 88.3% bandwidth
while
of 7.2 nm
Figure
5 shows
a 29-layer
17 stack
The
H/L
ratio
the
material.
the
theory
agrees
the
measured
with
measured
with
BaF_
= 1/3,
and
and The
= 88.4%
measured
predicts
the
values
reflectance predictions.
and
calculated
reflectance
optical
index
material
thicknesses
are
silica
FWHM
stack
with
reflectance
of 88.4%.
fused
and
peak
The
at 45 ° angle
and
given
nm of this
of the
peak
theoretical
high
135.6
reflectance
the
as the
at
at
measured
of incidence as the
for
substrate.
by
nH d/_ = -8
rtLd L -
The
measured
nm.
The
E.
theory
Higher
The The
reflectance
first
width
predicts
Order
order of the
film inaterials
maximum 86.9%
at
)_, = 135.6
maximum
reflectance
II Multilayer
QW high
is given
stacks
8 nm
is 86.0%
and
with
6.8 nm
bandwidth
of 7.2
bandwidth.
Stacks
have
reflection
wider zone
high
reflectance
(A,_)H.R. of a QW
zone
than
multilayer
other
rl multilayers.
with
non-absorbing
by 2a
(A)_)H'R" = 2(m-- 1 1)+ 1 4,_,_ r sin_ 1 (n__H--nL) +nL
where
m is the
reflection gives indices
zone
a maximum nH and
order
of H multilayer.
is smaller width nL.
than
that
for a high Thus,
an
For absorbing calculated reflectance
alternative
film materials
using zone
Equation
obtainable
approach 12
(24)
for
(24).
the
width
Thus,
for materials the
design
of the
Equation with
of the
high (24)
refractive
narrowband
reflectors of the
is to utilize
order
of a II stack
from
,r -. ma'. The
order
of a II stack
low index of the the
fihn
stack.
second
used
as the
of the
the
total
QW
high
index
stack
in the theoretical
substrate
contaminations,
(Figs.
4 and
in the
QW
theoretical
stack
are
in increased
and
fused
experiment
while ,nay
calculation
the
film inhomogeneity. obtained
for the
second
more
affected
order
results QW
by the
of both
high
and
therefore
value
and
may
factors
reflectance
The
indicate neglected
Discrepancies
scattering,
for the
is
value
of physical
between
of
BaF3
calculated
is 69.9%.
volume
better
reflectance
of incidence.
presence
is much This
lower
obtained
agreement
physical
13
thickness
The
stack.
calculation.
the
by the
surface
pair
when
as the substrate.
as the
of an (HL) by A,/2
and
measured
an increase
is increased
at a 450 angle
be explained
such
However,
thickness
experimentally
nm
silica
m.
phase
physical
and
at 135.6
order
pair
absorptance
calculated
is 83.1%
experimentally
5) than
Increased
centered
and
a total
by unity.
material
and
higher
of an (HL)
the
reflectance
theory
with
thickness
results 6 shows
order
II stacks
1 to, say m, changes
is increased
Figure
and
or other
optical
neglected
prediction
QW from
materials
maximum
between
the
factors film and
the theoretical first
order
that
thicker
in the
filters films
multilayer
III.
MULTIPLE
A.
REFLECTION
Narrowband
Reflection
filters
shown
wavelength
of 86.0%
the
wavelength
shorter
wavelengths.
The
zone
can
upon
which
of four
and
light
in Figures
88.3%, region
outside
is incident
maximum
filters
of the
blocking
for wavelengths
can
be combined.
However,
the
combination.
The
thick
is 39.3%
than
10-_%
MgF2
of shorter
B.
The Ideally,
window wavelengths
for longer
wavelengths outside
adding
maximum
with
the
for longer is placed may
the
pass
filters
throughput
The
in
of 10% for the longer
or more
of the pass
reflection
transmissions
at the blocking
than
zone
filters
of combinations
is required,
and
than
the
6-filter The
0.07% of the
central
wavelength
for shorter
10-2%.
will reduce
of 3.2 nm.
be less than
two
overall
of the
entrance
high reflectance
7 and 8, respectively.
bandwidth
at the
at the central
and the bandwidth
from
is better
more
better
zone
combination
of 4.3 nm.
relatively
of the order
"pass"
in Figures
reflectances
have
reflections
4-filter
bandwidth
than
better
and
the
both
of 450 . The
are shown
of the
measured
reflectance
the filter's
at an angle
better
wavelength
0.7%
and
They
of multiple
throughput
nm is 53.7%
5 have
respectively.
by means
and six 29-layer
4 and
and an average
reflectance
be reduced
The 135.6
FILTERS
wavelengths
If further then overall
for shorter combination
6 or more
filters
transmittance at the
outside
the
pass
wavelengths. than
is
improvement
combination
blocking
,_ =
the
of
central zone
is
If a 4 mm transmittance
10-4%.
Broadband
pass
zone
the spectral
of a broadband components
filter of the
is bounded incident 14
light,
by a lower with
and
wavelengths
upper
wavelengths.
shorter
than
the
lower
and
of-band
longer
than
spectrum,
out-of-band
spectrum at shorter
material,
placed
and
CaF2
absorb
and
A1208
may
Because
better and
choice
design
for the
high
design
and
LaFa
strate.
The
measured
peak
at half
of the
reflectance
order
is RK = 94.4%
by the
value
, and
the
of the
QW
of these angle
The
average
Koppehnann
theoretically
and
bandwidth
reflectance
for the
for LaFs value
and
of the
=
1 are
the
measured
The
reference
silica
the
limit
predicted
fused
< 1 are not
H/L
9 shows
and
silica
145 nm 13,2_.
QW stack.
material,
The
of BaF_
fused
H/L
which
Figure
is 90.3%
made
above
with
for
for the 25-layer
reflectance
The
stacks
filters.
high index
is 19 nm.
H multilayers
stacks.
while
limit
of the
of the window
Windows
a lower pass
zone
QW
choice
with
as the
the
suitable
combination.
reflectors.
of 10%.
from
filters
fabrication
is used
reflections
to as the out-
wavelengths
125 nm respectively,
reflection
maximum
is of the
of multiple
follow,
and
at 45 o incident
is 175 nm,
that
referred
135 nm,
of broadband
wavelength
wavelength
below
together
examples
be improved
for broadband
reflectance
wavelengths
by means
filter,
of a multireflector
wavelengths
narrower
of the
design
might
entrance
be used
calculated
In the
are rejected
at the
the
wavelength
wavelengths
of the
for
upper
are rejected.
rejection
suitable
the
a
as the submeasured out-of-band
MgF2
peak
at this
reflectance
is 91.6%.
The second order
agreement order
QW
theoretical
Figure The
QW stack stack
are
the
(Fig.
more
theory
6).
and
Again
affected
the
this may
by
the
experiment indicate
physical
that
factors
is much
better
than
for the
thicker
films
in the
second
neglected
in the
multilayer
six of these
reflectors.
calculation.
10 shows
4-reflector
11.5 nm.
between
The
the
transmittance
combination rejection
of the
has
of combinations
a peak
out-of-band
of four
transmittance spectrum 15
and
of 66.3% up
and
to 300 nm
the
bandwidth
is better
than
of 0.1%.
If a 4 mm shorter
thick
wavelengths
combination bination of the fused
fused
has provides
combination silica
wavelengths
is used of the
silica
parallel
of the a peak much
out-of-band
better
out-of-band
of 54.04%
rejection
window
is used spectrum
transmittance
for out-of-band as the
plate
spectrum
the
with
16
than
than
then
the
3 x 10⁻⁸%.
of the 10-5%.
The
of 11 rim.
wavelengths. than
rejection
10-s%.
bandwidth
is less
transmittance
is less
window
is better
for out-of-band
wavelengths than
as the
The
6-reflector This
com-
transmittance
If a 4 mm
combination
of the
thick
for shorter
IV.
THE
EXPERIMENTAL
All depositions substrates
with
are
root
the supplier
(Acton
optical
soap
wash,
finally
a Freon
holders.
is kept
made
The free
for
the
for vacuum standard of 0.18
- 0.20
nm/sec
7.5x10
-_ while
the
materials.
The
to an aluminum center
is used with
temperature ring
an electron
fihn gun.
and
with
a typical The
pressure
diameter
thickness The
and gun
has
films
varies
between
with The
are deposited
1.7 and
thick
deposition
rate
voltage
and
stainless
the steel
monitoring. of 10 KV
substrate
of Alabama
giving
low
and
with
an
are
MgF3
for
prepared
(99.95%)
low deposition
pre-deposition 2.3x10
-s
holder
plate.
rates is
for all coating attached are
placed
A quartz
depositions
low power
is
pressure
thermocouple ring
oil-
probability
LaF3
while
are
Center.
pump
The and
the
Flight
a Chromel-Alumel substrate
17
The
in the
measurements
BaF2
of 99.9%
and
in Delrin
University
a very
materials
to 200°C.
by 6 mm
fixed
at the
providing
rinse,
in a laminar
chamber
a sorption
purity
heated
is monitored holder.
fihn
ethanol
is done
vacuum
by
procedure:
to mounting
holder
silica
are cleaned
environment
Space
and
therefore The
fresh
spectrophotometric
of a cryo-pump
fused
the following
prior
NASA/Marshall
and
substrates
room
are made and
of the
substrates
substrate
of a 40 mm
for the
Laboratory
material.
deposition
immediately
All depositions
by CERAC
on the
holders
to the
of the films.
coating
in a clean
bench
all depositions
deposition
packed
the
MgF2
bath,
from
consists
The
ultrasonic
substrate
Branch
contamination
BALZERS
are
then
in the
Aeronomy
for
soak
thick
using
Mounting
nitrogen.
Physics
1 nm.
Massachusetts)
Delrin
transport
system
environment
from
deposition.
Atomic
vacuum
ethanol
by 2 mm
less than
Acton,
substrates
removed
Optical
hydrocarbon
the
The
mm diameter
roughness
Corp.,
rinse,
in a flow of dry
at the
square
water
During
in Huntsville,
on 12.7
Research
are
holder
flow bench.
mean
rinse.
They
substrate
made
ARRANGEMENT
in
crystal are made
depositions
are
maintained is 500 mm
by supplying and
the source
low current to the
to the filament.
monitor
distance
18
The source is 350 mm.
to the substrate
distance
V.
SUMMARY
The the
idea
light
filters. the
of utilizing
is incident The
The
using
which
available
incidence
can
ratio
< 1 are
ments
of the
smallest
the
first
not
The
agreement
QW stacks QW
theoretical
with the
in the
filters
reflectance,
but
of the
high
for broadband zone
as wide
between
centered stack
with
the
4, and
at longer are
calculation
more such
the
lowest
value
reflectors
since
QW
theoretical
by
for the
as the surface
nm
stacks
and of
reflection for coating angle
rI stacks
with
further
the
by the
with
have
of
improve-
is limited
II multilayers do not
for
design
for zero
ratio
de-
reflectance
extended
when
generally
are
maximum
96%
H/L
filters
for the
can provide
experimental second
(Fig. the
than
Furthermore, they
for both
H/L
a width
of
stacks.
and
wavelengths
suitable
be easily
of the
broadband
QW
higher
QW stack
99 layers
films.
as the
affected
the
of more
than
index
5) than
more
as low as 135.6 more
classical
< 1 have
0o = 450 can
reflectance
for wavelengths
thickness
(Figs.
) and
A peak
Stacks
that
reflection
of the
are therefore
and
which
available.
narrowband
H/L
upon
performance
is currently
with
filters
narrowband spectral
< 1 instead
and
limit
of our
what
lI stacks
reflection
superior
It is demonstrated
VUV.
utilized.
basis
for the
I-I/L
QW stacks,
filters.
suitable
reflectance
order
the
maximum
high
in the
than
over
coatings
that
II multilayer
provide
filters
stacks
be achieved
feasible
< 1 are
the
00 = 0 ° (Koppehnann
materials
H/L
constitutes
multilayer
reflection
at both
from
broadband
reflective
bandwidth
reflections
combinations
= 1. It is shown
narrowband limit
the
1I multilayer
H/L
smaller
reflector
and
high
signed
at 450 angle
multiple
narrowband
multiple
9).
physical
and
film contamination. 19
volume
order This
may
factors scattering,
results QW
stack
indicate neglected
is much (Fig. that
better
for
6) and
for
thicker
in the
fihns
multilayer
film inhomogeneity,
and
REFERENCES
1. Acton Research Corporation, Optical
Filters, Catalog (1989).
2. A. Malherbe, "InterferenceFiltersfor the Far Ultraviolet",Appl. Opt. 13, 1275-1276 (1974).
3. A. Malherbe, 1276-1276
"Interference AppI.
5. L. R. Elias, the
Fairchild,
9. W.
for the
1209-1215
and
W.
Far
Ultraviolet",
and
the
AppI.
Opt.
13,
Ultraviolet
Surface
Plasmon
of Alu-
(1974).
M. Yen,
Lal_xCe_F3",
"Interference
"Special
92-97
8. B. K. Flint, 2,
for the
"Variable Appl.
Filters
for
the
Bandwidth
Opt.
12,
VUV
Transmission
138-139
Filter
for
(1973).
(1200-1900Zk)",
Appl.
Opt.
12,
(1973).
7. B. K. Flint, En 9. 18,
13,
Ultraviolet:
2240-2241
Res.
Opt.
Filters
R. Flach,
Vacuum
6. E. T.
Components
(1974).
4. E. Spiller, minum',
"Multidielectric
R. Hunter,
Coatings
for the
Vacuum
Ultraviolet
(VUV)",
Opt.
Adv.
Space
(1979).
"Recent
135-142
Application
Developments
in Ultraviolet
Filters
and
Coatings",
Proc.
SPIE,
(1983). "Review
of Vacuum
Ultraviolet
Optics",
140,
122-130
(1978). 10. M. Zukic,
D. G. Torr,
Ultraviolet Opt.
Optics,
All-dielectric
(Sept.
11. E. Spiller,
J. F. Spann,
and
Narrowband
M. B. Torr, Filters",
"VUV
paper
Thin
accepted
Fihns
Part
II: Vacuum
for publication
in Appl.
1, 1990).
"Multilayer B. J. Thompson
Interference and
R.R.
Coatings Shanon 2O
for the eds.
Vacuum
Proc.
Ultraviolet"
of the
Ninth
in Space International
Congress
of the
International
Sciences,
Washington,
12. W. R. Hunter,
Appl.
13. M. Zukic
and
ed.,
published
Opt.
17,
Chapter
by March
and
for Optics,
581-597
(National
Academy
of
1974).
Criteria
D. G. Torr,
H. Guenther
14. M. Born
D.C.,
"Design
Ultraviolet",
Commission
for Reflection 1259-1270
"VUV
Polarizers
and
Analyzers
in the
Vacuum
(1978).
Thin
Films",
VII,
Springer-Verlag
Principles
of Optics,
in Topics series
in
Applied
on Thin
Films,
Physics, in press
K. (to
be
1991).
E. Wolf,
Chapter
1 (Pergamon
Press,
Oxford
1983).
15. H. A. Macleod, York
Am.
"Prediction
of Absorption
52,
753-761
(1962).
and
J. H. Apfel,
17. C. K. Carniglia rors
18. G.
in the
Presence
Koppehnann,
Materials
and
German,
Leipzig
19. J. H. Apfel, Opt.
20.
16,
25,
of Slight
"On Their
1880-1885
291-298
the Use
Filters,
Chapters
2,5,
and
6 (Macmillan,
New
Loss in Multilayer
"Maxiinum
Absorption",
Theory
Reflectance J. Opt.
of Multilayers
as Interferometer
Interference
of Multilayer
Soc.
Am.
Consisting
Mirrors",
Filters",
Ann.
70,
Dielectric
523-534
of Weakly Phys.
J. Opt.
5,
Mir-
(1980).
Absorbing 388-396
(in
1960).
"Optical
P. H. Lissberger, Acta
Optical
1986).
16. L. Young, Soc.
Thin-Film
Coatings
Design
with
Reduced
Electric
Field
Intensity",
Appl.
(1977).
"The
Ultimate
Reflectance
(1978). 21
of Multilayer
Dielectric
Mirror",
Opt.
21.
M. Sparks tors",
22.
and
J. Opt.
M. Zukic,
M. Flannery, Soc.
Am.
D. G. Torr,
Constants
of BaF_,
accepted
for publication
23. P. Yeh,
Optical
"Simplified
69,
993-1006
J. F. Spann, CaF_,
Waves
and
LaF3,
in Appl.
in
Description
Layered
Dielectric
Reflec-
(1979). M. R. Torr,
MgF2, Opt.
of Multilayer
Al_O3,
(Sept.
Media,
"VUV HfO3,
Thin and
Films
Si_ Thin
Part
h Optical
Films"
paper
1, 1990).
Chapters
6 and
7, (Wiley,
New
York
1988).
24.
D. F. Heath on
the
and
Ultraviolet
P. A. Sachet,
"Effects
Transmittance
of a Simulated
of Optical
Appl. Opt. 5, 93 -943 (1006).
22
Materials
High-Energy Between
Space 1050
Environment 2_and
3000A",
FIGURE
Figure
1:
The maximum
at 145 am.
Diamonds
H = Lanthanum
Figure
2:
incidence
stacks.
limit
is 89.5%.
Figure
nm.
3:
The
the H/L
is shown
ratio
Diamonds
at half
4:
rI stack
for 45 degrees
in Fig.
The measured
with
H = Lanthanum
Figure
5:
The
measured
II stack
for 45 degrees
Figure layer
with
6:
The
second
order
= Barium
H = Barium
Fluoride,
measured
and
stack
1I stack
99-layer,
and
The
maximum
calculated
limit
55-layer, Fluoride.
maximum
of the of the
stacks.
is 90.8%.
for 45 degrees
triangles
reflectance
35-1ayer
Koppelmann
L = Magnesium
reflectance
squares
of incidence
angle
and squares The
35-
Koppelmann
II stacks
stacks
of
calculated
as a function
of
2.
and
calculated
and
of incidence Fluoride,
(squares)
and
and
at 135.6 nm.
calculated angle
reflectance The optical
thickness
ratio
of the 29-layer thickness
ratio
Fluoride.
(diamonds)
of incidence
of the 35-layer
Fluoride.
(diamonds)
L = Magnesium
Fluoride.
The optical
L = Magnesium
centered and
reflectance
at 135.6 nm.
calculated
for 45 degrees
L = Magnesium
(diamonds)
centered
Fluoride,
(squares)
angle
QW
The
of incidence
= 1/4
= 1/3
of the
(squares)
angle
and
for zero angle
55-layer,
Fluoride.
of the
Fluoride,
calculated
triangles
represent
of incidence.
Figure
H/L
99-layer,
reflectance
full width
angle
of the II stack
L = Magnesium
H = Lanthanum
for 45 degrees
H/L
and
maximum
135.6
layer
represent
Fluoride,
The at
reflectance
CAPTIONS
reflectance centered
of the
at 135.6
nm.
35H
FIGURE
CAPTIONS
(Continued)
Figure
7:
The
transmittance
5. The bandwidth
Figure
8:
The
is 4.3 nm,
QW
9:
is 3.2 nm,
The measured
combination
and a peak
transmittance
5. The bandwidth
Figure
of the
of four
transmittance
of the combination and
a peak
29-layer
at 135.6
filters
at 135.6
filters
shown
Figure
10:
The
25-layer
QW
stacks
in Figure
nm is 39.3%.
(squares) and calculated (diamonds) reflectanceof the 25-1ayer
stack for 45 degrees angle of incidence centered at 175 nm. H = Lanthanum
and L = Magnesium
in Figure
nm is 53.7%.
of six 29-layer
transmittance
shown
Fluoride,
Fluoride.
transmittance shown
in Fig.
of combinations 9.
of four
(solid
line)
and
six (dashed
line)
Zukic/Torr
I
I
I
I
I
I
I
I ,i,,,-4
I 0 0
CO Ob
I c.O C_
I _, _
I C_ _
v=d
ooue ooI. OEI
I 0 Ob
I O3 OD
I _ a3
I OD
C_ 00
Zukic/Torr
I
I
I
I
I
I
I
I
u_
qJ r_
cO 0
.=q
CL
t-0 cO C) u_ 0
_
•
0 L
Ca
_ 0
cO C) c_ 0
C) I 0 C)
a3 Ob
I c_ (y)
I _. Ob
I C_ (y]
oou looI O
I 0 Ob
I o3 03
H mnm .
I c_ cO
x FI
.-_
I 03
0 C_ o3
_-"_
C
-
Zukic/Torr
v==d
I
I
I
I
I
I
I
I
I
v--4
C3_
°ad 03
C) t"-
C) _
CO O
_
,I,,q
,J=l
°
,p,q
0
_
'-
0
x_ N
_
u_ C)
C) C_3
O c_ C)
C) I I,I,I
T
I,I,I Z
0 I,I= W a.
[
0
LL.
>. rr
O
0 I< n-
0 m ,< ..i >.
=S 0 ;[
0 rr UJ
,< ..I ,< 0 m II1.
0
-r"[3 rgm
Z
0
mm
0
m
< =S
(n I--
(/) ::)
nn
rr.
=S
0
m
m
o
uJ rr a.
IZ U.I
=S 0
=S m
u.
u..
0
0
!.1.
n-
n-
0
0
0
(n i2:
(.1 ,