Finite element modeling of acousto-mechanical coupling in the cat middle ear James P. Tuck-Lee, Peter M. Pinsky, Charles R. Steele, and Sunil Puriaa兲 Department of Mechanical Engineering, Stanford University Stanford, California 94305, USA
共Received 16 August 2007; revised 28 March 2008; accepted 29 March 2008兲 The function of the middle ear is to transfer acoustic energy from the ear canal to the cochlea. An essential component of this system is the tympanic membrane. In this paper, a new finite element model of the middle ear of the domestic cat is presented, generated in part from cadaver anatomy via microcomputed tomographic imaging. This model includes a layered composite model of the eardrum, fully coupled with the acoustics in the ear canal and middle-ear cavities. Obtaining the frequency response from 100 Hz to 20 kHz is a computationally challenging task, which has been accomplished by using a new adaptive implementation of the reduced-order matrix Padé-via-Lanczos algorithm. The results are compared to established physiological data. The fully coupled model is applied to study the role of the collagen fiber sublayers of the eardrum and to investigate the relationship between the structure of the middle-ear cavities and its function. Three applications of this model are presented, demonstrating the shift in the middle-ear resonance due to the presence of the septum that divides the middle-ear cavity space, the significance of the radial fiber layer on high frequency transmission, and the importance of the transverse shear modulus in the eardrum microstructure. © 2008 Acoustical Society of America. 关DOI: 10.1121/1.2912438兴 PACS number共s兲: 43.64.Bt, 43.64.Ha, 43.20.Tb, 43.40.Ey 关BLM兴
I. INTRODUCTION
In mammals, the peripheral ear consists of six primary structures: the pinna, the ear canal, the tympanic membrane 共commonly called the eardrum兲, the ossicles, the middle-ear cavities 共MEC兲, and the cochlea 共Fig. 1兲. The function of the middle ear, consisting of the eardrum, ossicles, and MEC, is to transform acoustic pressures in the ear canal to hydrodynamic pressures in the cochlea. The first pressure-tomechanical transduction takes place at the eardrum, where sound in the form of vibrations in the air is transformed into mechanical vibrations in the ossicles, which in turn transfer these vibrations to the cochlea. Recent computational models have been used to simulate the behavior of the middle ear in order to understand the relationship between its structure and function. Such an understanding could help improve the design and function of prosthetics and improve methodologies and planning of surgical procedures in the middle ear. Modern medical imaging technologies such as microcomputed tomography 共CT兲 aid in these goals, allowing realistic anatomical geometries to be used with physics-based modeling to simulate the middle ear, instead of fitting model parameters to measurements from average ears. As in vivo imaging techniques improve, this would allow current in vitro biomechanics modeling to be applied to patient-specific anatomies. The eardrum has been the focus of previous studies aimed at explicating the possible relationships between the behavior of the ear and its morphological structure. Notable works include Funnell 共1983兲, Rabbitt and Holmes 共1986兲, Wada et al. 共1992兲, Gan et al. 共2002兲, and Fay et al. 共2006兲. Of these models, only Fay et al. 共2006兲 explored the consea兲
Also at Otolaryngology-HNS, Stanford University Stanford, CA 94305; electronic mail:
[email protected].
348
J. Acoust. Soc. Am. 124 共1兲, July 2008
Pages: 348–362
quences of the tympanic membrane microstructure by incorporating a model for a multilayered orthotropic composite. This detailed model of the eardrum has been shown to be important in understanding the effect of the microstructural properties on middle-ear sound transmission. The acoustic spaces of the ear canal and the middle-ear cavity have also been modeled in conjunction with these eardrum models recently in Gan et al. 共2006兲 and Fay et al. 共2006兲 to simulate the interaction between the acoustic spaces and the movement of the eardrum. This interaction is crucial in understanding the function the eardrum plays in the hearing process as it responds to acoustic input, and the relationship of this function to its structure. However, Fay et al. 共2006兲 was limited to one-dimensional and lumped models for the acoustic spaces. Due to the computational difficulties that arise in coupling the three-dimensional 共3D兲 acoustics to the tympanic membrane, Gan et al. 共2006兲 used a reduced spatial resolution of the acoustic spaces in computing the coupled frequency response. These inherent limitations potentially inhibit the validity of the coupled models at higher frequencies. A new multilayered finite element model of the eardrum of the domestic cat, coupled to 3D models of the middle-ear cavities and a portion of the ear canal, is described in this paper based on CT imaging of cadaver specimens and recent anatomical observations. The domestic cat is chosen for this model because of the availability of physiological measurements for frequencies up to 20 kHz and with various middle-ear manipulations. A fully coupled finite element model is used to simulate the response across the frequency range from 100 Hz to 20 kHz, applying a new adaptive reduced-order modeling procedure based on the matrix Padévia-Lanczos 共MPVL兲 algorithm. This new computational technique allows for an increased spatial resolution for the
0001-4966/2008/124共1兲/348/15/$23.00
© 2008 Acoustical Society of America
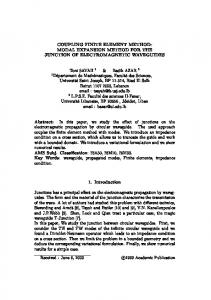
FIG. 1. 共Color online兲 A composite schematic for the domestic cat auditory periphery. For visualization purposes only, as components are misaligned and of different scales from various sources, including visual photography, CT imaging, and 3D reconstructions.
acoustical domains compared to previous models, which allow higher frequency acoustic modes to be resolved in the simulation. Testing of the model is done by comparison to existing measurements for both the intact 共“closed”兲 middleear cavity and for the case where the tympanic and bulla cavities have been surgically opened widely to the environment 共“open”兲. Finally, the model is used to examine three questions regarding the structure and function of the middle ear: the purpose of the bony septum partitioning the cat middle-ear cavities, the consequences of disrupting the radial fibers in the eardrum and of patching perforations, and the effect of the shear modulus in material models of the eardrum. II. ANATOMICAL MODEL A. Model geometry
The middle-ear anatomy was determined by using CT imaging of frozen cadaver specimens acquired from Carolina Biological Supply. Temporal bone sections were isolated, removing the pinna while keeping the eardrum and middle-ear cavities intact 关Fig. 2共a兲兴. A Scanco vivaCT 40 machine at the VA Palo Alto Health Care System 共VAPAHCS兲 Bone and Joint Center was used to image the specimens with a voxel 共both in plane and out of plane兲 resolution of 10 m. The frozen samples were initially wrapped in plastic wrap to preserve moisture, and the scans proceeded over an 8 – 10 h time period per specimen. However, for the single sample that was finally used, a small hole in the bulla cavity was made to vent condensed moisture from the middle-ear cavities that had been found to interfere with identification of the cavity boundaries. Segmentation was done manually by using the vivaCT software to extract the geometry of the acoustic spaces of the ear canal and middle-ear cavities, as well as the ossicle geometries, using visual identification of contrast differences together with automatic edge detection 关Fig. 2共b兲兴. The ear canal was artificially truncated 5 mm from the eardrum to represent the acoustic space typically remaining in the ear canal during impedance measurements. A surface description of these spaces was exported by using standard tessellation language 共STL兲, which was manipulated by using Raindrop GEOMAGIC and MSC PATRAN to generate a 3D mesh of the ear canal and middle-ear cavities. J. Acoust. Soc. Am., Vol. 124, No. 1, July 2008
FIG. 2. 共Color online兲 共a兲 Isolated temporal bone from a domestic cat cadaver with centimeter scale. 共b兲 CT image of the isolated temporal bone from a domestic cat, showing 共roughly from left to right兲 a portion of the ear canal, eardrum, cross section of the malleus, tympanic and bulla cavities, and portion of the cochlea. The scan diameter is 21.5 mm.
B. Eardrum microstructure
To construct a finite element mesh of the eardrum, a quadrilateral surface mesh was created on the surface of the ear canal bordering the eardrum, aligned in its observed radial and circumferential layer directions 关Fig. 3共a兲兴. Radial splines were constructed from this surface mesh and fit to conical and toroidal regions to remove small variations in the geometries as in Fay et al. 共2006兲. The thickness of the tympanic membrane was determined by using recently published physiological measurements by Kuypers et al. 共2005兲 from confocal microscopic observations, projected onto the radial spline geometries 关Fig. 3共b兲兴. These measurements were used because of the limited CT resolution of 10 m, which was not capable of accurately resolving the minimum thickness of 13 m in the cat eardrum. Microstructural observations by Lim 共1968兲 were used to construct radial and circumferential fibrous layers within the lamina propria of the eardrum. However, the fiber layers themselves are not visible to CT imaging, due to contrast and scale, nor are they visible with confocal imaging. Further, fiber density variations are also unknown throughout the eardrum. With the lack of fiber density and thickness information except at a few locations within the eardrum, a thickness distribution for the fibrous layers similar to that assumed by Fay et al. 共2005, 2006兲 was chosen for all radial sections. A smooth polynomial was chosen to gradually increase the thickness of each layer 共a departure from the model of Fay et al.兲, as shown in Fig. 3共d兲, from reported observations at the manubrium and tympanic annulus. A hexahedral mesh was then constructed for each of the sublayers from the radial splines and layer thicknesses, creating distinct models for the radial and circumferential fibrous layers, as well as two layers corresponding to the combined epidermal and subepidermal layers and the mucosal and submucosal layers. Tuck-Lee et al.: Finite element modeling of middle ear
349
FIG. 3. 共Color online兲 共a兲 View of the eardrum through the ear canal, showing the manubrium and radial fiber directions 共dashed lines兲. 共b兲 Thickness contours from Kuypers et al. 共2005兲 projected onto the eardrum model. 共c兲 Finite element mesh for the eardrum, dashed lines separating labeled quadrants. 共d兲 Microstructural model of the eardrum, showing the radial thickness profile of the four layers of a representative radial slice from the malleus 共0 mm兲 to the tympanic annulus 共1.8 mm兲.
C. Eardrum constitutive model
As Lim 共1968兲 observed using scanning electron microscopy, the fibrous layers of the eardrum are made up principally of ordered collagen fibers within a matrix material. These collagen fibers are known to be much stiffer than the surrounding soft tissue matrix, which includes short elastin fibers. The fibrous layers are thus modeled as transversely isotropic materials, oriented with the observed fiber directions. The outer layers without the collagen fibers are modeled by using only the isotropic matrix material. As soft tissues, all layers are treated as being composed primarily of water, leading to a density of = 1100 kg/ m3 and Poisson’s ratio of = 0.45 共nearly incompressible兲. To implement the fiber directions in the model, the mesh of the eardrum was aligned such that the local coordinate systems match the observed fiber orientations 关Fig. 3共a兲兴. Based on visual observations, the radial fibers in the inferior portion of the eardrum seem to converge to the umbo, while the remainder connect to the manubrium. Thus, the radial fibers in the model are partitioned into those in the inferior region that converge to the umbo and those that do not 关as 350
J. Acoust. Soc. Am., Vol. 124, No. 1, July 2008
shown by the dashed lines in Fig. 3共c兲兴. The converging 共radial兲 fiber layer moduli increase asymptotically as 1 / r to model the increasing fiber density, while the moduli of other layers are unchanged. The pars flaccida lacks the ordered collagen fiber layers in the pars tensa and is thus modeled as an isotropic material. Finally, the radial fiber moduli are normalized by the layer thickness due to the observation that the fibers span the distance between the manubrium and the annulus and do not seem to start in the middle of the eardrum. Thus, it is logical to expect the number of fibers, and the area and stiffness of each fiber, to remain constant along its length, with the collagen fibers anchored on either end to act as load-bearing structures. Alternatively, having incomplete fibers within the tympanic membrane would require the load to be transmitted through fiber cross-linking or the soft tissue matrix, neither being strong load-bearing materials given the current understanding of the microstructure. The consequence of this assumption is that the resultant stiffness of the fibers should remain constant, regardless of the thickness of the fiber layer. Therefore, a thicker radial layer would automatically suggest Tuck-Lee et al.: Finite element modeling of middle ear
TABLE I. Material properties of the eardrum model. Parameter Er 共posterior兲 Er 共anterior兲 Er 共inferior兲 E Ematrix Epars flacida Emanubrium Gpars tensa e
Value
Units
0.1 0.1 0.1
GPa GPa GPa
0.1 1 1 1000 35 0.45 1100
GPa MPa MPa GPa MPa
TABLE II. Mass and principle moments of inertia of the malleus-incus complex. Comments Parameter
共Normalized by radius from umbo in mm兲
共Approximately rigid兲 共Nearly incompressible兲
kg/ m3
a lower fiber density to maintain the same total fiber count, area, and stiffness. To model this, Young’s modulus of the radial fibers are normalized by the local thickness in order to compute a local equivalent modulus for the layer. This assumption could be tested for future development by investigation of the variation in fiber layer thickness and fiber densities throughout the eardrum, which could then be added to this computational model. The circumferential fibers are also assumed to be continuous following the circumference of the eardrum. However, as the thickness for the fibrous sublayers are assumed to be constant between radial slices, the circumferential modulus is not normalized by thickness but is instead assumed to have a constant volume fraction. Table I summarizes the material properties used for the tympanic membrane model. In this model, a nominal Young’s modulus of 0.1 GPa is assigned to both the radial and circumferential fibers, with the radial fibers normalized by thickness with a reference of 17 m. In the inferior quadrant, the radial fiber moduli increase by 1 / r relative to the umbo location, with a value of 0.1 GPa at 1 mm distance from the umbo. The matrix material and outer layers are assumed to have an isotropic Young’s modulus of 1 MPa, corresponding to a soft tissue reinforced with elastin. The pars flaccida has an isotropic Young’s modulus of 1 MPa due to the nonoriented collagen and elastin fibers in the matrix. To model material damping effects, a complex elastic modulus is used for each component. This simple viscoelastic model adds an imaginary component to the stiffness 共20% of Young’s modulus in the present model兲 that does not increase with frequency. Viscous damping was not chosen for this model because at high frequencies viscous effects would likely overdamp the structure and suppress higher order modes of vibration as in Gan et al. 共2002兲. For example, the 20% imaginary stiffness in the current model has the same effect as 0.003% viscous damping when compared at a frequency of 1 kHz and 0.0003% at 10 kHz.
moss I ICG II ICG III ICG
Value
Units −5
1.54⫻ 10 1.04368⫻ 10−11 3.59162⫻ 10−11 4.12912⫻ 10−11
kg kg m2 kg m2 kg m2
tions have been observed to be accurate below 3 kHz by Guinan and Peake 共1967兲 and greatly simplify the model. Finally, the suspensory ligaments are modeled to act with resultant forces and moments on the center of gravity 共CG兲 of the malleus-incus complex, which would thus create a hinging axis through the CG at low frequencies. As the CG lies close to the axis running from the anterior process of the malleus to the short process of the incus, this matches experimental observations of the ossicles at low frequencies by Guinan and Peake 共1967兲. Furthermore, rotation about the CG is justified from kinematics, as a fixed center of gravity would allow the best transfer of energy through the ossicles to the cochlea since translational motion of the CG would require additional kinetic energy over simple rotation. Based on the CT imaging, the mass distribution of the ossicles was computed 共Table II兲, including the location of the center of gravity 共Fig. 4兲, the principal axis directions, and the moments of inertia for the combined malleus-incus complex 共Puria et al., 2006兲. A circuit model representation of the incudostapedial joint 共ISJ兲, the stapes, and the cochlea used in Puria and Allen 共1998兲 was chosen. As the motion of the stapes has been observed to be pistonlike at low frequencies, the displacement of the stapes normal to the stapes footplate is taken as the input to the cochlea. Additional translational 共perpendicular to the stapes normal兲 and rotational stiffnesses are added at the ISJ to represent the effects of the
D. Ossicular model and cochlear load
A simplified ossicular model is used for the current middle-ear simulations. First, the ossicles are assumed to act rigidly such that they do not bend under acoustic loads. Second, a fused incudomalleolar joint is used, preventing relative motion of the malleus and incus. Both of these assumpJ. Acoust. Soc. Am., Vol. 124, No. 1, July 2008
FIG. 4. 共Color online兲 Ossicular geometry used in the computational model. Computed center of gravity is indicated, as is the classical axis of rotation 共dashed line兲. Tuck-Lee et al.: Finite element modeling of middle ear
351
annular ligament and joint, respectively, that would not be captured in the 1D circuit model. For modeling the drained cochlea, the cochlear impedance is removed from the circuit model. Disarticulating the stapes removes the entire impedance of the stapes and cochlea, leaving only the inertial properties of the malleus-incus complex and the suspensory ligaments modeled at the CG as the load to the eardrum. III. COMPUTATIONAL MODEL A. Finite element formulation
The interaction between the eardrum and adjacent acoustic spaces is modeled by using a coupled structural acoustics formulation, solving simultaneously for the displacement of the eardrum u and acoustic pressure P in the ear canal and middle-ear cavities. The finite element method is chosen in order to represent accurately the effects of changes in the anatomy in the fully coupled system. This coupled model allows the direct simulation of various changes to the coupled system, including modifications of the middle-ear cavity structures and perforations of the eardrum. For the current model, acoustic behavior is assumed to be small perturbations of pressure with negligible viscosity, governed by the Helmholtz equation for acoustic pressure P, with density a and wave speed c. Small strains are assumed for the eardrum, allowing the usage of 3D linear timeperiodic elastodynamics for the displacements u 共e.g., Hughes, 2000兲. For this model, e will denote the density of the solid 共elastic兲 domain, and the generalized Hooke’s law, = C : ⵜSu, are used to relate linearized stress and strain ⵜSu by the elasticity tensor C. Coupling on the structural acoustic interface is governed by enforcement of continuity of momentum and displacements. Using a standard 共u , p兲 formulation 共that is, solving for displacements in the solid and pressures in the fluid兲 leads to a matrix equation for discrete degrees of freedom d P and du for the acoustic and structural domains, resulting in the asymmetrical matrix system 共e.g., Morand and Ohayon, 1995兲,
冢冋
Ka
0
KTc
Ke
册 冤
1 M a − aK c − c2 0 Me 2
冥冣冋 册 冋 册
dP FP = , 共1兲 du Fu
where Ka and Ma relate to the acoustic domain, Ke and Me to the structural domain, and Kc to the coupling conditions 共e.g., Tuck-Lee and Pinsky, 2008兲. The acoustic medium is modeled by using linear tetrahedral elements due to the difficulty in constructing a hexahedral mesh on arbitrary 3D geometries. A hexahedral solid shell element is used for the eardrum, using modern element technology developed by Vu-Quoc and Tan 共2003兲. A solid shell element offers several distinct advantages for the eardrum model. First, it simplifies the usage of fully 3D constitutive relations for the eardrum material. Second, the element simplifies modeling of thickness variations. Third, it forms distinct coupling surfaces for both sides of the shell to interface separately to the ear canal and MEC. Fourth, the elements can be used within a multilayered composite, in addition to just a single layer. The element has been formulated 352
J. Acoust. Soc. Am., Vol. 124, No. 1, July 2008
FIG. 5. 共a兲 Finite element model of the intact middle ear. 共b兲 Finite element mesh for the middle ear with open middle-ear cavities and absorbing PML boundary conditions.
by using a combination of assumed natural strains 共Dvorkin and Bathe, 1984兲 and enhancing strains 共Simo and Rifai, 1990兲 to avoid locking. The element is also formulated for nonlinear elasticity, which is needed for the future addition of prestress in the eardrum due to a static pressure input. The structural acoustic interface is modeled by using node-onnode coupling, integrating over quadrilateral faces of the shell, although the coupling of tetrahedral and hexahedral elements introduces an interpolation error on the interface. The mesh for the cat middle ear contains 100 000 degrees of freedom for displacements and pressures, corresponding to 23 000 acoustic tetrahedra and 2500 shell elements 关Fig. 5共a兲兴. The rigid ossicular model is added directly into the finite element formulation. The eardrum is constrained along the manubrium by using very stiff massless elements to represent the presence of the malleus 关shown in Fig. 3共c兲兴. However, the motions of the ossicles as a rigid body 共its mass and the stiffness of the attached ligaments and cochlea兲 are defined solely by local displacements near the umbo location, using the eight nodes of a local hexahedral element. The advantage of this approach is that it requires no additional degrees of freedom while accurately representing the observed mass distribution and rigid body behavior. Instead of using a mesh of the ossicles, the contributions of linear and angular inertia of the malleus-incus complex are added to the kinetic energy in the variational equation, leading to a modification of the mass matrix. Likewise, an associated strain Tuck-Lee et al.: Finite element modeling of middle ear
energy is applied to represent the translational and rotational stiffness from ligaments and tendons acting on the center of gravity and the incudostapedial joint. The observed transfer function for the stapes and cochlea by Puria and Allen 共1998兲 is added by using the related work quantity for the motion at the incudostapedial joint. The mathematical details and implementation of this model may be found in the Appendix. The walls of the ear canal and middle-ear cavities are modeled by using an elastic boundary condition to simulate the epithelial and mucosal linings. This appears as a mixed boundary condition to the acoustic domain parameterized by the thickness of the layer t, Young’s modulus E, and Poisson’s ratio . A thin layer of t = 0.1 mm, with E = 1 MPa and = 0.45, is used to model the incompressibility of the soft tissue. The viscoelastic properties are modeled by using a complex stiffness of 20%. This gives a mixed boundary condition for the acoustic field of ⵜP · n = 2at
共1 + 兲共1 − 2兲 P. E共1 − 兲
共2兲
The effect of this damping condition, combined with the material damping of the eardrum, is to prevent unbounded acoustic resonances without changing the overall acoustic response and to be consistent with earlier uncoupled acoustic models of the middle-ear cavities, which would otherwise be undamped. B. Solution methodology
A uniform pressure flux, representing a volume velocity input, is applied across the truncated ear canal entrance to stimulate the acoustic response. A reduced-order approach based on MPVL with an adaptive frequency windowing algorithm 共Tuck-Lee and Pinsky, 2008兲 is used in order to compute efficiently the response across the entire frequency range of interest. The reduced-order model provides the opportunity to compute, in a time span of hours instead of days, the effect of changes to the morphological properties and structure on the response of the middle ear while maintaining a resolved mesh for the entire system in order to capture high frequency behavior. The damping from the complex stapes and cochlear impedance is added via a low-rank update formulation. The points of interest for this simulation are the umbo, several locations on the eardrum corresponding to measurements by Decraemer et al. 共1989兲, pressure in the center of the ear canal corresponding to measurements by Lynch et al. 共1994兲, Puria and Allen 共1998兲, Huang et al. 共2000兲, and Rosowski et al. 共2000兲, and pressures at the oval and round windows of the cochlea. C. Mesh refinement study
Numerical experiments were conducted on the chosen mesh size on sample problems of similar dimensions. For the frequency range in question, the mesh size chosen, h = 0.4 mm, was adequate for this problem up to 20 kHz, giving a 0.2% error for a model problem of similar dimensions 共but much simpler geometry兲. A mesh bisection on the uncoupled eardrum also confirmed that the given mesh was adequate, although with a much larger error than the simpler J. Acoust. Soc. Am., Vol. 124, No. 1, July 2008
coupled example. Higher mesh resolutions proved to not be feasible for the coupled problem, requiring excessive amounts of memory even on a parallel computing cluster. Thus, the given mesh is used for practical purposes, noting that it may introduce some small discretization errors at higher frequencies in resolving the higher order modes. This may result in a stiffer response at higher frequencies than a truly resolved solution. The size of the uncoupled eardrum model allows for simulation on a laptop for parameter verification, and the coupled problem for the given mesh density was run on six processors in a cluster. D. Open cavity modifications
To simulate the response with open middle-ear cavities, a common experimental situation, the MEC model was truncated in the tympanic cavity 关Fig. 5共b兲兴. In place of the remaining volume, an absorbing perfectly matched layer 共PML兲 was added to model the radiation condition due to the open cavity walls 共Turkel and Yefet, 1998兲. A new formulation by Bermúdez et al. 共2006兲 was chosen due to better performance at low wave numbers. Unlike traditional PML, this method uses an asymptotic absorption parameter automatically tuned by the wave speed of the medium but is not perfectly matched at the interface, which is beyond the scope of this paper. Unfortunately, the form of the PML absorbing layers prohibit the practical usage of the reduced-order MPVL algorithm, in which these introduce complicated frequency dependencies. Thus, the open cavity response is computed sequentially over the frequency range at a reduced frequency resolution. E. Removal of the septum
In many small mammals, the middle-ear cavity is physically subdivided by a thin bony wall called the septum. Some have a single septum 共e.g., cat兲, while others have multiple septa 共e.g., chinchilla兲. Acoustic energy is coupled between the cavities via small irregularly shaped openings called foramina. What role this specialized structure has on hearing is not well understood. One hypothesis relates the interaction of the cavity resonances with spatially dependent pinna diffraction cues 共Puria, 1991兲. To gain insight into the role of the septum in the functioning of the middle ear, a model was created without this bony partition. In the finite element mesh, the boundary between the tympanic cavity and the bulla cavity was removed, and the resulting combined space remeshed with acoustic tetrahedra. This changes the geometry of the middle-ear cavities but has no effect on the eardrum or ear canal mesh. F. Perforation and repair of the tympanic membrane
In order to simulate the effect of eardrum perforations and subsequent patching, a recent experiment made in human cadavers by O’Connor et al. 共2008兲 was simulated 共in the cat model兲, in which four cuts were made in the tympanic membrane and repaired using paper patches. These experiments were conducted to illustrate the effect of collagen fibers on sound transmission at high frequencies. Two cases Tuck-Lee et al.: Finite element modeling of middle ear
353
FIG. 6. 共Color online兲 Perforation with cuts and repair with patches of the tympanic membrane along the manubrium: 共a兲 with incomplete patching and 共b兲 with complete patching.
are presented here. The first consists of four circumferential cuts made in the tympanic membrane, with three of the four cuts sealed by paper patches. The second refers to the same four cuts but with all four sealed with patches. To model these cases, a single 0.2 mm wide cut was made around the manubrium, in the direction of the circumferential fibers, representing all four cuts in the experiment 共each approximately 2 – 3 mm in length兲. A 65 m thick patch was firmly attached over the cuts, corresponding to either three or four patches in the experiment. The patch extended over several elements around the perforation but was not kept to constant width in order to simplify the creation of the model, as shown in Fig. 6. For the first case, the acoustic cavities were joined through the remaining perforation 共2.5 mm long兲 and meshed as a single acoustic space. In the second case, the middle-ear cavities remained distinct from the ear canal. To remove the effect of the middle-ear cavity resonances, the open cavity modifications were also applied. The patch is assigned an isotropic Young’s modulus of 1 MPa, with an equal density to the eardrum. To study the possible influence of patch materials, three additional variations are studied. First, the density is decreased by an order of magnitude and compared to the normal response. Second, the stiffness of the patch is increased instead. Lastly, both the stiffness and the mass of the patch are increased to simulate heavier and stiffer materials.
relevant measurement is the middle-ear input impedance, which is the pressure normalized by volume velocity in the ear canal. This has been measured for intact and opened cavities by Lynch et al. 共1994兲, as well as in measurements reported by Puria and Allen 共1998兲 for opened cavities with intact and disarticulated stapes and for cases with a drained cochlea. Finally, the displacements of the tympanic membrane for a given pressure in the ear canal have been measured by Tonndorf and Khanna 共1967兲 using holography and more recently by Decraemer et al. 共1989兲 using laser vibrometry. The main result from these measurements is the displacement at the umbo as a function of frequency but also of interest are the displacements of other locations of the eardrum relative to the umbo displacement. It is this last measurement condition that is not matched well with many current finite element models, as it is the most sensitive to the orthotropic material properties and applied damping values. The ossicular ligament parameters 共Table III兲 were determined by comparing normal and disarticulated stapes measurements with model predictions, as well as against circuit model results in Puria and Allen 共1998兲. The eardrum elastic moduli were primarily constrained by the off-umbo displacements measured by Decraemer et al. 共1989兲 and the placement of the primary resonance in the disarticulated stapes measurements. The mass properties were determined from known properties of biological materials and the total
IV. MODEL TESTING AND RESULTS
TABLE III. Parameter values for the suspensory ligaments, as applied to the center of gravity and the incudostapedial joint.
To study the behavior of the middle-ear model, three primary measurements are considered. Functionally, the most significant measurement of the middle-ear function is the middle-ear transfer function, which is the ratio of pressure in the cochlear vestibule to ear canal pressure 共Dallos, 1970; Puria et al., 1997兲. For the cat, this has been measured for opened middle-ear cavities 共Nedzelnitsky, 1980; Decory, 1989兲 and for intact cavities 共Decory et al., 1990兲. Another 354
J. Acoust. Soc. Am., Vol. 124, No. 1, July 2008
Parameter
Value
Units
trans KCG rot KCG,储 ort KCG,⬜ trans Kisj,⬜ rot Kisj
共1 + 0.1i兲 ⫻ 104 共1 + 0.1i兲 ⫻ 10−3 共1 + 0.1i兲 106 共1 + i兲 ⫻ 10−3
N/m Nm Nm N/m Nm
Tuck-Lee et al.: Finite element modeling of middle ear
volume velocity on the same truncated surface. With a few exceptions, the impedance matches very well with the measurements by Lynch et al. 共1994兲, Huang et al. 共2000兲, and Rosowski et al. 共2000兲 in both magnitude and phase. The resonance at 5 kHz occurs at a slightly higher frequency than the measurements, but it is observed that the volume of the bulla cavity in the cat specimen was much smaller than those reported by Lynch: 380 mm3 compared to 615– 865 mm3. Thus, a shift in the cavity resonance is expected due to the difference in the specific geometry. In addition, a small peak at 3 kHz is also apparent, which is attributed to a slight resonance in the ossicle model that either does not appear in the physical measurements or normally coincides with the acoustic resonance. B. Stepwise modifications with open cavities
Figure 8 shows the comparison of normal, drained cochlea, and disarticulated stapes middle-ear impedances for the case of widely opened cavities. The effect of cochlear damping on the 1 – 2 kHz resonance is observed, as well as the stiffness effect of the annular ligament at lower frequencies. The model does appear to be slightly stiffer than most measurements, but less stiff than one measurement set by Lynch et al. 共1994兲, and generally agrees very well. In addition, the primary resonance between 1 and 2 kHz is not as damped as was observed in measurements. FIG. 7. 共Color online兲 Middle-ear impedance, defined as the pressure normalized by the volume velocity in the ear canal 共Zec = Pec / Vec兲, in units of SI acoustic G⍀. Finite element simulation compared against measurements by Lynch et al. 共1994兲, Rosowski et al. 共2000兲, and Huang et al. 共2000兲 for the closed middle-ear cavity condition.
mass and computed mass distribution of the ossicles. It should be noted that in using a rigid joint model for the ossicles, the final model is expected to be valid principally below 3 kHz. The eardrum model should be valid to a much higher frequency, but without a more detailed ossicular model, this becomes difficult to justify against experimental measurements. However, comparisons between different physiological conditions should nevertheless be useful even above 3 kHz, as these all use the same ossicle model 共which means that observed changes should be primarily independent of the ossicle model兲. Furthermore, the goal of this present research was to combine a multilayered orthotropic model of the tympanic membrane with 3D acoustic simulation. Thus, the simple ossicle model is used for the present in order to concentrate principally on the mechanics of the eardrum and surrounding acoustic spaces. However, in formulating the ossicular model using an energy-based formulation, it is possible to use any 3D ossicular model, as desired in future calculations. A. Middle-ear impedance
Figure 7 shows the middle-ear impedance, Zec = Pec / Vec, for the fully coupled intact ear with closed cavities. The impedance is approximated by the computed pressure in the center of the truncated ear canal model 共analogous to a probe tube measurement兲 and normalized by the applied uniform J. Acoust. Soc. Am., Vol. 124, No. 1, July 2008
C. Umbo displacements
The umbo displacements, normalized by the computed ear canal pressures 共again measured at the center of the ear canal兲, are compared against measurements by Decraemer et al. 共1989兲 and Khanna and Tonndorf 共1972兲 in Fig. 9. At low frequencies, the eardrum model is stiffer by a factor of 2–3, showing a resonance at 2 kHz. Following this resonance, the displacements decay at a similar slope to the measurement data. However, above the resonance at 5 kHz, the computed displacements become much smaller than those measured by Decraemer et al. The model results also show a steeper phase roll-off than the measurement data. D. Eardrum displacements
Figure 10 compares the displacements at various points on the eardrum to the umbo displacement. As can be seen, the displacements show a volumetric 共fundamental mode兲 response of the eardrum below about 2 kHz and then quickly breaks up into higher order modes. This behavior has been discussed as spatial integration in Funnell et al. 共1987兲 and recently in Fay et al. 共2006兲 as the discordant eardrum, with the hypothesis that multiple vibratory modes present in the eardrum are averaged at the manubrium, which may serve to transmit the most sound pressure to the cochlea. In comparison to the velocity measurements of Decramer et al., it should be noted that as the eardrum starts vibrating in higher modes, the measured velocities or displacements become more sensitive to the exact measurement location. One major discrepancy is the presence of a resonance at 2 kHz, which is not seen in the measurement data. Another discrepancy is the calculated anterior displacement. Decraemer et al. observed Tuck-Lee et al.: Finite element modeling of middle ear
355
FIG. 8. 共Color online兲 Middle-ear impedance 共magnitude and phase兲 for open cavities. Three conditions considered: 关共a兲 and 共b兲兴 intact ossicular chain 关共c兲 and 共d兲兴, drained cochlea, and 关共e兲 and 共f兲兴 disarticulated stapes. Finite element simulation compared against measurements by Puria and Allen 共1998兲 and Lynch et al. 共1994兲.
a lower displacement in points on the anterior side of the manubrium compared to the umbo at low frequencies. The current model, however, shows a small increase in displacement. Additionally, at lower frequencies, an increase in the off-umbo displacements by a factor of 3 is computed on the posterior side compared to the factor of 2 shown in Decraemer et al. However, Khanna and Tonndorf 共1972兲 also showed an increase in displacements on the posterior side by a factor of 3 and near unity on the anterior side. Thus, although there are discrepancies between the model results and the measurements by Decraemer et al., the membrane displacements remain consistent with those measured by Khanna and Tonndorf. E. Middle-ear pressure gain
The middle-ear transfer function is calculated from the computed displacements at the umbo. Translations and rotations at the umbo are transformed into the equivalent motion at the incudostapedial joint through the assumption of rigid body dynamics for the ossicles. The ISJ motion is then projected onto the normal of the stapes footplate and used as the input into the stapes-cochlear transfer function, Zsc, to calculate the pressure inside the vestibule of the cochlea. This is then normalized by the computed ear canal pressure to give the middle-ear pressure gain. Figure 11 shows the computed transfer function compared to measurements by Decory et al. 共1990兲 for closed cavities and by Nedzelnitsky 共1980兲 for open cavities. Below 1 kHz, the model results seem to match the Nedzelnitsky slope, which is known to be −6 dB/octave regardless of the state of the middle-ear cavity 共Guinan and Peake, 1967兲. The current model matches the decrease in the Decory measurements at about 3 kHz 共as observed in the impedance兲 but also sees an additional notch at 5 kHz corre356
J. Acoust. Soc. Am., Vol. 124, No. 1, July 2008
FIG. 9. 共Color online兲 Displacement of the umbo 共magnitude and phase兲. Finite element simulation compared against measurements by Decraemer et al. 共1989兲 and Khanna and Tonndorf 共1972兲. Tuck-Lee et al.: Finite element modeling of middle ear
FIG. 10. 共Color online兲 Relative displacement of 共a兲 posterior and 共b兲 anterior regions of tympanic membrane to the displacement at the umbo. Finite element simulation compared against corresponding measurements by Decraemer et al. 共1989兲 and Khanna and Tonndorf 共1972兲.
sponding more closely to the observed cavity resonance. In addition, there is less phase roll-off in the model results from 1 to 2 kHz, although good agreement at low frequencies and a similar phase roll-off at high frequencies. F. Role of the septum
In the middle-ear impedance measurements by Rosowski et al. 共2000兲, the presence of the septum was shown to cause a shift in the middle-ear resonance 共“notch”兲 from near 10 to 4 – 5 kHz 关Fig. 12共a兲兴. This shift in resonance due to the septum was previously tested and confirmed by using a one-dimensional lossy cylindrical tube model for the MEC by Puria 共1991兲. The present results show that the MEC resonance shift hypothesis is consistent even when realistic anatomy is incorporated in the computational framework. In the intact case, a resonance in the 4 – 5 kHz range is shown. However, when the septum is removed, this resonance shifts to above 10 kHz, as seen in Fig. 12共b兲. Thus, the computational model is consistent with the measurement findings regarding the shift in the middle-ear cavity resonance as a function of the cavity geometry. As suggested by Peake et al. 共1992兲, a consequence of the placement of the septum between the oval and round windows is a functional advantage in cases where the eardrum or ossicles are missing or damaged. To analyze this condition, the computed 3D structural model was used to J. Acoust. Soc. Am., Vol. 124, No. 1, July 2008
FIG. 11. 共Color online兲 Middle-ear pressure gain, defined as the pressure in cochlea vestibule normalized by pressure in the ear canal. Closed middle-ear cavity finite element simulation compared against open cavity measurements by Nedzelnitsky 共1980兲 and closed cavity measurements by Decory et al. 共1990兲.
compute the pressure difference between the oval and round windows in the cat MEC, both for an intact middle-ear cavity and for the removed septum 共Fig. 13兲. As expected, there is a decrease in the effective volume between the two coupled cavity conditions 共intact case兲 versus the single cavity condition 共no septum兲. At low frequencies, this results in an increase in the pressure difference magnitude, 兩Pow − Prw兩, by the bony septum between the two windows. There is a greater difference between pressures at the oval and round windows with an intact septum, and thus 兩Pow − Prw兩 is closer to unity. A similar response at the resonant frequencies of the cavities at the round and oval window pressure differences can be observed in both cases. Comparing the response of the normal cavities to those with the septum removed, a similar frequency shift to the impedance at the eardrum is observed. G. Slit experiment
Recent measurements by O’Connor et al. 共2008兲 showed that cutting and then patching of the eardrum has an insignificant effect at low frequencies but has a larger effect on high frequency sensitivity than what was previously measured. Figure 14 predicts the ratio of stapes velocity to the ear canal pressure for three conditions: an intact tympanic membrane, four cuts with three patches, and four cuts with four patches. All simulations were done for open cavities, Tuck-Lee et al.: Finite element modeling of middle ear
357
FIG. 12. 共Color online兲 Middle-ear impedance for normal cavities and removal septum. 共a兲 Measurements by Rosowski et al. 共2000兲 and 共b兲 finite element simulation results.
apparent from the lack of middle-ear resonances. Consistent with measurements, the finite element model results clearly show a loss in stapes velocity at low frequencies when the cuts are not fully patched and a loss above 4 kHz for both cases. Variations on patch material properties predict a stronger sensitivity to the elastic modulus of the patch compared to the density, as shown in Fig. 15. V. DISCUSSION A. Properties of the tympanic membrane
The comparisons between the current model and eardrum measurements of Decraemer et al. are perhaps the most intriguing of the validation comparisons. These comparisons illustrate the advantages over current finite element models of using a multilayered composite model for the eardrum to better represent the physical microstructure, as in Fay et al. 共2006兲. Previous finite element models 共Gan et al., 2006, e.g.兲 have yet to reproduce the tympanic membrane response pattern where there are multiple modes. As medical imaging technology improves, such models will be able to capture these anatomical features, which the current isotropic and orthotropic single layer models cannot. Young’s moduli similar to Fay et al. 共2006兲 are used, which are much larger than those in other finite element models such as those of Funnell and Decraemer 共1996兲. However, the thickness of the fiber layers play a crucial role 358
J. Acoust. Soc. Am., Vol. 124, No. 1, July 2008
FIG. 13. 共Color online兲 Pressure difference at oval and round windows computed by using the coupled model with and without the septum.
in the resultant transverse and bending stiffnesses such that using a multiple layered representation with much smaller thicknesses for the individual layers has a very large impact on the observed stiffness of the composite material. It should also be noted that comparing the fiber moduli with the observed volume fraction of collagen fibers from scanning electron microscopy imaging leads to Young’s moduli for the collagen fibers to be about 1 GPa, which is consistent with the “linear” regime of the measured stress-strain behavior of individual collagen fibers under pretension 共Sasaki and Odajima, 1996兲. This consistency illustrates an advantage of the composite model, in which it can provide a closer physical link between chosen material properties and observable microstructure, and paves the path toward future multiscale modeling using results from molecular simulations. However, the persistent anomalous 2 kHz peak in the model results may indicate a stronger coupling of the eardrum modes in the present model compared to the previously described “discordant” eardrum in Fay et al. 共2006兲, although this may also be a function of the simple ossicular model presently used. One key related observation is the issue of the shear modulus, which only appears explicitly in orthotropic models where the shear modulus is independent of transverse Young’s moduli. This presents an anatomical puzzle, which needs future consideration. Parameter estimation for this model revealed that a high shear modulus on the order of the in-plane moduli was necessary to match experimental obserTuck-Lee et al.: Finite element modeling of middle ear
FIG. 14. 共Color online兲 Stapes velocity, normalized by the ear canal pressure, for three simulated conditions with open cavities: intact tympanic membrane, four circumferential cuts with one left unpatched, and four cuts all patched.
vations on the order of 35 MPa. This is seen mostly in the comparisons to eardrum displacements, where a low shear modulus resulted in much higher relative displacements away from the umbo than those observed by Decraemer et al. 共1989兲 and at earlier frequencies. Figure 16 shows an example of this behavior, if the shear modulus was decreased to 10% of the original value. A higher relative magnitude is observable at low frequencies 共starting at almost eight times the umbo displacement, as opposed to three times兲 and an earlier onset of higher order resonances 共1 kHz instead of 2 – 3 kHz兲. There does not appear to be a strong effect on the impedance, particularly at low frequencies 共not shown兲, but this might become important when considering the mistuned eardrum resonances at higher frequencies. This sensitivity is perhaps not apparent in earlier models due to the increased resultant bending and shear stiffness from using only a single layer, which could obscure the effects of the shear modulus on eardrum displacements seen in the current multilayer composite model. This observation seems to contradict what is known regarding the microstructure of the eardrum. The high shear modulus is also apparent in Fay et al. 共2006兲 using an asymptotic shell model and is implicit in isotropic models where the shear modulus is a function of the resultant Young’s modulus and Poisson’s ratio. The inconsistency in this observation is that the shear modulus is thought to correspond to cross-linking between the fibrous microstructure, J. Acoust. Soc. Am., Vol. 124, No. 1, July 2008
FIG. 15. 共Color online兲 Same as Fig. 14 except with four cuts all patched using 共1兲 a low stiffness 共1 MPa兲 and normal density material, 共2兲 a low stiffness and low density 共0.1 g / cm3兲 material, 共3兲 a high stiffness 共1 GPa兲 and normal density material, and 共4兲 a high stiffness and high density 共10 g / cm3兲 material.
and shear is interpreted as a relative slip between the collagen fibers. The ordered collagen fibers contribute to inplane Young’s moduli, but only the matrix material and superstructure connecting the collagen fibers together contribute to the shear moduli. However, microstructural observations 共Lim, 1968, 1970兲 have previously concluded that there was minimal cross-linking between fibers in the ear-
FIG. 16. 共Color online兲 Relative displacement of the posterior region of the tympanic membrane to the displacement at the umbo. Finite element simulation compared to similar simulation with 10% shear modulus and against relevant measurements. Tuck-Lee et al.: Finite element modeling of middle ear
359
drum. This suggests that either the existing cross-linking is exceptionally strong or that there is some additional mechanism to prevent the eardrum from deforming via shear, such as interweaving of the collagen fibers. These unknown microstructural details, as illustrated by the computational model, may have implications on the behavior of the eardrum or selection of materials for myringoplasty. B. Role of the septum
It has been shown that the cat uses vertical localization cues in the 8 – 16 kHz range 共Musicant et al., 1990; Rice et al., 1992兲. According to the current hypothesis, the function of the septum is to shift the middle-ear resonance away from this useful frequency range, so as not to interfere with sound localization 共Puria, 1991兲. The model results, as shown in Figs. 12 and 13, support the earlier experimental measurements in predicting the migration of the middle-ear resonance away from this range. The pressure difference predicted between the round window and oval window would also seem to indicate that even without the direct input from the eardrum to the cochlea, as transmitted by the ossicles in the middle ear, the cat would be able to detect and respond to acoustic input 共Wever and Lawrence, 1950; Peake and Rosowski, 1996; Voss et al., 1996兲. This may indicate that the septum could also play a role in increasing the pressure differences at the oval and round window, which would increase the input to the cochlea in cases where the eardrum is missing or there is a disruption of the ossicular chain. C. Slit experiment
An important prediction from this experiment is that the patched condition does not show any decrease in stapes velocity until about 2 – 4 kHz 共Fig. 14兲, after which it shows a loss of up to 15 dB. Thus, the numerical simulations agree qualitatively with the measurements done in human cadaver temporal bones, predicting that although a paper patch may restore low frequency hearing, it may not function as well at frequencies above 3 – 4 kHz. As the principle difference between the intact and patched condition is the interruption of the radial fibers, this illustrates the importance of these fibers to the function of the eardrum, even in the absence of pretension. An alternative explanation is the increased mass due to the patches. This possibility is explored by decreasing the mass of the patch by a factor of 10 and comparing those results to the original condition. As shown in Fig. 15, decreasing the mass of the patch does not predict a decrease in transmission loss, indicating that this is a stiffness-related effect rather than mass driven. It also should be noted that Young’s modulus used for the patch was several orders of magnitude below the normal modulus for dry paper. However, in the experiment in question, the paper was heavily moistened, which is known to greatly reduce the elastic modulus 共Alava and Niskanen, 2006兲. This makes the material much closer to the properties of biological soft tissue 共which is normally used for as the graft material兲. As seen in Fig. 15, increasing the stiffness of the patch to a high stiffness 共1 GPa兲 predicts a lower high frequency loss, assuming that the patch is firmly attached to the tympanic membrane. 360
J. Acoust. Soc. Am., Vol. 124, No. 1, July 2008
This has some important possible clinical implications, as the stiffer patch model predicts better high frequency behavior, which is not indicated from the normal low frequency testing. However, a stiffer patch may require a higher density material. As can be seen in the figure, an increase in patch density may add to the loss of high frequency transmission. Thus, a balance must be made between patch stiffness and density, suggesting the usage of reinforced composite materials in cases where the hole sizes are much bigger than the small slits simulated here. VI. SUMMARY
In this paper, a new finite element model for the middle ear has been developed for the domestic cat. This fully coupled model combines realistic anatomical geometries from medical imaging with a multilayered composite model for the tympanic membrane. The model has been tested against physiological measurements under a wide variety of conditions, and numerical experiments have been conducted to gain insight on the middle-ear structure and function. Three observations are reported here: the role of the septum in avoiding a middle-ear resonance around 10 kHz, the high frequency loss in transmission capability due to the radial collagen fibers, simulated by replacing portions of the eardrum with paper patches, and the unusually high shear modulus required for the model to successfully replicate experimental data. The finite element model results give generally good agreement with the experimental measurements. In most of the comparisons, however, there are deviations in the 2 – 3 kHz range, a consistent difference in phase with lower roll-off at low frequencies and higher phase roll-off above 2 kHz. The phase differences seem to be related to the ossicle and cochlea models, as seen in Fig. 8 where the phase in the drained cochlea conditions is in better agreement to the measurements than the intact model. This indicates that a more realistic ossicular model, such as the one recently developed by Sim and Puria 共2008兲, and an improved cochlear model may improve the coupled model and correspond better with experimental measurements. The anomalous 2 kHz peak, on the other hand, seems to indicate an increased “tuning” of the eardrum model over the actual discordant eardrum. In addition, a nonlinear model for the tympanic membrane is currently being developed for simulation of the hearing response at elevated static pressures. The application of the modeling formulation to the human middle ear using medical imaging data is also an obvious next step, now that the approach has been demonstrated by using the domestic cat. Finally, accurate ultrastructural information is needed to construct the fibrous sublayers of the tympanic membrane. If these become available using modern advances in medical imaging technology, layer thickness and fiber density data can be incorporated directly into the model. ACKNOWLEDGMENTS
The authors wish to acknowledge the assistance of Dr. Richard Goode and the VA Palo Alto Health Care System. The authors would also like to thank Dr. Donna Bouley for Tuck-Lee et al.: Finite element modeling of middle ear
her assistance in dissecting and preparing the cadaver samples and Derek Lindsey for assistance on the CT machine. This work has been sponsored in part by a Stanford Graduate Fellowship, NIH:NIDCD Ruth L. Kirschstein Predoctoral Fellowship 共F31DC6327兲, and an NIH:NIDCD R01 Grant 共DC05960兲.
APPENDIX: ADDITION OF OSSICLES AND COCHLEA TO MODEL
A Hamiltonian approach is used to add the effects of the ossicles onto the coupled structural acoustic model. The ossicles, suspensory ligaments, and cochlea add both potential and inertial energies to the total energy of the dynamical system. The umbo is used as the reference location for determining the motions about the center of gravity for the malleus-incus complex, and the displacement and rotation about this point are computed by using local displacements around the umbo. Given a mass and moment of inertia, the rotations of the malleus-incus complex, , are defined by the displacements ua at the local nodes of a hexahedral element centered at the umbo,
共u兲 =
1 ⵜ ⫻ u, 2
冤
共A1兲
再
冎
1 + M关共ⵜ ⫻ ␦u兲 · 共r ⫻ u兲 + 共r ⫻ ␦u兲 · 共ⵜ ⫻ u兲兴 . 2 共A9兲 This in turn adds to the mass matrix of the system 共using moment of inertia I related to the umbo兲, me = NTMN + BTM关r ⫻ 兴N + NT关r ⫻ 兴TMB + BTIB, 共A10兲 where 关r ⫻ 兴 =
冤
0
− r3
r3
0
− r2
r1
r2
冥
− r1 , 0
共A11兲
and N and B are the assembled matrices of Na and Ba, respectively. Similarly, the effects of the suspensory ligaments are represented by six spring parameters, representing the resultant translational and rotational stiffnesses. These springs are added to the potential energy given the displacement and rotation at the umbo, ⌸=
冥
1 4
␦T = − 2 M ␦u · u + 共ⵜ ⫻ ␦u兲 · I共ⵜ ⫻ u兲 ¯
1 1 ktrans 共uCG · ei兲2 + 兺 krot 共共ⵜ ⫻ uCG兲 · ei兲2 , 兺 i 2 i 8 i i
u3,2 − u2,3 1 = u1,3 − u3,1 , 2 u2,1 − u1,2
共A2兲
共A12兲
= 兺 B au a ,
共A3兲
where ei define the local basis oriented with the observed rotational axis. Taking the variation, and keeping the same finite element approximation as before, gives an addition to the stiffness matrix of the system,
a
1 Ba = 2
冤
0
− Na,3
Na,3
0
− Na,2
Na,1
Na,2
冥
− Na,1 , 0
共A4兲
where the displacements within the element are defined by using the standard interpolation functions Na. The motion of the center of gravity for the malleus-incus complex is then written as xCG = xumbo + r,
共A5兲
uCG = uumbo + ⫻ r.
共A6兲
The kinetic energy contribution for a rigid body with respect to the center of mass is 1 1 T = MvCG · vCG + ˙ · ICG˙ , 2 2
共A7兲
with total mass M and moment of inertia I. For an arbitrary reference 共in this case, the umbo location兲, this is rewritten as 1 1 T = Mv · v + Mv · 共˙ ⫻ r兲 + ˙ · I˙ . 2 2
共A13兲
Vi = eTi 兵N − 关r ⫻ 兴B其.
共A14兲
i
i
The 1D transfer function relating force and displacements at the stapes head, as in Puria and Allen 共1998兲, can be written as Fisj = iZisjuisj .
共A15兲
For this model, both uisj and Fisj act only in a direction normal 共nfp兲 to the stapes footplate 共assuming pistonlike motion兲. In particular, for s = i, Zsc共s兲 =
1 Kal + sM s + Ral + sM v + s sCrw + ¯ 共R0 + sM 0兲Rc/共R0 + sM 0 + Rc兲,
共A16兲
2 2 Zisj共s兲 = 共sRisj + Kisj兲Afp Zsc/共sRisj + Kisj + Afp sZsc兲,
共A17兲
共A8兲
Finding the minimum energy, this gives the variational form 共in the frequency domain兲 J. Acoust. Soc. Am., Vol. 124, No. 1, July 2008
T T VTi Vi + 兺 krot ke = 兺 ktrans i i B ei eiB,
where the numerical parameters are defined in Puria and Allen 共1998兲. The potential energy associated with this transfer function can be written as Tuck-Lee et al.: Finite element modeling of middle ear
361
1 ⌸ = sZisj共s兲共uisj · njp兲2 , 2
共A18兲
and the corresponding matrix form, ke共s兲 = sZisj共s兲VTisjVisj ,
共A19兲
T Visj = nfp 兵N − 关risj ⫻ 兴B其,
共A20兲
is added to the finite element model. Alava, M., and Niskanen, K. 共2006兲. “The physics of paper,” Rep. Prog. Phys. 69, 669–723. Bermúdez, A., Hervella-Nieto, L., Prieto, A., and Rodríguez, R. 共2006兲. “An optimal perfectly matched layer with unbounded absorbing function for time-harmonic acoustic scattering problems,” J. Comput. Phys. 223, 469– 488. Dallos, P. 共1970兲. “Low-frequency auditory characteristics: Species dependence,” J. Acoust. Soc. Am. 48, 489–499. Decory, L. 共1989兲. “Origines des differences interspecifiques de susceptibilite au bruit 共origins of interspecies differences of susceptibility to noise兲,” Ph.D. thesis, University of Bordeaux II. Decory, L., Franke, R. B., and Dancer, A. L. 共1990兲. “Measurements of the middle ear transfer function in cat, chinchilla, and guinea pig,” in The Mechanics and Biophysics of Hearing, edited by P. Dallos, C. Geisler, J. Matthews, M. Ruggero, and C. Steele 共Springer-Verlag, New York兲, pp. 270–277. Decraemer, W. F., Khanna, S. M., and Funnell, W. R. J. 共1989兲. “Interferometric measurements of the amplitude and phase of tympanic membrane vibrations in cat,” Hear. Res. 38, 1–18. Dvorkin, E. N., and Bathe, K.-J. 共1984兲. “Continuum mechanics based fournode shell element for general non-linear analysis,” Eng. Comput. 1, 77– 88. Fay, J. P., Puria, S., Decraemer, W. F., and Steele, C. R. 共2005兲. “Three approaches for estimating the elastic modulus of the tympanic membrane,” J. Biomech. 38, 1807–1815. Fay, J. P., Puria, S., and Steele, C. R. 共2006兲. “The discordant eardrum,” Proc. Natl. Acad. Sci. U.S.A. 103, 19743–19748. Funnell, W. R. J. 共1983兲. “On the undamped natural frequencies and mode shapes of a finite-element model of the cat eardrum,” J. Acoust. Soc. Am. 73, 1657–1661. Funnell, W. R. J., Decraemer, W. F., and Khanna, S. M. 共1987兲. “On the damped frequency response of a finite-element model of the cat eardrum,” J. Acoust. Soc. Am. 81, 1851–1859. Funnell, W. R. J., and Decraemer, W. R. 共1996兲. “On the incorporation of moire shape measurements in finite element models of the cat eardrum,” J. Acoust. Soc. Am. 100, 925–932. Gan, R. Z., Sun, Q., Dyer, Jr., R. K., Chang, K.-H., and Dormer, K. J. 共2002兲. “Three-dimensional modeling of middle ear biomechanics and its applications,” Otol. Neurotol. 23, 271–280. Gan, R. Z., Sun, Q., Feng, B., and Wood, M. W. 共2006兲. “Acoustic-structural coupled finite element analysis for sound transmission in human earpressure distributions,” Med. Eng. Phys. 28, 395–404. Guinan, Jr., J. J., and Peake, W. T. 共1967兲. “Middle-ear characteristics of anesthetized cats,” J. Acoust. Soc. Am. 41, 1237–1261. Huang, G. T., Rosowski, J. J., and Peake, W. T. 共2000兲. “Relating middle-ear acoustic performance to body size in the cat family: Measurements and models,” J. Comp. Physiol. 关A兴 186, 447–465. Hughes, T. J. R. 共2000兲. The Finite Element Method: Linear Static and Dynamic Finite Element Analysis 共Dover, Mineola, NY兲. Khanna, S. M., and Tonndorf, J. 共1972兲. “Tympanic membrane vibrations in cats studied by time-averaged holography,” J. Acoust. Soc. Am. 51, 1904– 1920. Kuypers, L. C., Decraemer, W. F., Dirckx, J. J. J., and Timmermans, J.-P. 共2005兲. “Thickness distribution of fresh eardrums of cat obtained with confocal microscopy,” J. Assoc. Res. Otolaryngol. 6, 223–233. Lim, D. J. 共1968兲. “Electron microscopic observation, part I: Pars tensa,” Acta Oto-Laryngol. 66, 181–198. Lim, D. J. 共1970兲. “Human tympanic membrane: An ultrastructural obser-
362
J. Acoust. Soc. Am., Vol. 124, No. 1, July 2008
vation,” Acta Oto-Laryngol. 70, 176–186. Lynch, III, T. J., Peake, W. T., and Rosowski, J. J. 共1994兲. “Measurements of the acoustic input impedance of cat ears: 10 Hz to 20 kHz,” J. Acoust. Soc. Am. 96, 2184–2209. Morand, H. J.-P., and Ohayon, R. 共1995兲. Fluid Structure Interaction 共Wiley, West Sussex兲. Musicant, A. D., Chan, J. C., and Hind, J. E. 共1990兲. “Direction-dependent spectral properties of cat external ear: New data and cross-species comparisons,” J. Acoust. Soc. Am. 87, 757–781. Nedzelnitsky, V. 共1980兲. “Sound pressures in the basal turn of the cat cochlea,” J. Acoust. Soc. Am. 68, 7676–7689. O’Connor, K. N., Tam, M., Blevins, N. H., and Puria, S. 共2008兲. “Tympanic membrane collagen fibers: A key to high frequency sound conduction,” Laryngoscope 118, 483–490. Peake, W. T., and Rosowski, J. J. 共1996兲. “Middle-ear structural and functional dependence on animal size,” in Diversity in Auditory Mechanics, edited by E. R. Lewis, G. R. Long, R. F. Lyon, P. M. Narris, C. R. Steele, and E. Hecht-Poinar 共World Scientific, Singapore兲. Peake, W. T., Rosowski, J. J., and Lynch, III, T. J. 共1992兲. “Middle-ear transmission: Acoustic vs. ossicular coupling in cat and human,” Hear. Res. 57, 245–268. Puria, S. 共1991兲. “A theory of cochlear input impedance and middle ear parameter estimation,” Ph.D. thesis, The City College, CUNY. Puria, S., and Allen, J. B. 共1998兲. “Measurement and model of the cat middle ear: Evidence of tympanic membrane acoustic delay,” J. Acoust. Soc. Am. 104, 3463–3481. Puria, S., Peake, W. T., and Rosowski, J. J. 共1997兲. “Sound-pressure measurements in the cochlear vestibule of human-cadaver ears,” J. Acoust. Soc. Am. 101, 2754–2770. Puria, S., Sim, J. H., and Shin, M., Tuck-Lee, J., and Steele, C. R. 共2006兲. “Middle Ear Morphometry from Cadaveric temporal bone microCT imaging,” Middle Ear Mechanics in Research and Otology — IV., edited by A. Eiber and A. Huber, World Scientific, Singapore. Rabbitt, R. D., and Holmes, M. H. 共1986兲. “A fibrous dynamic continuum model of the tympanic membrane,” J. Acoust. Soc. Am. 80, 1716–1728. Rice, J. J., May, B. J., Spirou, G. A., and Young, E. D. 共1992兲. “Pinna-based spectral cues for sound localization in cat,” Hear. Res. 58, 132–152. Rosowski, J. J., Huang, G. T., Atencio, C. A., and Peake, W. T. 共2000兲. “Acoustic effects of multiple middle-ear air spaces: Measurements in cats,” in Recent Developments in Auditory Mechanics, edited by H. Wada, T. Takasaka, K. Ikeda, K. Ohyama, and T. Koike 共World Scientific, Singapore兲, pp. 15–21. Sasaki, N., and Odajima, S. 共1996兲. “Stress-strain curve and young’s modulus of a collagen molecule as determined by the x-ray diffraction technique,” J. Biomech. 29, 655–658. Sim, J. H., and Puria, S. 共2008兲. “Soft tissue morphometry of the malleusincus complex from micro-ct imaging,” J. Assoc. Res. Otolaryngol. 9, 5–21. Simo, J. C., and Rifai, M. S. 共1990兲. “A class of mixed assumed strain methods and the method of incompatible modes,” Int. J. Numer. Methods Eng. 29, 1595–1638. Tonndorf, J., and Khanna, S. M. 共1967兲. “Some properties of sound transmission in the middle and outer ears of cats,” J. Acoust. Soc. Am. 41, 513–521. Tuck-Lee, J. P., and Pinsky, P. M. 共2008兲. “Adaptive frequency windowing for multifrequency solutions in structural acoustics based on the matrix Padé-via-Lanczos algorithm,” Int. J. Numer. Methods Eng. 73, 728–746. Turkel, E., and Yefet, A. 共1998兲. “Absorbing PML boundary layers for wave-like equations,” Appl. Numer. Math. 27, 533–557. Voss, S. E., Rosowski, J. J., and Peake, W. T. 共1996兲. “Is the pressure difference between the oval and round windows the effective acoustic stimulus for the cochlea?,” J. Acoust. Soc. Am. 100, 1602–1616. Vu-Quoc, L., and Tan, X. G. 共2003兲. “Optimal solid shells for non-linear analyses of multilayer composites,” Comput. Methods Appl. Mech. Eng. 192, 975–1059. Wada, H., Metoki, T., and Kobayashi, T. 共1992兲. “Analysis of dynamic behavior of human middle ear using a finite element model,” J. Acoust. Soc. Am. 92, 3157–3168. Wever, E. G., and Lawrence, M. 共1950兲. “The acoustic pathways to the cochlea,” J. Acoust. Soc. Am. 22, 460–467.
Tuck-Lee et al.: Finite element modeling of middle ear