2005/05/20 NEG_Coating_20.doc
First Experimental and Simulation Study on Secondary Electron and Photoelectron Yield of NEG Materials (Ti-Zr-V) Coating under Intense Photon Irradiation
Y.Suetsugu*1, K.Kanazawa*1, K.Shibata*1, H.Hisamatsu*1, K.Oide*1, F.Takasaki*1, R.V.Dostovalov*2, A.A.Krasnov*2, K.V.Zolotarev*2, E.S.Konstantinov*2, V.A.Chernov*2, A.E.Bondar*2, and A.N.Shmakov*3
*1
Accelerator Research Organization (KEK), 1-1 Oho, Tsukuba, Ibaraki 305-0801, Japan *2
Budker Institute of Nuclear Physics (BINP), Novosibrisk 630090, Russia *3
Boreskov Institute of Catalysis SD RAS, Novosibrisk 630090, Russia
Yusuke Suetsugu Accelerator Laboratory High Energy Accelerator Research Organization (KEK) 1-1 Oho, Tsukuba, Ibaraki 305-0801, Japan TEL: (+81)-298-64-5227 FAX: (+81)-298-64-3182 e-mail:
[email protected]
1
Y.Suetsugu
2005/05/20 NEG_Coating_20.doc
Abstract A beam duct coated with NEG materials (Ti, Zr, V), which had been known to have a low secondary electron yield (SEY), was studied for the first time under intense photon irradiation using a positron beam at the KEK B-Factory (KEKB) to investigate a way to suppress the electron cloud instability (ECI).
A 2.56
m test copper chamber was coated with the NEG materials (we call it NEG coating here) by a magnetron sputtering.
It was installed at an arc section of the KEKB positron ring, where the chamber was irradiated
by direct photons with a line density of 6.5×10¹⁴ photons m-1 s-1 mA-1.
The vacuum pressure around the
test chamber during a usual beam operation was lower than the case of non-coated copper chambers by a factor of 4 - 5.
The electron number around bunches was measured by a special electron monitor up to a
stored beam current of 1600 mA.
The measured electron current, however, was almost the same as a
non-coated copper chamber, especially at low beam currents, and the effect of the NEG coating was smaller than expected.
A simulation explained the result that the abundant photoelectrons in the positron ring
reduce the effect of the low SEY.
The maximum SEYs of the NEG coating and non-coated copper were
evaluated using the simulation as about 0.9 - 1.0 and 1.1 - 1.3, respectively, which were consistent with the values after a sufficient electron bombardment.
The photoelectron yield of them were also estimated as
0.22 - 0.28 and 0.26 – 0.34, respectively, and are in good agreement with the previous experimental results. The study indicates that the suppression of photoelectrons, by a beam duct with an antechamber, for example, is indispensable to make effective use of a surface with a low SEY such as the NEG coating.
PAC: 29.20.Dh, 29.27.Bd Keywords: Electron Cloud Instability, Secondary Electron Yield, Photoelectron Yield, NEG, Positron Beam, Coating.
2
Y.Suetsugu
2005/05/20 NEG_Coating_20.doc
1. Introduction One of the most critical problems in a future high luminosity collider is the electron cloud instability (ECI) in positron or proton rings, and lots of theoretical and experimental studies have been reported so far [1 - 24]. In the KEK B-Factory (KEKB), for example, the most serious problem is that the instability brings down a blow-up of the vertical beam size and deteriorates the luminosity [7, 12, 15, 17, 18, 21, 25 - 27].
The
sources of the electron cloud are photoelectrons due the synchrotron radiation (SR), and electrons generated by the ionization of residual molecules.
At a relatively high beam current, where the electrons are
accelerated by bunched beam to a sufficient energy, however, the multiplication of secondary electrons becomes dominant [2, 28 - 32].
The multiplication has been actually observed as an abnormal (non-linear)
pressure rise in the KEKB positron ring [2, 31, 32].
Various experiments, therefore, have been performed
to suppress the multiplication of the secondary electrons [1, 6, 7, 12, 15, 22, 24 - 27, 33 - 36] as well as the generation of photoelectrons [6, 12, 17, 25 - 27, 29, 30, 37 - 39]. An effective approach to suppress the multiplication of secondary electrons is to utilize a beam duct with an inner surface with a low secondary electron yield (SEY), and many kinds of surfaces have been studied so far [1, 2, 6, 22, 33, 34, 36, 37, 40 - 48].
Appling magnetic field is of course very effective [1, 2, 7, 12, 25 -
27, 31, 39], but it is not always available in the real ring due to lots of pumping ports, beam position monitors, magnets and so on.
One of the practically most promising and interesting candidates for the
accelerator beam duct is the coating of NEG materials (Ti-Zr-V, materials used for Non-Evaporable Getters), which has been mainly developed in CERN and is commercially available through SAES Getters. Co. Ltd. [1, 2, 6, 33, 40 - 45].
The coating of NEG materials (we call it NEG coating hereafter) has the maximum
SEY (δmax) of 2.0 at first, but decreased to about 1.1 just after an activation at 200°C for 2 hours [40].
It is
reported that the δmax increases gradually after the activation up to 1.2 - 1.8 [42, 43] even in a vacuum. However, it is also found that the δmax of NEG coating decreases to about 1.1 by the electron bombardment of 1 mC mm-2 [45].
The δmax is almost the same as that of TiN which has been also used commonly to
decrease the SEY [1, 2, 22, 33, 41, 44 - 50].
From the view point of vacuum property, however, the
NEG-coated chamber is superior to TiN-coated one since the NEG coating has a low gas desorption rate and,
3
Y.Suetsugu
2005/05/20 NEG_Coating_20.doc
at the same time, the surface works as an effective adsorption pump [51 - 54].
The NEG-coated chamber
was tested in the SPS in CERN and drastically suppressed the electron cloud effect [42].
The NEG coating
will be applied to the beam duct at the experimental region and at the worm section in the LHC [42]. This study focused on the application of the NEG-coated beam duct to the high current positron machine to suppress the electron cloud effect.
The experiments about the SEY of NEG coating have been
performed in the laboratory or in the proton ring so far, where the photoelectrons due to the synchrotron radiation (SR) did not have to be considered.
For a high current positron/electron collider, where the
intense SR is irradiated to the inner wall, however, the evaluation of the surface including the effect of photoelectrons is indispensable.
In this point, this is the first study of the NEG coating using a high current
positron ring under the intense photon irradiation.
Here a test copper chamber with the NEG coating was
installed in the positron ring of KEK B-factory (KEKB) [25 - 27] and the electron number in the beam duct (around bunches) was measured using a special electron monitor [17] and compared with a normal (non-coated) copper chamber.
A simulation program to analyze the measured electron current was also
developed and the effect of the abundant photoelectrons was investigated.
The estimation of the
photoelectron yield and the maximum SEY of NEG-coated and non-coated copper surface under the high current beam was then tried. In the following, the process and the properties of the NEG coating are presented at first. results of the beam test at the KEKB positron ring are described.
Secondly, the
Then a simulation developed to explain
and understand the results are introduced and the effect of photoelectrons on the NEG coating is discussed. Finally, the photoelectron and the secondary electron yield (SEY) of the NEG coating are estimated form the experimental results using the simulation.
2. Test chamber 2.1 Coating The coating of NEG materials (Ti, Zr and V) onto a test chamber was performed in Budker Institute of Nuclear Physics (BINP), Novosibrisk, Russia, as an R&D with the consent of SAES Getters. Co. Ltd.. The test chamber is a cold-drawn circular pipe made of oxygen free copper (OFC, C10100), which is a
4
Y.Suetsugu
2005/05/20 NEG_Coating_20.doc
standard beam duct for the KEKB positron ring [55 - 57]. thickness are 2.56 m, 94 mm and 6 mm, respectively.
The total length, the inner diameter and the
The set up for the coating at BINP is shown in Fig.1.
Two ionization gauges, IG1 and IG2, were at the top and the bottom of the chamber, which were used to measure the base pressure and also to estimate the sticking coefficient of H2.
A quadrupole mass analyzer,
QMA, was attached at the top of the chamber to analyze the residual gas components.
The pumping
speeds of the ion pump and the turbo molecular pump at bottom were 0.5 m3 s-1 and 0.03 m3 s-1, respectively. A gas inlet valve for H2 was also at the bottom of the chamber. Each NEG material was a wire with a diameter of 1mm, and they were twisted together and hanged along the center axis of the chamber.
The NEG materials were sputtered onto the inner surface of chamber by a
glow discharge with a magnetic field (i.e., a magnetron sputtering). followed that developed in CERN [40]. 1.
The procedure of the coating almost
The main parameters during the coating are summarized in Table
Before the coating, the chamber was baked at 250°C for 24 hours.
The glow discharge cleaning
before the coating was not applied to avoid a possibility of surface contamination. field was 0.0105 T generated by six solenoids (electromagnets).
The axial magnetic
They were carefully arranged to generate a
uniform magnetic field, and the measured field deviation along the chamber was less than 2%. ambient gas is Kr with a pressure of 0.3 Pa. about 150 mA. during the coating.
The
The applied voltage was 400 V and the discharge current was
The deposition rate was about 0.7 µm per 12 hours.
The chamber was kept at 100°C
Just before the disassembling of the set up, the chamber was filled by a dry air.
2.2 Property of coating Just after the coating, the sticking coefficient of H2, σ, was measured injecting H2 from the bottom at first. The σ was estimated using the formula:
1 ∆P σ = arcch 1 ∆P2 α
2
,
α=
L 3 = 51.6, d
(1)
where, α is a geometrical factor of the system (L: Total length = 2800 mm, d: Diameter = 94 mm), ∆P1 and ∆P2 are the pressure rises at gauges IG1 and IG2, respectively.
5
Just after the coating, the σ of 0.013 was
Y.Suetsugu
2005/05/20 NEG_Coating_20.doc
obtained for ∆P1 = 5.5×10⁻⁵ Pa and ∆P2 = 2.5×10⁻⁷ Pa.
Since a NEG surface just after a re-activation has a
σ of about 0.005 - 0.009 [54], the coating was found to have a good pumping speed for H2. Small copper pieces (sample pieces) were placed inside the chamber during the coating process, and they were used to examine the properties of the coating.
The composition of the coating was measured by
X-Ray Fluorescence using Synchrotron Radiation (SR-XRF). beam line of VEPP-III, BINP.
The XRF spectrum was obtained using photons with an energy of 23.5 keV,
which can excite the fluorescence of all of Ti, V and Zr. presented in Table 2.
The analysis was performed at the SR-XRF
The estimated composition of the coating is
The error of the estimation is about 10%.
The color of the surface was dark gray.
The thickness of the coating was also measured using the SR-XRF.
The mass-thickness of the coating
was estimated to be about 3.4×10⁻⁴ g cm-2, which corresponds to the thickness of 0.4 - 0.9 µm considering an error of a factor two.
Here a piece of titanium was used as a reference sample for the estimation.
Furthermore, the structure of coating was investigated by the X-Ray Diffraction (XRD) analysis using photons with an energy of 8.048 keV.
The measured pattern was typical one for amorphous materials, or
for materials with very small particle size, no more than 1 - 1.5 nm. To understand the state of the coating in more detail, the EXAFS (Extended X-ray Absorption Fine Structure) spectra of the V-K, Zr-K edges for all samples were recorded at the EXAFS Station of Siberian Synchrotron Radiation Center, Novosibrisk, Russia. channel-cut Si(111) monochromator.
The energy of x-ray beam was scanned with an
All spectra were taken using fluorescence-yield technique with a
grazing geometry of the beam-to-sample arrangement, which permits to obtain the depth-averaged structural information about thin-film samples.
Form the analysis, it was found that surface of the fresh sample (the
sample just after the coating) were metallic glasses.
However, in the case of the old sample (the sample
stored in the atmosphere for about 6 months), an indication of Zr-O bond was clearly observed. means the formation of zirconium oxide at the surface under atmospheric conditions.
That
Any traces of
oxidation were not observed for vanadium.
2.3 SEY of NEG coating
6
Y.Suetsugu
2005/05/20 NEG_Coating_20.doc
The secondary electron yields from above two NEG-coated sample pieces were also measured in BINP. The sample pieces, #1 and #2, about 10 mm × 30 mm each, had been stored in a non-sealed glass box for about 6 months before the measurement.
The stainless-steel vacuum chamber for the measurement was
evacuated by an ion pump after the rough pumping, and the base pressure was in the order of 10-7 Pa after a baking at 100°C for 24 hours. water onto the NEG coating.
The baking temperature was limited to 100°C to avoid the absorption of The sample pieces can be heated up to 300°C separately.
The electron
beam has a diameter of about 1.5 mm and injected to the sample with a normal incident angle. electron current is 10 nA, and the energy range was from 20 eV to 600 eV.
The
The energy range is restricted
by the power of power supply and the withstand voltage of the current feed through, but is enough at least to measure the maximum of SEY, δmax, which is usually observed at the primary electron energy of less than 500 eV.
The energy range should be expanded in the future to compare the energy spectrum of SEY with
other data in more detail. Measured energy spectra of the SEY of NEG coating for several conditions are presented in Fig.2.
δmax before the activation was 2.3 - 2.5.
After the activation (baking) at 255°C and 300°C, however, the
δmax decreased to 1.5 - 1.6 and 1.2, respectively. those in CERN or SLAC [33, 40 - 45].
The
The results are almost the same as but a little larger than
One possible reason is that the baking temperature of the test
chamber was low in our case and not enough for degassing. The areas of sample pieces are much smaller than that of the test chamber, and the desorbed gas from the test chamber could affect the surface of NEG coating.
Second possible reason is that the samples were kept under atmosphere long time before this
measurement.
The materials might be oxidized partially as indicated n Sec.2.2.
the sample, furthermore, is still less than 3×10⁻⁵ C mm-2.
The electron dose onto
Note here that the primary electron energy
giving the δmax is about 250 eV at first, but increased to about 300 eV or more as the δmax decreased as shown in the figure.
2.4 Photoelectron yield (ηe) of NEG coating Since the electron/positron beam emits much intense SR compared to the proton/ion beam, the
7
Y.Suetsugu
2005/05/20 NEG_Coating_20.doc
photoelectron yield is an important factor in the present experiment.
Before the beam test of the
NEG-coated chamber, the photoelectron yield from the NEG coating was measured using a short (300 mm) test chamber. (see Fig.1). Table 1.
The coating was performed at KEK using a similar apparatus at BINP as described above The sizes of test chamber and the main parameters during the coating are also listed up in
The axial magnetic field was 0.01 T.
The ambient gas is Ar with a pressure of 2.6 Pa.
applied voltage was 300 V and the discharge current was about 500 mA.
The
Compared to the case in BINP,
the pressure during the coating was high (2.6 Pa) and the thickness of the coating was large (1.5 - 2 µm). The color is almost black.
The composition of the coating measured by the X-ray Photoelectron
Spectroscopy (XPS) at KEK is listed in Table 2. The test chamber was set at the end of the BL-21 SR beam line at PF (Photon Factory) in KEK, which had been used to the measurement of photoelectron yield from various surfaces, such as a saw-tooth surface [28, 38, 39].
The schematic diagram of the apparatus and the sketch inside of the test chamber are shown in
Fig.3.
The critical energy of SR is 4.1 keV, which is almost the same as that of the KEKB positron ring,
5.8 keV.
The incident angle of SR to the test chamber is 51 mrad, and is the same as that of SR just
downstream of a bending magnet in the KEKB positron ring.
The irradiated length is 100 mm.
The
photoelectrons are gathered by 5 electrodes (No.1 - No.5) just above the surface (along the center of chamber) and one electrode (D) at the far end of the chamber. The measured photoelectron yields (ηe) are summarized in Table 3 for a smooth copper chamber (non-coated chamber), and NEG-coated chambers before and after the activation.
The ηe was estimated
from the measured current by these five electrodes and assuming a uniform emission of photoelectrons (i.e., following the cosine law) from the surface [38].
The activation means a baking at 200°C for 2 hours.
After the activation, the pressure in the test chamber is much lower than that at the upstream side of the orifice (see Fig.3), which means the coated NEG was well activated and had a high pumping speed.
The
pressure in the test chamber, actually, was lower than that in the upstream side even if the chamber is irradiated by SR.
The reflectivity (R) was evaluated by the measured currents by the electrode D between
the case when the SR was hit directly and that when the SR was irradiated to the chamber surface.
8
The
Y.Suetsugu
2005/05/20 NEG_Coating_20.doc
effective yield (ηe*) was calculated using ηe and R by ηe* = ηe /(1-R).
The ηe of the NEG-coated surface
before the activation is larger or almost same as that of a smooth copper, about 0.3. the ηe decreased to about 70% of that of the smooth copper, about 0.2.
After the activation,
The NEG coating was found to
have a photoelectron yield of the same order with or a little lower than that of the smooth copper at the present critical energy and the incident angle.
3. Beam Test 3.1 Vacuum test before installation The 2.56 m test chamber was transported from BINP, Russia, to KEK, Japan, filled with dry air in the course of a few days after the coating. 150°C for 24 hours.
About one week after receiving the chamber, it was baked up to
The chamber has three pumping ports and evacuated by two lumped NEG pumps and
one turbo molecular pump.
The total pumping speed was about 0.5 m3s-1.
After the baking, the
ultimate pressure was about 2×10⁻⁸ Pa, and the gas desorption rate was estimated as about 1×10⁻⁸ Pa m3s-1m-2 (the total area is about 1 m2).
The main residual gas component was hydrogen after the baking.
The
ultimate pressure and the gas desorption rate were almost the same as the usual non-coated copper chambers installed in the KEKB so far [58].
Note here that the NEG coating on the inner wall was not activated
before the installation, since the baking temperature of 150°C was not enough to activate the NEG.
The
chamber was filled with dry nitrogen after the vacuum test.
3.2 Installation to positron ring After the vacuum test described above, the test chamber was immediately (within one day) installed into an arc section of the KEKB positron ring.
The energy of positron beam is 3.5 GeV and the maximum
stored beam current is about 1600 mA [25 - 27]. side of a bending magnet as shown in Fig.4.
The chamber was located at about 5.6 m downstream
The linear photon density of the direct SR is about 6.5×10¹⁴
photons s-1m-1 for 1 mA beam current.
The incident angle and the critical energy of the direct SR are
about 10 mrad and 5.8 keV, respectively.
The chamber was baked in situ up to 180°C for 6 hours followed
9
Y.Suetsugu
2005/05/20 NEG_Coating_20.doc
by 200°C for 2 hours. [40].
The baking will be enough to activate the NEG coating and to decrease the SEY
Furthermore, after about 1 and 1.5 months’ beam operation (photon dose of 2 - 3×1024 photons m-1),
the chamber was baked again at 220°C and 250°C for 2 hours, respectively, to see the difference between before and after the activation.
The base pressure after the in situ baking was less than 1×10⁻⁸ Pa, where
the pressure was measured at about 1 m downstream side of the test chamber (see Fig.4).
No solenoid
field was applied to the test chamber during the measurement. A special electron monitor was attached at the bottom of the center pumping port of the chamber [17]. The cross section of the electron monitor was drawn in Fig.5. mm and a positive voltage of 100 V was applied.
The anode (collector) has a diameter of 30
The geometrical effective area of the collector was
estimated as about 40 mm2 including an RF-shield of pumping port and two meshes of a shield and a retarding electrode (repeller).
The repeller was equipped to repel the electrons with low energies, and
usually a negative voltage, -30 V to -200 V, was applied.
The measured electron currents, therefore,
comes from the electrons entering almost normally to the wall with the energy larger than the repeller voltage, that is, the electrons accelerated by bunches just near the beam orbit (the center of beam duct), see Fig.5.
In other words, the measured current reflects the electron number around bunches.
The same
electron monitor had been attached to the non-coated copper chamber at the same position before installing the test chamber, and the measured current can be compared each other directly.
3.3 Vacuum Scrubbing Figure 6 shows the decrease of the pressure rise (∆P) per unit beam current (∆Ib), ∆P / ∆Ib [Pa mA-1], as a function of the photon dose (integrated photons) from the beginning of the beam operation for normal (non-coated) copper chambers and the NEG-coated chamber. currents of 200 - 1000 mA.
The plotted pressures are those at beam
Note here that the photon densities were normalized to that at the position of
the NEG-coated chamber since these chambers were different places in the ring.
Then the ∆P / ∆Ib
corresponds actually to the ηg / S, where ηg [molecules photon-1] is the photon stimulated gas desorption rate, and S [m3 s-1] is the average pumping speed.
Be careful that the data for copper chambers are those of a
10
Y.Suetsugu
2005/05/20 NEG_Coating_20.doc
beam duct with an antechamber without axial magnetic field [30] and of a circular beam duct with an axial magnetic filed of about 50 G.
However, it had been found that the pressure rise with and without axial
magnetic field is not so different at the steady state although the pressure rises rapidly just after turning off the solenoid [30]. for both cases.
As seen in the figure, the pressure rises decreased monotonically with the photon dose The pressure rise of the NEG-coated chamber, however, was smaller than that of the
non-coated copper chamber by a factor 4 - 5.
That means the NEG-coated chamber has a low gas
desorption rate and/or a large pumping speed at the same time [51 - 53]. however, small compared to the report so far [53].
The reduction of pressure is,
That may be explained by that the pressure was not
measured just inside of the chamber, and that the measured pressure includes the effect of the desorbed gas from beam ducts adjacent to the test chamber.
The beam ducts near to the test chamber were also exposed
to air during the installation of the test chamber.
3.4 Measured electron current The electron currents entering to the electron monitor, Ie [A], were measured up to the beam current of about 1600 mA.
The measurement was done at the DC mode, that is, the Ie is the average current.
Ie, therefore, reflect the average electron number around bunches.
The
A typical bunch fill pattern is
1/1284/3.77, which means one train of 1284 bunches with 3.77 RF-bucket spacings in average (i.e., a mixture of 3 and 4 buckets spacings), where one RF-bucket spacing corresponds to 1.97 ns. The behavior of Ie [A] against the stored beam current, Ib [mA], at the first several days after the beam operation is presented in Fig.7. aging phenomenon.
The Ie decreases for the same Ib as the operation time, that is, there is an
Assuming that the Ie / Ib is 4×10⁻⁶ A / 1500 mA, it takes about 40 A hours to reach the
electron dose of 10 mC mm-2 at the position of the electron monitor (collecting area of 40 mm2 was assumed). That electron dose is enough to decrease the SEY (δmax) of the NEG coating [40 - 45].
The decrease of Ie
during the several days’ beam operation, therefore, means the aging of SEY of the NEG coating. The behavior of Ie against Ib in the typical operation (1/1284/3.77) at the steady state is plotted in Fig.8 (a) together with that of the non-coated copper chamber.
The measurement was done after about one month’s
11
Y.Suetsugu
2005/05/20 NEG_Coating_20.doc
operation (1.5×24×30 ~ 1000 A hours) and the electrons dose on the chamber surface is well above 10 mC mm-2.
As shown in the figure, the Ie up to about Ib = 1100 mA is almost the same each other.
of NEG coating, that is, the surface with a low SEY, was not seen.
The effect
At the higher Ib over 1300 mA,
however, there is a difference, that is, the Ie for the NEG-coated chamber has a bump and smaller than that for the non-coated copper one by about 15% at 1600 mA.
The data was measured after the baking of
200°C for 2 hours, but almost the same plots were obtained even after the baking of 220°C or 250°C for 2 hours. Figure 8 (b) and (c) are the Ie for the bunch fill patterns of 4/200/3.77 and 4/390/3, respectively. for NEG-coated chamber was again almost the same as that of the non-coated one for both cases. behavior of Ie against Ib for NEG-coated chamber is, however, different for two cases.
The Ie The
For the bunch fill
pattern of 4/200/3.77, the Ie has a bump at the Ib of about 800 mA, which is different from the case of 1/1284/3.77 (at 1300 mA in Fig.8 (a)). mA/bunch.
However, the bump appeared at the same bunch current, about 1
For the bunch fill patterns 4/390/3, on the other hand, there was no clear bump and no
difference between the NEG-coated and non-coated copper chambers.
These bumps of Ie were not
observed in the case of non-coated copper chamber for all these bunch fill patterns.
These results
including the meaning of the bump will be discussed in the following section later. Figure 9 shows the dependence of Ie on the repeller voltage, Vr.
As increasing the Vr, the Ie decreases.
As seen in the figure, the ratio of electrons with an energy larger than 200 eV increases at higher beam currents.
The energy is enough to emit secondary electrons, and the result indicates that the multiplication
of electrons is likely to occur at high beam currents.
It was also found that the bumps in the curves
became clear as increasing the Vr.
4. Simulation As described above, the Ie for NEG-coated chamber is almost the same as that of the non-coated copper chamber.
Considering that the Ie reflects the electron number around bunches, that means the NEG-coated
chamber has little effect to suppress the electron cloud.
12
The result quite differs from that in SPS, CERN [9,
Y.Suetsugu
2005/05/20 NEG_Coating_20.doc
24, 42].
A big difference of the present experiment from that in the proton ring is the existence of
abundant photoelectrons.
To understand the measured results together with the effect of photoelectrons,
therefore, a simulation study was tried.
4.1 Simulation model In the simulation, electrons including photoelectrons and secondary electrons are traced from the emitting point to the hitting point on the chamber wall (see Fig.12 later).
Electrons emitted from the wall are
attracted (kicked) by the electric field accompanied by a bunch when the bunch is passing.
Between the
successive bunches, the electrons drift freely only following the electric field by the space charge.
The
photoelectrons are emitted at the same time to a passing bunch and with the same profile to the bunch. The secondary electrons are emitted from the same position and at the same timing with that the primary electron hit the wall.
The kicked electrons hit almost normally to the wall all over the wall.
In the
calculation, the photoelectrons by the direct SR were emitted from a side wall, and the electrons hitting up or bottom of the chamber (the position of our electron monitor) with an energy larger than the repeller voltage (Vr) was counted as a measured current (Ie). The model is two dimensional.
Main parameters used in the simulation are listed in Table 4.
bunch profile is the Gaussian with a length (σz) of 6 mm. photons s-1 m-1 for a beam current of 1 mA.
The
The line density of direct photons is 6.5×10¹⁴
Other than the photons above, a uniform photoelectron
emission of 50 % of the direct photons was assumed considering the scattering of photons from the upstream side.
The ratio of 50 % seems too big (see Table 3), but it is not so large considering that the photon
density increases in the upstream side of the test chamber as approaching to the bending magnet, that is, the source of reflected photons.
The space charge with a radial distribution was included in the simulation,
but a uniform azimuthal distribution of electrons in the chamber was assumed here.
That is almost true
when the chamber is sufficiently filled by electrons. The probability of emission of secondary electrons was assumed to follow the formula as below [18]:
13
Y.Suetsugu
2005/05/20 NEG_Coating_20.doc
E δ ( E ) = 1.11 × δ max × E max
−0.35
E × 1 − exp − 2.3 × E max
1.35
(2)
where δ (E), E and Emax mean the SEY, the energy of primary electron and the electron energy yielding the maximum SEY (δmax), respectively.
The energy giving the δmax is assumed to 300 eV here (see Fig.2).
The calculation was performed for several Emax, 200 eV to 500 eV as a test, but the behavior of calculated Ie against Ib was essentially almost the same. The energy distribution of the emitted photoelectrons or the secondary electrons was assumed as below:
n( E ) = n max ×
E , 0 < E ≤ Ep Ep
(E − E p )2 n( E ) = n max × exp − 2 E s2
(3)
, E < E p
where n(E), Ep and Es are the electron number with an energy of E, the electron energy to emit the maximum electron numbers (nmax), and the standard deviation of the energy spectrum at the energy larger than Ep, respectively.
This distribution is based on the experience in the experiment at KEK PF [38].
The energy
distribution for the case of Ep = 3 eV and Es = 5 eV is used in the simulation and is shown in Fig.10 (2000 electrons), which has a peak at the energy of 3 eV and most electrons have an energy less than 10 eV.
4.2 Meaning of bumps First of all, let’s consider the meaning of bumps seen in the cases of NEG-coated chamber (Fig.8) assuming a very simple condition.
Figure 11 is a calculated dependence of the Ie on the Ib for a bunch fill
pattern of 1/1284/3.77 in the case that only the direct photoelectrons are considered, where no reflection, no secondary electron and no space charge are taken into account. 0.3.
The assumed photoelectron yield (ηe) is
As seen in the figure, a plateau of Ie can be observed at the Ib from 1300 mA to 2700 mA.
The
typical trajectory of photoelectrons at the Ib of 1500 mA and 2500 mA are given in Fig.12 (a) and (b), respectively.
For the case (a), the emitted photoelectrons are accelerated by the first and the second
bunches, and they are almost near to the beam orbit when the third bunch is passing there.
14
The emitted
Y.Suetsugu
2005/05/20 NEG_Coating_20.doc
photoelectrons are scattered strongly and in all directions by the third bunch. measured at the electron monitor (Ie) increases.
Then the electron current
For the case (b), on the other hand, where the bunch
current is higher than the case of (a), the emitted photoelectrons are go too far from the center when the third bunch is passing.
Most photoelectrons hit the opposite side and the number of electrons impinging to the
electron monitor at the bottom or top decreases.
The Ie depends on the timing of acceleration by bunches.
In other words, the behavior of calculated Ie, depends on the bunch current, the bunch spacing, the radius of chamber and the energy distribution of emitting electrons.
The plateau begins at low Ib (total beam
current) for the high bunch current, the wide bunch interval and the small duct radius.
Furthermore, the
plateau or the bump seen in Ie becomes clear for the narrower energy spread of emitted photoelectrons, for example, for the case Ep = 3 eV and Es = 3 eV in Eq.(3). It is easily imagined that the Ie increases and the plateau becomes unclear if the effect of secondary electron yield is included since the electron number increases by multiplication.
The calculated Ie for δmax
= 0.0 to 1.8 and for ηe = 0.1 is presented in Fig.13 (a), where the space charge effect and the reflection of SR were also included.
The bumps are clearly seen in the behavior of Ie just as seen in the measurement for
NEG coating (see Fig.8(a) and (b)), and they are found to be a trace of the plateau described above.
In the
simulation, the bumps are observed at the same bunch current if the bunch spacing and the chamber radius are the same.
Actually, the bumps in Fig.8(a) and (b), that is, 1/1284/3.77 (1284 bunches) and 4/200/3.77
(800), were observed at the same bunch current of 1 mA as mentioned above.
That support the
explanation that the behavior of bump (plateau above) is determined by the timing of acceleration of electrons due to the successive bunches. The bump in Ie, however, becomes unclear as increasing δmax.
It is also expected that the Ie approaches to
the same curve for high ηe and δmax, where the space charge have an important role.
δmax = 0.0 to 1.8 and for ηe = 0.2 and 0.3 are presented in Fig.13 (b) and (c).
The calculated Ie for
As increasing the ηe, the
dependence of Ie on the δmax becomes actually smaller, that is just the effect of photoelectrons. Furthermore, the Ie for large δmax (1.6 - 1.8) are almost the same even for ηe = 0.1 - 0.3, which means the Ie is limited by the space charge.
15
Y.Suetsugu
2005/05/20 NEG_Coating_20.doc
Qualitatively, therefore, it can be said that the bump appeared in the Ie for NEG-coated chamber means the lower δmax or lower ηe than non-coated copper.
However, since the Ie at low Ib, where the Ie comes from
only photoelectrons, are almost the same for both cases as shown in Fig.14 (Ib < 50 mA), the ηe are not so The ηe for NEG coating and copper measured in PF had also only a little difference
different each other.
as presented in Table 3.
That indicates that the bump observed for the NEG coating means the low SEY
(δmax) rather than the low ηe in this case.
4.3 Estimation of ηe and δmax As seen in Fig.13, the electron current strongly depends on ηe and δmax.
Then it is possible to estimate
the ηe and δmax for NEG coating chamber and copper chamber by fitting the calculated curves to the measured data changing ηe and δmax.
Assuming that the ηe of copper is about 0.2 - 0.4 from the
measurement at KEK PF (see Table 3) [29, 38], and the ratio of the ηe for copper to NEG coating is 1 : 0.8 from Ie at a low Ib (50 mA) as presented in Fig.14, the δmax and ηe were scanned in the range 0.8 - 1.8 and 0.1 In the scan, the combination of ηe[Cu], ηe[NEG], δmax[Cu] and δmax[NEG] was
- 0.4, respectively.
searched to minimize the value G as below under the condition of ηe[Cu] : ηe[NEG] = 1 : 0.8,
G ≡ ∑ (I mea ,i [Cu ] − A × I cal ,i [Cu ](η e [Cu ], δ max [Cu ]) ) + 2
i
∑ (I
[ NEG ] − A × I cal ,i [ NEG ](η e [ NEG ], δ max [ NEG ]) )
2
mea ,i
,
(4)
i
where Imea,i: measured Ie at Ib = i, Ical,i(ηe, δmax): calculated Ie at Ib = i, and i (beam current): 128, 256, , , ,1536 mA.
The scale factor, A, was also scanned at the same time in the range from 0.5 to 0.7.
The A is a
constant for both the non-coated and the NEG-coated chambers. The result is shown in Fig.15.
Plotted are the combinations of ηe and δmax for NEG coating and
non-coated copper satisfying F ≡ G / Gmin < 1.2, were Gmin is the minimum of G in Eq.(4).
The estimated
ηe for NEG coating and copper are 0.22 - 0.28 and 0.26 - 0.34, and the estimated δmax are 0.9 - 1.1 and 1.1 1.3, respectively.
The δmax are almost in agreement with the values measured so far after the sufficient
electron bombardment [40 - 45].
The ηe are also consistent with the measured ones in Table 3.
16
The
Y.Suetsugu
2005/05/20 NEG_Coating_20.doc
fitted values are plotted in Fig.16 together with the measured ones, where A = 0.59, ηe[NEG] = 0.25,
δmax[NEG]= 0.99, ηe[Cu] = 0.29 and δmax[Cu] = 1.23, respectively.
The scale factor (A) less than one
comes from mainly the difference of the assumed effective area of collector (40 mm2) from the real one. By the way, in the aging process shown in Fig.7, the Ie at Ib = 1000 mA decreased about 20 %.
If
ηe[NEG] = 0.25 and δmax[NEG] = 1.0 after the aging, the initial δmax is estimated as 1.6 - 1.8 from Fig.13 (b) and (c) if the ηe is constant.
The value is in agreement with that reported when the NEG coating is left in
vacuum for long time after an activation [42, 43].
4.4 Validity of simulation To check the validity of the simulation, the Ie were calculated for different bunch fill patterns, 4/200/4 (800 bunches), 4/200/3.77 (800), 1/1284/3.77 (1284), and 4/390/3 (1500), and different repeller voltages (Vr). The behavior of the measured and the calculated Ie against Ib for these bunch fill patterns are presented in Fig.17 (a) and (b), respectively.
The Ie in Fig.17 (b) was calculated for ηe[NEG] = 0.25, δmax[NEG] = 0.99.
The behaviors of Ie for different bunch fill patterns are well reproduced as shown in the figure.
The
positions of bumps in Ie are also almost the same as the measured ones. The dependence on the Vr was also examined and the tendency was in a good agreement as shown in Fig.18, especially for lower beam currents. calculation.
The shape of bumps also becomes clear as increasing Vr in the
It can be explained as that the electrons with higher energy are kicked just near the bunch and
the timing of kick by passing bunches is restricted.
The difference of the reduction rate of Ie at high beam
current region may be explained by the change of incident angle to the collector for electrons with different energies.
The electrons with a low energy can enter the collector from a wide angular range compared to
those with a high energy.
In the calculation, on the other hand, the incident angular range was fixed to a
constant as presented in Table.4. About 10 - 15 % of difference of the bump positions of Ie against the Ib between the calculation and the measurement seen in Fig. 8, Fig.13 and Figs.16 - 18 has not been fully understood yet.
The energy
distribution of emitted photoelectrons or secondary electrons, the bunch length, energy spectrum of
17
Y.Suetsugu
2005/05/20 NEG_Coating_20.doc
secondary electrons and the incident angle had little effect to the position of bump.
Possibilities are due to
the difference of duct radius (a few mm), the deformation of duct, the offset of beam orbit (or the offset of the beam duct conversely) at the location of the electron monitor, the non-uniform azimuthal space charge, or other factors not included here. In any way, although further investigations are required in the future on some points, the simulation here was able to reproduce the measurements within a reasonable range considering the relatively simple assumptions described above.
5. Summary The first beam test of NEG-coated chamber under intense photon irradiation was performed in KEKB positron ring to survey the remedy to suppress the ECI.
The property of coating seemed satisfactory from
the measurements by sample pieces and the vacuum test.
The vacuum pressure around the test chamber
was lower than the case of non-coated copper chambers by a factor 4 - 5.
The electron number near
bunches, however, was almost same as the non-coated copper chamber, especially for low beam currents. The simulation explained the result that the photoelectrons reduced the effect of the low SEY under abundant photoelectrons.
The secondary electron yield of the NEG-coated and non-coated copper chambers
evaluated by the simulation were 0.9 - 1.1 and 1.1 - 1.3, respectively, which is consistent with the values reported so far after sufficient electron bombardment. could proceed soon in high current machines. 0.28 and 0.26 - 0.34, respectively.
The aging of surface by the electron bombardment
The estimated ηe for NEG coating and copper were 0.22 -
The study indicates that the suppression of photoelectrons, by a beam
duct with antechamber, for example, is indispensable to utilize the surface with a low SEY such as NEG coating.
As indicated in Fig.13(a) - (c) , the SEY (δmax) becomes more sensitive to Ie as the ηe decrease.
If the ηe decreased from 0.3 to 0.1, for example, the Ie for δmax = 1.0 decreases to less than a half at high current region.
The test at a straight section in the ring where the SR is much week compared to the arc
section, and the test using a NEG-coated beam duct with an antechamber are planed as a next step.
18
Y.Suetsugu
2005/05/20 NEG_Coating_20.doc
Acknowledgements The authors would like to thank Dr. K.Ohmi, Dr. H.Fukuma for their valuable discussion on the simulation, and Dr. M.Tobiyama, Dr. Y.Hori, Dr. M.Kobayashi, Dr. Y.Tanimoto, Mr. M.Shimamoto and Mr. M.Shirai for their special help about the experiments in KEK PF and KEKB positron ring.
References [1] Reports presented in ECLOUD’04 (Napa CA, April 19-23, 2004), and ECLOUD’02 (CERN, April 15-18, 2002). [2] Reports presented in 13th ICFA Beam Dynamics Mini-Workshop, “Beam Induced Pressure Rise in Rings” (BNL, December 9-12, 2003). [3] M.Izawa, Y.Sato and T.Toyomatsu, Phys. Rev. Lett. Vol.74, 1995, pp.5044-5047. [4] K.Ohmi, Phys. Rev. Letters, Vol.75, No.8, 1995, pp.1526-1529. [5] M.A.Furman and G.R.Lambertson “The Electron-Cloud Instability in PEP-II”, Proc. EPAC96 (Sitges, June 10-14, 1996), pp.1087-1089. [6] V.Baglin, O.Bruning, R.Calder, F.Casper, I.R.Collins, O,.Grobner, N.Hilleret, J.-M.Laurent, M.Morvillo, M.Pivi and F.Ruggiero, “Beam-Induced Electron Cloud in the LHC and Possible Remedies”, Proc. EPAC98 (Stockholm, June 22-26, 1998), pp.359-361. [7] K.Ohmi and S.Matsumoto, “Beam-photoelectron Instability at KEKB: Applying A Magnetic Field”, Proc. APAC (Tsukuba, March 23-37, 1998), pp.435-437. [8] K.C.Harkay and R.A.Rosenberg, “Measurements of the Electron Cloud in the APS Storage Ring”, Proc. PAC1999 (New York, 1999, March 29 - April 2), pp.1641-1643. [9] G.Arduini, V.Baglin, O.Bruning, R.Cappi, F.Caspers, P.Collier, I.R.Collins, K.Cornelis, R.Garoby, O.Grobner, B.Henrist, N.Hilleret, W.Hofle, J.M.Himenez, J.-M.Laurent, T.Linnecar, E.Mercier, M.Pivi, F.Ruggiero, G.Rumolo, C.Scheuerlein, J.Tuckmantel. L.Vos and F.Zimmermann, “Electron Cloud Effects in the CERN SPS and LHC”, Proc. EPAC2000 (Vienna, June 26-30, 2000), pp.259-261. [10] K.Ohmi and F.Zimmermann, “Study of Head-Tail Effect Caused by Electron Cloud”, Proc. EPAC2000 (Vienna, June 26-30, 2000), pp.1164-1166.
19
Y.Suetsugu
2005/05/20 NEG_Coating_20.doc
[11] K.Ohmi and F.Zimmermann, Phys. Rev. Lett. Vol.85, 2000, pp.3821-3824. [12] F.Zimmermann, H.Fukuma and K.Ohmi, CERN-SL-Note-2000-061 AP. [13] F.Zimmermann, “The Electron Cloud Instability: Summary of Measurements and Understanding”, Proc. 2001PAC (Chicago, June 18-22, 2001), pp.666-670. [14] Y.Cai, S.Heifets, J.Seeman, M.Furman and M.Pivi, “New Simulation Results for the Electron-Cloud Effect at the PEP-II Positron Ring”, Proc. PAC2001 (Chicago, June 18-22, 2001), pp.698-700. [15] G.Rumolo, F.Zimmermann, H.Fukuma and K.Ohmi, “Electron Cloud Studies for KEKB”, Proc. PAC2001 (Chicago, June 18-22, 2001), pp.1889-1891. [16] M.A.Furman and M.Pivi, “Updated Electron-Cloud Simulation Results for the Large Hadron Collider LHC”, Proc. PAC2001 (Chicago, June 18-22, 2001), pp.1898-1900. [17] Y.Ohnishi, T.Murakami, K.Kanazawa, M.Tanaka and M.Tejima, “Detection of Photoelectron Cloud in Positron Ring at KEKB”, www-eng.kek.jp/heacc2001/ProceedingsHP.html. [18] L.F.Wang, H.Fukuma, K.Ohmi, S.Kurokawa, K.Oide and F.Zimmermann, Phys. Rev. ST Acc. Beams, Vol.5, 2002, 124402. [19] Z.Y.Guo, H.Huang, S.P.Li, D.K.Liu, L.Ma, Q.Qin, J.Q.Wang, S.H.Wang, G.Xu, C.Zhang, Z.Zhao, Y.H.Chin, H.Fukuma, S.Hiramatsu, M.Izawa, T.Kasuga, E.Kikutani, Y.Kobayashi, S.Kurokawa, K.Ohmi, Y.Sato, Y.Suetsugu, M.Tobiyama, K.Tsukamoto, K.Yokoya and X.L.Zhang, Phys. Rev. ST Acc. Beams,Vol.5, 2002, 124403. [20] F.Zimmermann, “Two-Stream Effects in Present and Future Accelerators”, Proc. EPAC2002 (Paris, June 3-7,2002), pp.25-29. [21] S.S.Win, H.Fukuma, K.Ohmi and S.Kurokawa, “Study of Coupled Bunch Instability Caused by Electron Cloud in KEKB Positron Ring”, Proc. EPAC2002 (Paris, June 3-7, 2002), pp.1592-1594. [22] T.Toyama, Y.Irie, S.Kato, K.Ohmi, C.Ohmori, K.Satoh and M.Uota, KEK Preprint 2002-53, June2002. [23] R.J.Macek, A.Browman, M.Borden, D.Fitzgerald, R.McCrady, T.Spickermann and T.Zaugg, “Status of the Experimental Studies of the Electron Cloud at the Los Alamos Proton Storage Ring”, Proc. PAC03 (Portland May 12-16, 2003), pp.3089-3091. [24] J.M.Jimenez, G.Arduini, V.Baglin, P.Collier, G.Ferioli, B.Henrist, N.Hilleret, L.Jensen, B.Jenninger,
20
Y.Suetsugu
2005/05/20 NEG_Coating_20.doc
J.M.Laurent, A.Rossi, K.Weiss and F.Zimmermann, CERN-AB-2003-008ADM. [25] H.Koiso, et al., “PRESENT STATUS OF THE KEKB B-FACTORY”, Proc. EPAC2002 (Paris June 3-7, 2002), pp.341-343. [26] K.Akai, et al., NIM-PR-A, Vol.499, 2003, pp.191-227. [27] Y.Funakoshi, et al., “KEKB PERFORMANCE”, Proc. EPAC 2004 (Lucerne, July 5-9, 2004), pp.707-709. [28] O.Grobner, 10th International Conference on High Energy Accelerators, Protvino, July 1977. [29] Y.Suetsugu, M.Tsuchiya, T.Nishidono, N.Kato, M.Satoh, S.Endo, T.Yokoyama, J. Vac. Sci. Technol. 21, 2003, pp.186-195. [30] Y.Suetsugu, K.Kanzawa, K.Shibata, H.Hisamatsu, K.Oide, F.Takasaki, A.E.Bondar, V.Kuzminykh, A.Gorbovsky, R.Dostovalov, K.Sennyu and H.Hara, NIM-A, Vol.538, 2005, pp.206-217. [31] Y.Suetsugu, “Observation and Simulation of the Nonlinear Dependence of Vacuum Pressures on the Positron Bema Current at The KEKB”, Proc. PAC2001 (Chicago, June 18-22, 2001), pp.2183-2185. [32] U.Iriso-Ariz, M.Blaskieicz, A.Drees, W.Fischer, S.Peggs and D.Trbojevic, “Electron Cloud and Pressure Rise Simulations for RHIC”, Proc. PAC2003 (Portland, May 12-16,2003). pp.797-799. [33] V.Baglin, J.Bojko, O.Grobner, B.Herist, N.Hilleret, C.Scheuerlein,and M.Taborelli, “The Secondary Electron Yield of Technical Materials and its Variation with Surface Treatments”, Proc. EPAC2000, (Vienna, June 26-30, 2000), pp.217-219. [34] I.Bojko, N.Hilleret and C.Schererlein, J. Vac. Sci. Technol., A 18(3), 2000, pp.972-979. [35] G.Rumolo and F.Zimmermann, “Electron-Cloud Simulations: Build Up and Related Effects”, Proc. ECLOUD02 (CERN, April 15-18, 2002), pp.97-111. [36] A.A.Krasnov, Vacuum, Vol.73, 2004, pp.195-199. [37] V.Baglin, I.R.Collins and O.Grobner, “Photoelectron Yield and Photon Reflectivity from Candidate LHC Vacuum Chamber Materials with Implications to the Vacuum Chamber Design”, Proc. EPAC1998 (Stockholm, June 22-26, 1998), pp.2169-2171. [38] Y. Suetsugu, Y. Hori, K. Kanazawa, M. Kobayashi, Y. Tanimoto, Y.-J. Hsu, Y.Suetsugu, “Reduction of the Photoelectron Yield from a Copper Beam Chamber by Saw-Tooth Machining”, Proc. PAC2001
21
Y.Suetsugu
2005/05/20 NEG_Coating_20.doc
(Chicago, June 18-22, 2001), June 18-22, 2001, pp.2177-2179. [39] Y.Suetsugu, Y.Tanimoto, Y.Hori, K.Kanazawa and M.Kobayashi, “Effects of External Magnetic Fields on The Photoelectron Emission from a Copper Beam Duct”, Proceedings of PAC2001 (Chicago, June 18-22, 2001), pp.2180-2182. [40] B.Henrist, H.Hilleret, C.Scheuerlein and M.Taborelli, Appl. Surface Sci., Vol.172 ,2001, pp.95-102 [41] F.Le Pimpe, F.King, R.E.Kirby and M.Pivi, SLAC-TN-03-052. [42] A.Rossi, ECLOUD’04 (Napa CA, April 19-23, 2004). [43] F.Le.Pimpe, ECLOUD’04 (Napa CA, April 19-23, 2004). [44] H.C.Hseuh, ECLOUD’04 (Napa CA, April 19-23, 2004). [45] F.L.Pimpec, F.King, R.E.Kerby, M.Pivi and G.Rumolo, SLAC-TN-04-046/LCC-0146. [46] A.R.Nyaiesh, E.L.Garwin, F.K.King and R.E.Kirby, J. Vac. Sci. Technol. A 4(5), 1986, pp.2356-2363. [47] P.Prieto and R.E.Kirby, J. Vac. Sci. Technol. A 13(6), 1995, pp.2819-2826. [48] R.E.Kirby and F.K.King, NIM-PR A 469, 2001,pp.1-12. [49] D.R.Walters and Q.Ma, “Secondary Electron Yield of a Thin Film Coating on the APS RF Cavity Tuners”, Proc. PAC2001 (Chicago, June 18-22, 2001), pp.2153-2155. [50] S.Kato and M.Nishiwaki, presented in 49th AVS (Denver, November 3-8, 2002), AS-ThM7. [51] C.Benvenuti, A.E.Santana and V.Ruzinov, CERN EST/99-008 (SM), 1999. [52] C.Benvenuti, P.Chiggiato, P.C.Pinto, A.E.Santana, T.Hedly, A.Mongelluzzo, V.Ruzinov and I.Wevers, Vacuum, Vol.60, 2001, pp.57-65 [53] P.Chiggiato and R.Kersevan, CERN EST/99-004 (SM), 1999. [54] C.Benvenuti, P.Chiggiato, A.Mongeluzzo, A.Prodromides, V.Ruzinov, C.Scheuerlein and F.Levy, J. Vac. Sci. Technol. A19(6), 2001, pp.2925-2930. [55] K.Kanazawa, S.Kato, Y.Suetsugu, H.Hisamatsu, M.Shimamoto, M.Sato and M.Shirai, Appl. Surf. Sci. Vol.169-170, 2001, pp.715-719. [56] K.Kanazawa, S.Kato, Y.Suetsugu, H.Hisamatsu, M.Shimamoto, M.Shirai, NIM-PR-A, Vol.499, 2003, pp.66-74. [57] Y.Suetsugu, K.Kanazawa, S.Kato, H.Hisamatsu, M.Shimamoto and M.Shirai, J. Vac. Sci. Technol., A
22
Y.Suetsugu
2005/05/20 NEG_Coating_20.doc
21(4), 2003, pp.1436-1441. [58] K.Kanazawa, S.Kato, Y.Suetsugu, H.Hisamatsu, M.Shimamoto, M.Sato and M.Shirai, Appl. Surf. Sci, Vol.169-170, 2001, pp.720-723.
23
Y.Suetsugu
2005/05/20 NEG_Coating_20.doc
Table captions Table 1
Main parameters of NEG coating process at BINP and KEK.
Table 2
Compositions of NEG materials coated at BINP and KEK.
Table 3
Photoelectron yield (ηe), reflectivity (R) and effective photoelectron yield (ηe*) from NEG-coated chamber prepared in KEK.
Table 4
Main parameters assumed in simulation.
24
Y.Suetsugu
2005/05/20 NEG_Coating_20.doc
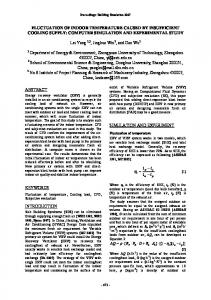
Figure captions Figure 1
Setup for NEG coating at BINP.
Figure 2
Measured secondary electron yields (SEY) for NEG-coated sample pieces, #1 and #2, for several conditions.
Figure 3
Setup for measuring photoelectron yield (ηe) from non-coated and NEG-coated copper chambers at KEK Photon Factory (PF).
The critical energy and the incident angle of SR are 4.1 keV and
51 mrad, respectively. Figure 4
Test chamber installed in the KEKB positron ring. downstream side of a bending magnet.
The chamber is placed about 5.4 m
The mark “N” means a lumped NEG pump.
Figure 5
Cross section of special electron monitor used to measure electron number in the chamber.
Figure 6
Vacuum scrubbings for NEG-coated and con-coated copper chambers, where the photon density was normalized.
Figure 7
Aging phenomenon of measured electron current (Ie) observed for NEG-coated chamber.
Figure 8
Behavior of measured electron current (Ie) against beam current (Ib) of NEG-coated and non-coated copper chambers for the bunch fill patterns (a) 1/1284/3.77 (1284 bunches), (b) 4/200/3.77 (800) and (c) 4/390/3 (1500), where the repeller voltage (Vr) is -30 V.
The bunch fill
pattern 1/1284/3.77, for example, means one train of 1284 bunches filled by 3.77 RF bucket spacings in average. Figure 9
Behavior of Ie against Ib of NEG-coated chamber for different repeller voltages (Vr).
Figure 10 Energy distribution of emitted photoelectrons and secondary electrons assumed in the simulation (2000 electrons). Figure 11 Calculated behavior of Ie against Ib considering only photoelectrons for 1/1284/3.77.
The
secondary electrons, the scattered photons (reflections) and the space charge are not considered. Figure 12 Examples of trajectories of photoelectrons emitted from one side wall for (a) Ib = 1500 mA and (b) Ib = 2500 mA in Fig.11. Figure 13 Behavior of calculated Ie against Ib for ηe of (a) 0.1, (b) 0.2 and (c) 0.3 for δmax of 0.0 - 1.8, where
25
Y.Suetsugu
2005/05/20 NEG_Coating_20.doc
the bunch fill pattern is 1/1284/3.77 and the repeller voltage (Vr) is -30 V. Figure 14 Measured Ie at low Ib for non-coated and NEG-coated chamber, where the bunch fill pattern is 1/1284/3.77 and the repeller voltage (Vr) is -30 V. Figure 15 Estimated ηe and δmax for copper and NEG-coated chamber obtained from the curve fitting for the case of Fig.8 (a). Figure 16 Behaviors of calculated Ie using the estimated ηe and δmax (ηe[NEG] = 0.25, δmax[NEG]= 0.99,
ηe[Cu] = 0.29, δmax[Cu] = 1.23) and of measured Ie against Ib for the case of Fig.8 (a). Figure 17 Behavior of (a) measured Ie and (b) calculated Ie against Ib for NEG-coated chamber for different bunch fill patterns of 4/200/4, 4/200/3.77, 1/1284/3.77 and 4390/3, where ηe[NEG] = 0.25 and
δmax[NEG]= 1.0 are used in the calculation. Figure 18 Behavior of calculated Ie against Ib for NEG coated chamber for different repeller voltage (Vr) of -30 V, -100 V and -200 V, where ηe[NEG] = 0.25 and δmax[NEG] = 1.0 are used in the calculation. The bunch fill pattern is 1/1284/3.77.
26
Y.Suetsugu
2005/05/20 NEG_Coating_20.doc
Table 1 Chamber for Beam Test Chamber (BINP)
for
Measurement
Photoelectron Yield (KEK)
Material of chamber
OFC (t 6mm)
OFC (t 6mm)
Length of chamber
2560 mm (φ 94mm)
300 mm (φ 94mm)
Sputtered materials
Ti, V, Zr
Ti, V, Zr
Size of wires
φ 1mm
φ 1mm
Ambient gas
Kr
Ar
0.3 Pa
2.6 Pa
0.0105 T
0.01 T
400 V
300 V
Discharge Current
150 mA
500 mA
Sputtering Time
12 hours
5 hours
0.7 - 0.9 µm
1.5 - 2.0 µm
100°C
40°C
Pressure during sputtering Magnetic fild Applied Voltage
Thickness of coating Temperature during sputtering
of
27
Y.Suetsugu
2005/05/20 NEG_Coating_20.doc
Table 2 Atomic fraction (Weight fraction)
Atomic fraction
of NEG coating by BINP
of NEG coating by KEK
Ti
30 % (24 %)
34 %
V
44 % (37 %)
55 %
Zr
26 %( 39 %)
10 %
28
Y.Suetsugu
2005/05/20 NEG_Coating_20.doc
Table 3
ηe
R [%]
ηe*
Cu (smooth, Ra = 0.02)
0.29
33.2
0.434
NEG (Before Activation)
0.32
19.5
0.39
NEG (After Activation)
0.19
14.8
0.23
29
Y.Suetsugu
2005/05/20 NEG_Coating_20.doc
Table 4 Assumptions in Simulation Photoelectron yield (ηe)
0.1 - 0.4
electrons photon-1
Energy distribution of emitted electrons
Eq.(3)
Diameter of beam duct
94 mm
Bunch length of a Gaussian bunch (σz)
6 mm
Photon density at measuring point
6.5 ×10¹⁴
photons mA-1s-1m-1
Scattered photons at measuring point
6.5 ×10¹⁴
photons mA-1s-1m-1
Energy spectrum of SEY
Eq.(2)
Maximum SEY (δmax)
0.8 - 1.8
Space charge
Uniform azimuthal distribution Normal ±π/24
Incident angle to chamber wall
40 mm2
Collector area
30
Y.Suetsugu
2005/05/20 NEG_Coating_20.doc
Figure 1
31
Y.Suetsugu
2005/05/20 NEG_Coating_20.doc
Figure 2
32
Y.Suetsugu
2005/05/20 NEG_Coating_20.doc
Figure 3
33
Y.Suetsugu
2005/05/20 NEG_Coating_20.doc
Figure 4
34
Y.Suetsugu
2005/05/20 NEG_Coating_20.doc
Figure 5
35
Y.Suetsugu
2005/05/20 NEG_Coating_20.doc
Figure 6
36
Y.Suetsugu
2005/05/20 NEG_Coating_20.doc
Figure 7
37
Y.Suetsugu
2005/05/20 NEG_Coating_20.doc
Figure 8 (a)
38
Y.Suetsugu
2005/05/20 NEG_Coating_20.doc
Figure 8 (b)
39
Y.Suetsugu
2005/05/20 NEG_Coating_20.doc
Figure 8 (c)
40
Y.Suetsugu
2005/05/20 NEG_Coating_20.doc
Figure 9
41
Y.Suetsugu
2005/05/20 NEG_Coating_20.doc
Figure 10
42
Y.Suetsugu
2005/05/20 NEG_Coating_20.doc
Figure 11
43
Y.Suetsugu
2005/05/20 NEG_Coating_20.doc
Figure 12 (a)
44
Y.Suetsugu
2005/05/20 NEG_Coating_20.doc
Figure 12 (b)
45
Y.Suetsugu
2005/05/20 NEG_Coating_20.doc
Figure 13 (a)
46
Y.Suetsugu
2005/05/20 NEG_Coating_20.doc
Figure 13 (b)
47
Y.Suetsugu
2005/05/20 NEG_Coating_20.doc
Figure 13 (c)
48
Y.Suetsugu
2005/05/20 NEG_Coating_20.doc
Figure 14
49
Y.Suetsugu
2005/05/20 NEG_Coating_20.doc
Figure 15
50
Y.Suetsugu
2005/05/20 NEG_Coating_20.doc
Figure 16
51
Y.Suetsugu
2005/05/20 NEG_Coating_20.doc
Figure 17 (a)
52
Y.Suetsugu
2005/05/20 NEG_Coating_20.doc
Figure 17 (b)
53
Y.Suetsugu
2005/05/20 NEG_Coating_20.doc
Figure 18
54
Y.Suetsugu