For A>20 deg the span wise flow carries these particles across .... Homogeneite au Stereoscope par la Methode du Contraste de Phase,". Revue d'Optique, Vol.
AIAA JOURNAL
390
VOL. 21, NO. 3
Flow Visualization Methods for Separated Three-Dimensional Shock Wave/Turbulent Boundary-Layer Interactions Gary S. Settles* and Hsueh-Ying Tengt Princeton University, Princetftn, New Jersey A collection of techniques is presented for the visualization of separated turbulent flows at high speeds. Some of these techniques—including a method of generating a localized vapor visualization—have not been available previously. Others, such as the conical shadowgraph and stereoscopic schlieren methods, have been used before in other contexts. Here, all the available techniques are applied to the study of three-dimensional supersonic flows generated by swept compression corners. The paper discusses the techniques and some of the fluid mechanical insights revealed by the visualizations, including the structure of the observed three-dimensional flow separations and associated shock wave systems.
Introduction HE visualization of flow patterns has always been critically important in fluid mechanics research. A single visualization can often lead to more physical understanding than a large set of costly and tedious point measurements. The more complex the flow, the greater the need for visualization to serve as a framework for correlating other less global but more quantitative observations. Many visualization methods are known for low-speed flows, 1 ' 2 but the difficulties imposed by higher speeds often limit their utility. In the compressible regime, optical refraction methods3 and surface-streak methods are the only ones in general use, while simple particle tracer methods —so useful in low-speed flow—are largely ineffective. This leaves a gap in the ability to observe high-speed streamlines which is inadequately filled by mere observations of limiting streamlines on surfaces. Further, the versatility of optical methods at high speeds is often lost for three-dimensional (3D) flows, since these methods integrate 3D information across the flow and require clear paths of view. Potential visualization means are further constrained by the need for simplicity, economy, and adaptation to wind tunnels not particularly designed for this purpose. These flow visualization difficulties hold especially for the current research program of the Princeton University Gas Dynamics Laboratory, which includes systematic experiments on 3D shock/boundary-layer interactions in an effort to understand the complex flow structures, physical relationships, and scaling laws involved (e.g., Refs. 4-7). These flows are turbulent, three dimensional, high speed, and often separated. The present work explores a number of approaches, both new and old, for visualizing such complex flows. These approaches are tested using a previously documented5'7 class of 3D interactions generated by swept compression corners. The results contribute to the understanding of the 3D flow structures in this interaction class.
T
Experimental Arrangement The experiments were carried out in the Princeton University High Reynolds Number 20 x 20 cm Slowdown Presented as Paper 82-0229 at the AIAA 20th Aerospace Sciences Meeting, Orlando, Fla., Jan. 11-14, 1982; submitted Jan. 22, 1982; revision received July 19, 1982. Copyright © American Institute of Aeronautics and Astronautics, Inc., 1982. All rights reserved. * Research Engineer and Lecturer; Manager, Gas Dynamics Laboratory, Mechanical and Aerospace Engineering Department. Member AIAA. t Visiting Research Staff Member from Beijing Institute of Aeronautics and Astronautics, Beijing, China.
Wind Tunnel at a freestream Mach number of 2.93, a Reynolds number of 6x 10⁷/m, and approximately adiabatic wall conditions. The incoming turbulent boundary layer on the tunnel floor is about 1.5 cm thick, and is known to be in an equilibrium state.6 The test geometry sketched in Fig. 1 is a typical swept compression corner characterized by angles a. and X in vertical and horizontal stream wise planes, respectively. For present purposes a. was always maintained at 24 deg, while X took on values of 0, 20, 40, or 60 deg (requiring four distinct test models). The spanwise sides of these models were set in 2.5 cm from the tunnel sidewalls and aerodynamic fences were used as necessary to isolate the corner flow from the sidewall boundary layers. Four streamwise rows of surface pressure taps were located at 5, 7.6, 10.1, and 12.7 cm spanwise from the "apex," or forwardmost point of the models. The photography of the flow visualization results was often done stereoscopically in order to record 3D information. While stereo pairs of photographs are presented here, they may have suffered some loss of clarity owing to the reproduction process. Further, a stereoscopic viewer is necessary in order to view these results properly. (Two identical lenses of about 12-25 cm focal length may be held before the eyes to view the photos in stereo if a viewer is unavailable.) In the following discussion, the interpretations are based on first-hand observations and the analysis of a large group of original photos by the authors.
Flow Visualization Techniques and Results Kerosene-Lampblack Surface Streak Traces
Mixtures of oil and various pigments, especially fluorescent dyes, have been used for many years to visualize the limiting streamlines on the surfaces of wind tunnel models.8 While generally effective, this technique still suffers drawbacks for certain test conditions. Specifically, an oil film often remains wet throughout a test and smears upon tunnel shutdown. One must consequently photograph the streak pattern during the test through available tunnel windows, which introduces optical distortion and resolution loss. Further, a buildup of oil often occurs at flow separation lines which can produce anomalous patterns due to competing wall shear and pressure gradient induced buoyancy forces. 9 Alternate surface streak methods have been used to avoid these problems. For example, the oil carrier fluid has been replaced by a more volatile petroleum distillate such as kerosene, 10 which evaporates entirely. However, the photographic difficulties remain unless the test model is removed from the wind tunnel, or unless some means 11 other than photography is used to record the streak patterns.
MARCH 1983
SEPARATED 3-D SHOCK WAVE/TURBULENT BOUNDARY LAYER
Settles12 has developed a version of the .surface streak method which is particularly suited to blowdown facilities and 3D flow studies. A volatile carrier fluid is chosen such that the streak pattern forms and dries before the airflow is stopped. The very thin coating of pigment remaining on the surface is then lifted off and preserved using ordinary transparent adhesive tape. This method eliminates camera parallax, flow interference due to liquid accumulation, and pattern smearing on shutdown. It yields immediate results without photographic processing and provides full-scale, highly detailed traces of the surface flow features. Direct measurements of separation distances, etc., can be made from such traces with an accuracy of order 1A mm. Quantitative measurements of this sort have been instrumental, for example, in revealing the scaling law for Reynolds number effects on 3D interactions.6'7 Figure 2 shows an example of such a trace obtained from a swept compression corner flow at the present test conditions. In Fig. 2, the incoming turbulent boundary layer appears as a grey region with fine stream wise streaks. These str,eaks turn outward at the beginning of the interaction, which apparently interferes with the pigment deposition mechanism to form a region of lighter shading. Immediately thereafter, a dark line of pigment marks the confluence of surface streaklines which is the mean 3D separation line. The streaklines are visible within the separated region and downstream of reattachmerit as well. . •• . While kerosene is an appropriate carrier fluid for streak traces at the present test conditions, fluids of different volatility are required for significantly different values of static pressure and wall temperature. Slow-starting continuous tunnels pose an additional problem for this technique,
391
which can sometimes be overcome by choosing a grease carrier which melts only when the tunnel reaches its operating temperature. The pigment can be any finely divided powder such as lampblack or colored paint pigment. For present purposes, microscopic observation reveals that the deposited lampblack particles are typically in the range of a few jum or less, which is at least an order of magnitude smaller than the sonic and viscous layer heights of the high Reynolds number turbulent boundary layer. The pigment-to-carrier mixture ratio is typically 1:4 by volume for supersonic flows at moderate Reynolds numbers, but may need to be 1:2 or more for flows with especially high wall shear. This mixture is spread in a band on the wind tunnel wall at least several cm upstream of the area to be visualized. Upon starting the tunnel, the mixture flows over the test surface, forms a streak pattern, and dries. A large rectangle of Scotch Magic Transparent Tape (available in 20 cm x 66 m rolls from 3M Corp.) is then pressed carefully over the pattern and rubbed vigorously. The streak pattern is removed and preserved by peeling off the tape and pressing it onto white paper. With practice, one can even remove streak traces from complex geometrical shapes by this method. Although this kerosene-lampblack surface streak method is straightforward and useful, it still suffers the generic limitations of all surface visualizations: It has no frequency response, so it is apt to yield misleading patterns in highly unsteady flows. Further, it gives no information on the flow structure away from the surface. Thus additional visualization methods are needed to fully explore complex 3D flows. Localized Vapor Visualization
ACETONE INJECTION TUBE PRESSURE TAPS AT APEX SIDE FENCE
TUNNEL "FLOOR
/ REATTACHMENT LINE SEPARATION LINE Fig. 1 Sketch of swept compression corner test geometry and notation.
Fig. 2 Kerosene-lampblack surface^streak trace for A = 60 deg; A is the apex, C the corner, R the reattachment, and S the separation.
Vapor-screen methods13'8 are used occasionally to visualize high-speed flow structures away from test surfaces. Water is typically added to the air stream of a continuous closed-circuit wind tunnel and the visualization is achieved through the scattering of a narrow sheet of light. ("Vapor" in this context refers to a fine aerosol fog of condensed moisture.) The technique is never straightforward, but the authors have found that it is especially problematic in intermittent blowdown facilities. Related techniques involving powder14'15 and smoke16'17 injection have had limited success. Smoke visualization is a powerful tool at low speeds (e.g., Ref. 18) and at high speeds in inviscid flow,16'17 but it has not succeeded in supersonic turbulent boundary layers due to high diffusion rates and high-frequency random motions. The authors have developed a new technique of localized vapor visualization which overcomes many of these problems. No attempt is made to seed the entire flow with vapor, just a local region of interest. A volatile liquid is injected into this region through a surface pressure tap or other suitable orifice. The liquid is then atomized by the flow, generating a dense fog which can be seen and photographed under suitable lighting. This technique proves' especially useful for visualizing the structure of 3D flow separation. The key to this localized vapor technique is the choice of the liquid injectant, which should have a vapor pressure near the local mean static pressure of the flow under study. The relative importance of boiling and atomization in generating an aerosol from the injectant is not clear, but low values of injectant viscosity and surface tension appear to be desirable as well. Given static pressures below atmospheric and temperatures near ambient, a range of hydrocarbon solvents provides suitable choices for the injectant. The required injection rate is too small to create any health or explosion hazard with these substances. For the present wind tunnel static pressure of 21 kN/m 2 it was found that acetone (having an ambient vapor pressure of 25 kN/m 2 ) is the most suitable injectant liquid.
392
G. S. SETTLES AND H.-Y. TENG
The liquid can be injected into the airstream in various ways. For example, choosing a pressure tap upstream of the shock/boundary-layer interaction results in the liquid streaming along the test surface while atomizing, creating discrete aerosol filaments which leave the surface if they encounter flow separation. If injected inside a relatively lowspeed separation zone, the liquid breaks up into fog, then follows the local flow direction. It is possible to "fill" an entire 3D separation zone with vapor by injecting acetone through a 3-mm tube located at the apex of a swept corner model, as shown in Fig. 1. No injection equipment is required in any of these cases, since the liquid is simply sucked in by the subatmospheric tunnel static pressure. A valve in the feedline can be used to control the injection rate. The aerosol thus generated is visualized through Mie scattering of incident light rays. The illumination can be in the traditional form of a light sheet, or it can be general illumination by continuous or stroboscopic means. Stroboscopic lighting is especially useful in "freezing" the instantaneous turbulent structure of the flow, the 1-10-jLts flash from a General Radio Type 1531 "Strobotac" being sufficient to stop the motion and provide adequate light intensity as well. To create a suitable light sheet the authors expanded the beam of a 1-W argon-ion laser with a cylindrical lens, or else used a 150-W slide projector with a narrow slit in the slide holder. With general illumination, the best results are obtained by backlighting, aiming the strobe roughly along the swept corner line and viewing the scattered light through the opposite tunnel side window. In all cases the results are improved if an antireflective coating is applied to the model beforehand. No elaborate photographic equipment is required for localized vapor visualization; a 35-mm camera works well for still photos. Stereoscopic photos of the 3D flow structures were made using tandem Polaroid 110 cameras with a 20-deg parallax angle. Typical stereo pairs were taken simultaneously with,the room lights out, both shutters open, and a single strobe flash.
Fig. 3 Visualization of 3D separated flow region for A = 40 deg, using vertical streamwise light sheet and acetone injection through apex tube.
AIAA JOURNAL
Figure 3 shows the result of acetone injection at the apex of a compression corner with a 40-deg sweepback angle. The illumination is a continuous vertical streamwise light sheet of about 2 mm thickness, which is seen intersecting with the tunnel floor ahead of the separation point at the midspan position. This visualization clearly shows the 3D flow separation point and reattachment zone, as well as the extent of the separated region above the test surface. The indicated separation point agrees with that of the corresponding kerosene-lampblack trace within 3%. The same flow under general stroboscopic illumination is illustrated by the stereo pair of Fig. 4. This volume visualization reveals that a fraction of the acetone injectant vaporizes immediately upon entering the flow at the model apex, whereupon it is caught up by the supersonic flow and swept downstream. The remainder of the acetone flows out along the 3D separation line, atomizes, and fills the separated region. The stereoscopic view clearly reveals the boundary layer separation ahead of the swept compression corner. (Note that dotted white lines have been painted on the test model at the mean separation and reattachment lines previously determined from kerosene-lampblack traces.) Figure 4 also reveals the turbulent eddy structure within the 3D separation zone, which is sufficiently strong to mask the mean motion that exists there. Attempts to observe the mean motion using videotape and high-speed film failed for lack of an adequately fast framing rate, which is estimated to be at least 30,000 frames/s. However, the videotape records taken with stroboscopic illumination do shed some light on the extent of unsteadiness of the 3D separation line. This is possible because the boiling liquid in the test surface has some frequency response, unlike surface-streak methods. The results indicate that the band of separation-line unsteadiness is a fraction of the incoming boundary-layer thickness in streamwise extent. The instantaneous "ragged" appearance of separation is revealed in Fig. 4. Figure 5 shows the result of acetone injection through pressure taps upstream of the two-dimensional (2D, X = 0 deg) compression corner model. In this case discrete vapor filaments are seen in the bottom of the incoming boundary layer and the detached shear layer above the separation zone, yielding a visualization which agrees with the results of previous flowfield surveys.19 (Note that the aerodynamic fence nearest the observer easts an oblique shadow across the separated region, making the aerosol filaments appear to be of unequal length.) A similar result is shown in Fig. 6, wherein the acetone injection conditions are the same but the compression corner is swept back through X = 60 deg. By this.means it was verified that boundary-layer separation occurs in all of the 3D interactions covered in this paper. In each case the localized vapor visualization closely agrees with the kerosenelampblack surface streak traces on the locations of 3D separation lines and reattachment zones. Further, the
Fig. 4 Stereo pair for A = 40 deg with acetone injection through apex tube and general stroboscopic illumination.
MARCH 1983
SEPARATED 3-D SHOCK WAVE/TURBULENT BOUNDARY LAYER
393
Fig. 5 Stereo pair for A = 0 deg (2D corner) with acetone injection through upstream pressure taps.
Fig. 6 Stereo pair for A = 60 deg with acetone injection through upstream pressure taps.
detached vapor filaments deviate only a few degrees from the stream wise direction even in highly swept interactions, confirming earlier observations5'20 that spanwise flow occurs only very near the surface in these 3D interactions. Since this new localized vapor visualization technique involves the injection of a foreign substance, it has the potential to disturb the flow under study. To evaluate this, interference tests were carried out for three compression corner cases: X = 0, 40, and 60 deg. Streamwise surface pressure distributions were measured with and without acetone injection and compared, as shown in Fig. 7. For the 2D case, a moderate injection rate of 0.05 ml/s was sufficient to visualize the flow without causing any noticeable interference. However, injection at ten times that rate did cause a local increase in the upstream influence length of the interaction, A highly swept flow appears less susceptible to such disturbance (Fig. 7b), since injection rates up to 5 ml/s produced insignificant changes in the surface pressure distribution. Thus, while indiscriminate injection can disturb the flow, it was always possible to modulate the acetone injection so as to achieve a useful visualization without flow interference. In cases where interference was observed, it was never of a disastrous nature. Nonetheless, it may be a useful technique to probe the "disturbance sensitivity" of various flows by injecting a volatile fluid through selected pressure taps and watching for changes of character in the flowfield. Stereoscopic Schlieren
So far the techniques presented here have only been those which visualize the flow at or near the test surface, but do not reveal the shock wave structure of a 3D interaction. Since traditional shadow and schlieren techniques do not yield 3D information, stereoscopic schlieren methods21"23 have been developed for this purpose. These methods involve rotating a phenomenon within a fixed schlieren beam, rotating the beam with respect to the phenomenon, or else using separate schlieren beams to obtain parallax views. Unfortunately, these approaches are difficult to implement in wind tunnel
studies and they often preclude obtaining simultaneous stereo views of unsteady phenomena. The authors have found a simpler embodiment of stereoscopic schlieren which is effective for 3D interaction studies. As shown in Fig. 8, illumination is provided by a large front-lighted background screen rather than the usual concentrated light source. This background is viewed through the wind tunnel test section by the tandem cameras described earlier. Since the cameras are sharply focused ori the swept compression corner model in the test section, the background (which may be either a grid or a single light-dark boundary aligned roughly parallel with the shock system) is defocused due to the limited camera depth-of-field. Given a sufficient distance L between the background and the test section, flowfield features become visible by virtue of their distortion of the background illumination. Further, depth information is recorded by the stereo cameras since they view the background distortion from different angles. Actually, this technique is the stereoscopic generalization of a simple schlieren method first suggested by Schardin.24 He included this method in the broad class of schlieren instruments even though no explicit knife-edge cutoff is used. Instead, the method is the logical equivalent of a classical To'pler schlieren arrangement with the knife-edge removed and a defocused grid inserted before the test area in the optical train. Such arrangements with background grids have been used monocularly in rocket sled, ballistic, and explosion photography where conventional schlieren optics are inappropriate.25 For present purposes the arrangement shown in Fig. 8 has some advantages. It is simple and inexpensive, since large, high-quality optics are not involved. More importantly, the greatly extended background light source provides a wide range of observation angles for viewing complex 3D flow features. It is a simple matter to change the viewing angle by moving the stereo cameras, and appropriate viewing angles can be found by visual observation during a test. Further, instantaneous stereo views can be photographed by the simple means of stroboscopic rather than continuous backlighting. Against these advantages one must weigh a reduced optical
394
G. S. SETTLES AND H.-Y. TENG
AIAA JOURNAL BACKGROUND GRID
FLOODLIGHT
SHOCK WAVE
TUNNEL FLOOR SEPARATION-INDUCED SHOCK
%
CAMERAS'VIEW
Fig* 8 Sketch of experimental arrangement for stereoscopic schlieren, showing shock wave shape for X = 20 deg.
separation-induced shock in the near field, and a conical shock from the model apex in the far field of view. Based on this information one can sketch the shock shape as shown in simplified form in Fig. 8. At this low sweepback angle the interaction achieves cylindrical symmetry after a certain inception length along the sweep line, a fact that is confirmed by corresponding kerosene-lampblack streak traces. If one idealizes the dividing streamline of the cylindrical separation zone as a plane connecting separation and reattachment in the streak traces, then the resulting flow deflection angle closely agrees with that required to produce the observed separation shock in Fig. 9. Conical Shadowgraph
Fig. 7 Mean streamwise pressure distribution along center tap row with various acetone injection rates; a) A = 0 deg, injection through upstream tap, b) X = 60 deg, injection through apex tube.
sensitivity compared to conventional schlieren methods and the disadvantage of nommiform background illumination. An example of the stereoscopic schlieren photos taken with the arrangement of Fig. 8 is shown in Fig. 9. This 20-deg swept corner model produces strong optical disturbances in the flowfield which do not require high sensitivity, so a simple light-dark boundary was used in the background instead of a grid. (The irregularly shaped bright spot in the background was cast on a projection screen by a slide projector. The slide consisted of a mask with its lower edge cut to correspond with the tunnel floor and model face boundaries.) The results, when viewed stereoscopically, show the model face, the boundary-layer separation ahead of the corner, a
While cylindrical symmetry is observed at low sweepback angles, the more highly swept compression corner interactions develop conical symmetry.5'7 Here, stereoscopic schlieren photography is defeated due to the limited viewing angle through the wind tunnel windows. Instead, one can apply the conical shadowgraph principle26'28 illustrated in Fig. 10. Conical shadowgraphy requires that a spatially coherent light source be placed at the vertex of a conical flow, which approximately corresponds to the model apex in the case of a highly swept compression corner. Both the light beam and the shock wave structure are conical in nature, so the rays are everywhere roughly parallel to the waves. This was accomplished by inserting a codxial cable through the tunnel sidewall and terminating it at the model apex with the. miniature spark gap illustrated in Fig. 10. When triggered by a 26-/xF capacitor discharge at 2000 V, a powerful spark jumps from the needle to the disk of the spark gap and emits light through the 0.5-mm pinhole. The resulting conical light beam traverses the shock/boundary-layer interaction and casts a shadowgram on the opposite wind tunnel wall. An adjustable view camera is used to record this shadowgram through the tunnel window nearest the model apex. Several measures are required to insure the success of this technique. For example, the tunnel sidewall acts as a reflecting screen and needs to possess a reasonable optical gain. While flat white paint may suffice, a commercially available retroreflective paint can be used to advantage.29 The oblique viewing angle of the camera introduces distortion which can be partially corrected by tilting the lens and the film plane. One can then use a photo of a sheet of graph paper on
MARCH 1983
SEPARATED 3-D SHOCK WAVE/TURBULENT BOUNDARY LAYER
395
Fig. 9 Stereo schlieren pair corresponding to Fig. 8.
CABLE
TUNNEL SIDE WALL TUNNEL FLOOR SEPARATION-INDUCED SHOCK
Fig. 10 Sketch of experimental arrangement for shadowgraph, showing shock wave shape for X = 40 deg.
conical
Fig. 11 Conical shadowgraph corresponding to Fig: 10.
the tunnel wall as a reference frame to correct the remaining distortion in the darkroom. Figure 11 is a conical shadowgram for the X = 40-deg swept corner case. It reveals that the 3D shock system is not radically different from the 2D case except for its conical nature. The merging of the separation-induced shock with compressions from the vicinity of flow reattachment is clearly shown. One can also see some indication of the turbulence in the separated shear layer and the reattached boundary layer. A sketch of the observed shock structure for this A = 40-deg
case is included in Fig. 10. Given the constraints of tunnel geometry, the conical shadowgraph method used here provides information which would be difficult or impossible to obtain by other means. Further insight into the character of these 3D interactions is gained by comparing the results of the conical shadowgraph with information obtained by other means. In the A = 60-deg case, for example, both the measured surface pressure distributions and the kerosene-lampblack traces show a conical development of the flow separation region with span wise distance from the model apex. In conical coordinates, the initial pressure rise and the initial disturbance of the surface pattern agree with one another and with the origin of the separation-induced shock seen in the conical shadowgram. Further, the observed main shock angle of 38 deg in the shadowgram is, in fact, the shock angle which would be formed by a circular cone with a 28-deg half-angle at M 00 =2.93. This indicates that the a = 24-deg, A = 60-deg swept corner model is roughly equivalent to one quadrant of a circular cone with a half-angle between 24 and 30 deg (= 90 ! deg -A). Particle Tracer Methods
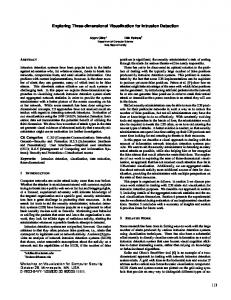
In the process of taking conical shadowgrams with the spark gap of Fig. 10, it was noticed that the spark plasma tends to erode the pinhole, thus injecting incandescent metal particles into the flow. For A>20 deg the span wise flow carries these particles across the separation regions of the swept corner interactions. This observation opened the possibility that such incandescent particles might be useful as tracers of streamlines in the separated flow. Self-luminous particle tracers have been used before,30"32 but mainly for low-speed flows. They provide a great advantage in photographic contrast, especially at high speeds, since no background illumination is needed. As illustrated in Fig. 12, it was possible to take clear stereoscopic photographs of the incandescent particle tracks with no difficulty. Unfortunately, there are some problems in interpreting the results. A microscopic examination of some captured particles revealed that theyxrange in size from about 5 to 100 jum. The largest particles clearly do not follow the flow properly, but their paths are the most obvious in the photographic results. While one disregards these large-particle paths, there is no proof that^even the smaller particles are following the flow adequately. This technique is thus essentially qualitative and possibly .error prone,- pending further development. Nonetheless it is attractive as a straightforward and graphic visualization possibility for complex separated flows, assuming that its validity can be established firmly. Comparing Fig. 12 with Figs. 4 and 6 reveals that the incandescent particles do not respond to instantaneous turbulent fluctuations. However, the particle paths in Fig. 12 do appear to reveal a mean vortical motion in the 3D separation zone. Note that this apparent vortex rollup is highly stretched in the span wise direction for A = 60 deg. In addition to incandescent particles, various nonluminous particles were also injected into the flow through the apex
396
G. S. SETTLES AND H.-Y. TENG
AIAAJOURNAL
Fig. 12 Stero pair showing incandescent particle paths for X = 60 deg (time exposure).
The results have contributed to the understanding of the class of flows under study by providing the following useful information: 1) accurate and detailed records of mean separation lines, reattachment zones, surface streak angles, etc.; 2) positive evidence of 3D boundary-layer separation at the streak convergence lines indicated in the surface flow patterns; 3) indications of the extent of 3D separated flow above the test surface; 4) information on the shock wave structure of moderately and highly swept flows (not readily available by any other, means); and 5) limited evidence of mean vortical structures in 3D flow separation zones.
Acknowledgments Fig. 13 Millisecond flash photo showing plastic microsphere paths forX = 60deg.
tube shown in Fig. 1. These experiments met with limited success. Fine powders such as lampblack*14 and talc15 failed to be visible in the high-speed turbulent flow due to inadequate photographic contrast. Larger, crystalline substances such as sugar were more successful. The best results were obtained by injecting plastic microspheres with sizes ranging from about 5 to 100 jim. Figure 13 is a photograph of microsphere seeding in the flow separation zone of the X = 60-deg swept corner model. Once again a mean vortical structure appears to be visible here, the sense of the rotation being clockwise. Unfortunately, > photographic contrast poses a persistent difficulty with this technique, and several trials are often required to optimize the ratio of microsphere light-scattering to background reflection. A potential solution to the contrast problem is laserinduced fluorescence.33'34 Particles or microspheres colored with a suitable dye can be made to fluoresce at a different optical wavelength than the incident laser light. A selective filter over the camera lens is then used to eliminate the troublesome background illumination. While experiments at the Gas Dynamics Laboratory indicate that a powerful laser is required, the above results do show that such particle visualizations in high-speed turbulent flows are feasible under the proper conditions. ,
Conclusions A collection of useful techniques is presented here for visualizing 3D separated turbulent flows at high speeds. These techniques include surface streak traces by novel means, localized vapor visualization, simplified stereoscopic schlieren photography and conical shadowgraphy, and both luminous and nonluminous particle tracers. The techniques were demonstrated using a series of swept compression corner models at M~3 and high Reynolds number (part of the current research program in 3D shock/boundary-layer interactions at the Princeton University Gas Dynamics Laboratory).
We gratefully acknowledge helpful discussions with Professor S.M. Bogdonoff and the assistance of R.B. Gilbert, G.J. Katona, and W.L. Stokes with the experiments. This work was supported by the U.S. Air Force Office of Scientific Research under Contract F49620-80-C-0092, monitored by Dr. J.D. Wilson.
References !
Merzkirch, W., Flow Visualization, Academic Press, New York, 1974. 2 Asanuma, T., * 'Recent Flow Visualization Studies," Proceedings of the 13th International Congress on High Speed Photography and Photonics, Tokyo, 1978, pp. 174-185. 3 Holder, D.W. and North, R.J., "Schlieren Methods," British NPL Notes on Applied Science, No. 31, Her Majesty's Stationery Office, London, 1963. 4 Oskam, B., Vas, I.E., and Bogdonoff, S.M., "Mach 3 Oblique Shock Wave/Turbulent Boundary-Layer Interactions in Three Dimensions," AIAA Paper 76-336, July 1976. 5 Settles, G.S., Perkins, J.J., and Bogdonoff, S.M.,."Investigation of Three-Dimensional Shock/Boundary-Layer Interactions at Swept Compression Corners," AIAA Journal, Vol. 18, July 1980, pp. 779785. ' «' 6 Settles, G.S. and Bogdonoff, S.M., "Scaling of Two^ and ThreePimensional Shock/Turbulent Boundary-Layer Interactions at Compression Corners," AIAA Journal, .Vol. 20, June 1982, pp. 782789. 7 Teng, H.-Y. and Settles, G.S., "Cylindrical and Conical Upstream Influence Regimes of 3D Shock/Turbulent Boundary-Layer Interactions," AIAA Paper 82-0987, June 1982. 8 Maltby, R.L., ed., "Flow Visualization in Wind Tunnels Using Indicators," NATO AGARDograph 70, April 1962. 9 Chapman, D.R., Kuehn, D.M., and Larson, H.K., "Investigation of Separated Flows in Supersonic Streams with Emphasis on the Effect of Transition," NACA Report 1356, 1958. 10 Gough, M.N. and Johnson, E., "Methods of Visually Determining the Airflow Around Airplanes," NACA TN 425, July 1932. ^ !1 Spaid, F.W. and Frishett, J.C., "Incipient Separation of a Supersonic Turbulent Boundary Layer, Including Effects of Heat Transfer," AIAA Paper 71-114, Jan. 1971. ; 12 Settles, G.S., "An Experimental Study of Compressible Turbulent Boundary Layer Separation at High Reynolds Numbers," Ph.D. Dissertation, Appendix B, Aerospace and Mechanical Sciences Department, Princeton University, Princeton, N.J., Sept. 1975. 13 Alien, H.J. and Perkins, E.W., "A Study of the Effects of Viscosity on Flow Over Slender Inclined Bodies of Revolution," NACA Report 1048, 1951.
MARCH 1983
SEPARATED 3-D SHOCK WAVE/TURBULENT BOUNDARY LAYER
14
Emery, J.C., Barber, J.B., and Stewart, J.R., "Flow Visualization of a Secondary Jet by Means of Lampblack Injection Techniques," AIAA Journal, Vol. 5, May 1967, pp. 1039-1040. 15 Page, R.H. and Przirembel, C.E.G., "Techniques for Visualization of Separated Flows," Proceedings of the International Symposium on Flow Visualization, Tokyo, x 1977, Hemisphere Publishing Corp., Washington, D.C., 1978, pp. 315-320. 16 Stahl, W., "Zur Sichtbarmachung von Stromungen um schlanke Deltaflugel bei hohen Unterschallgeswindigkeiten," German Report DFVLR-AVA-70-A-45, Oct. 1970. 17
..
:
Batill, S.M., Nelson, R.C., and Mueller, T.J., "High Speed Smoke Flow Visualization," U.S. Air Force Flight Dynamics Laboratory Report AFWAL-TR-81-3002, March 1981. 18 Head, M.R. and Bandyopadhyay, P., "New Aspects of Turbulent Boundary-Layer Structure," Journal of Fluid Mechanics, Vol. 107, 1981, pp. 297-338.
-v19Settles, G.S., Vas, I.E., and Bogdonoff, S.M., "Details of a Shock-Separated Turbulent Boundary Layer at a Compression Corner," AIAA Journal,Vol, 14, Dec. 1976, pp. 1709-1715. 20 Kussoy, M.I., Viegas, J.R., and Horstman, C.C., "Investigation of a Three-Dimensional Shock Wave Separated Turbulent Boundary Layer," ,47.4,4 Journal, Vol. 18, Dec. 1980, pp. 1477-1484. 21 Lyot,^B. and Francpn, M., "Observation des Defaut de Poli et Homogeneite au Stereoscope par la Methode du Contraste de Phase," Revue d'Optique, Vol. 27, 1948, p. 397. 22 Hett, J.H., "A High-Speed Stereoscopic Schlieren System," Journal of the Society of Motion Picture Engineers, Vol. 56, 1951, p. 214.
23
Veret, C., "La Strioscopie Stereoscopique," La Recherche Aeronautique, No. 29, 1952. 24 Schardiri, H., "Die Schlierenverfahren und Ihre Anwendungen," Ergebnisse der Exacten Naturwissenschaften,Vo\. 20, 1942, pp. 303342; also NASA Technical Translation F-12,731, April 1970.
397
25
Dugger, P.H. and Hill, J.W., "A New Dimension in Front-Light Laser Photography," AIAA Journal, Vol. 10, Nov. 1972, pp. 15441546. 26 Love, E.S. and Grigsby, C.E., "A New Shadowgraph Technique for the Observation of Conical Flow Phenomena in Supersonic Flow and Preliminary Results Obtained for a Triangular Wing," NACA;
TN 2950, 1953.
27 Pierce, D. and Treadgold, D., "Some Examples of the Use of a Conical Shadowgraph Technique," British ARC CP-763, 1964. 28 Alekseev, V.N. and Gonor, A.L., "Optical Investigation of Three-Dimensional Supersonic Flow," Fluid Dynamics, Vol. 9, Jan.-
Feb. 1974, pp. 148-152. 29 O'Hare, I.E. and Strike, W.T., "Holographic Interferometry and Image Analysis in Aerodynamic Testing," AEDC-TR-79-75, Sept. 1980, pp. 24-26. 30 Mueller, T.J. and Goddard, V.P., "Smoke Visualization of Subsonic and Supersonic Flows," Proceedings of the International Symposium on Flow Visualization, Tokyo, 1977, Hemisphere Publishing Corp., Washington, D.C., 1978, pp. 87-92. 31 Gibson, D.J., "Scale-Model Flow Testing," Research/Development, Vol. 27, Nov. 1976, pp. 24-30. 32 Cady, W.M., "Velocity Measurements by Illuminated or Luminous Particles," High Speed Aerodynamics and Jet Propulsion, Vol. IX, Princeton University Press, Princeton, N.J. 1954, Article C.2, pp. 142-145. 33 Dewey, C.F. Jr., "Qualitative arid Quantitative Flow Field Visualization Utilizing Laser-Induced Fluorescence," NATO AGARD CP-193, Paper 17, 1976. 34 Zimmermann, M. and Miles, R.B., "Hypersonic-Helium-FlowField Measurements with the Resonant Doppler Velocimeter," Applied Physics Letters, Vol. 37, Nov. 15, 1980, pp. 885-887.
From the AIAA Progress in Astronautics and Aeronautics Series... TURBULENT COMBUSTION—v 58 Editedby Lawrence A. Kennedy, State University of New York at Buffalo Practical combustion systems are almost all based on turbulent combustion, as distinct from the more elementary processes (more academically appealing) of laminar or even stationary combustion. A practical combustor, whether employed in a power generating plant, in an automobile engine, in an aircraft jet engine, or whatever, requires a large and fast mass flow or throughput in order to meet useful specifications. The impetus for the study of turbulent combustion is therefore strong. In spite of this, our understanding of turbulent combustion processes, that is, more specifically the interplay of fast oxidative chemical reactions, strong transport fluxes of heat and mass, and intense fluid-mechanical turbulence, is still incomplete. In the last few years, two strong forces have emerged that now compel research scientists to attack the subject of turbulent combustion anew. One is the development of novel instrumental techniques that permit rather precise nonintrusive measurement of reactant concentrations, turbulent velocity fluctuations, temperatures, etc., generally by optical means using laser beams. The other is the compelling demand to solve hitherto bypassed problems such as identifying the mechanisms responsible for the production of the minor compounds labeled pollutants and discovering ways to reduce such emissions. This new clirriate of research in turbulent combustion and the availability of new results led to the Symposium from which this book is derived. Anyone interested in the modern science of combustion will find this book a rewarding source of information. 485pp., 6x9, illus. $20.00Mem. $35.00List TO ORDER WRITE: Publications Dept., AIAA, 1290 Avenue of the Americas, New York, N. Y. 10019