Audacity presents only one audio window to the user, offering no visual context. ... places a digital âlensâ over the data, allowing the user to zoom in on one area.
Focus-Plus-Context Audio Interaction Design David Gerhard� , Brett Park, and Jarrod Ellis Department of Computer Science � Associate, Department of Music University of Regina Regina, SK CANADA S4S 0A2 {gerhard,park111b,ellisjja}@cs.uregina.ca http://armadilo.cs.uregina.ca
Abstract. We present an audio browsing and editing paradigm that incorporates the “focus plus context” visual interaction metaphor. A traditional waveform is displayed in full, and an area of focus is dynamically re-calculated to provide maximum detail in-focus and minimum detail in-context. The interaction metaphor also simultaneously re-scales a frequency-domain display, with increased detail available in both time and frequency domains by means of sub-sampling and window overlap. Various methods for selecting focus, identifying focus, and transitioning between the focus and context display areas are presented, and advantages for typical audio interaction applications are discussed. A collection of these ideas has been implemented within an open-source audio editing environment, and a discussion of this implementation and the related issues is presented. Keywords: Human Centered Computing, Audio Interaction, Interface Design, Focus-Plus-Context.
1
Introduction
The standard interaction metaphor for editing digital audio presents a waveform which can be resized to any scale, from a single sample or sample-per-pixel representation to a display of the full waveform. Users interacting with such an interface may find that, depending on the work being performed on the waveform, a number of different scales are appropriate. For example, when correcting localized recording errors such as clicks and pops from a vinyl recording, the user may need to zoom in to the sample level; however, when mixing multiple parts, duplicating, or re-recording sections, a larger scale may be required. Regardless of the working scale, for anything longer than a single note or acoustic event, the user loses the context of the work being done when zooming in to a reasonably workable resolution. This is closely related to the problem of interactively navigating large information spaces in a limited context. Subsequently, most audio interaction software separates the global view of the raw waveform from its local view or focused portion. This involves multiple separate windows or “panes” to represent a single track of audio data, one for R. Kronland-Martinet, S. Ystad, and K. Jensen (Eds.): CMMR 2007, LNCS 4969, pp. 453–477, 2008. c Springer-Verlag Berlin Heidelberg 2008 �
454
D. Gerhard, B. Park, and J. Ellis
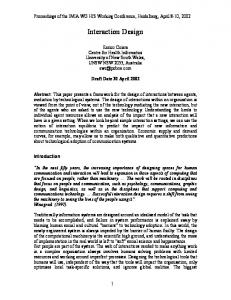
Fig. 1. Audio interaction window in Amadeus. A context pane is available, but it is outside of the user’s locus of attention, and presented at a different scale with no scale markings.
the local work site and one for the context or overview. This multiple-window metaphor is used in many other applications, and has been critiqued [2], [5]. Perhaps more problematic in the audio interaction realm is the loss of context when working with multiple tracks of audio simultaneously. Most current audio interface programs require the view to be focused at a consistent point across all tracks, effectively locking all tracks together and forcing a user to zoom out to a wider context to jump from one point to another in the project. Several improvements have been made to facilitate this process, including bookmarks, labels, hot-key zooming and complex navigation controls. Some programs even allow a user to be localized at a different point in multiple tracks, but these adaptations are primarily attempts to mitigate the difficulties of working in multiple focus levels in the same document. The user has to mentally assimilate these time-based domains, creating and maintaining a large mental model of the entire project at high cognitive expense. This can be particularly difficult when a project contains several portions that are acoustically similar, as is the case when mastering music with a repeating verse-plus-chorus structure. A user may think she is working on chorus 1 when she is in fact working on chorus 3, since the waveform visualization of both choruses look similar. There is no indication in the user’s Locus of attention[6] of the overall location of the work-point in the wider piece. Figure 1 shows an audio interface window from the program Amadeus 1 , typical of such interfaces. There are two panes showing audio information. The top pane shows the complete context of the audio clip, while the bottom pane shows the focused work area. There is a rectangular selection box in the context pane 1
http://www.hairersoft.com/Amadeus.html
Focus-Plus-Context Audio Interaction Design
455
Fig. 2. Audio interaction window in Audacity. No context window is available, and the user must create a complete mental model based only on the relative time and duration shown on the display.
that both selects and indicates the area of the focus pane. The scroll bar at the bottom of the window indicates, in a minimal way, the overall location and context of the focus window. The “Horizontal zoom” slider is a second way to change the amount of audio data in the focus window. Complete information about the context of the focused area is not presented, and a user must look at three separate interface elements to get a complete picture. Although the context is presented, it is not in the user’s locus of attention and the user must either consult the context pane (thus leaving the focus pane) or maintain a mental model (at cognitive cost). Figure 2 shows an audio interface window from the program Audacity 2 , a popular open source cross platform audio editor which presents similar problems. Audacity presents only one audio window to the user, offering no visual context. The location of the focus window in the larger sound file is displayed numerically both in a ruler-bar at the top of the window and in a series of text boxes at the bottom of the window. The user must maintain a mental model of the local context of the part they are working on. Figure 3 shows a spectrum window from Amadeus. In this case, any familiarity the user might have acquired interacting with the time-window is lost since the frequency window is significantly different. The contextual information is gone, replaced with a localized and aligned version of the time waveform. Context is critical in audio editing and manipulation. While most of the existing audio editing software attempts to inform the user of the overall context using cues such as numerical ranges or context windows, it remains cognitively expensive to maintain a mental model of the piece being viewed. 2
http://audacity.sourceforge.net/
456
D. Gerhard, B. Park, and J. Ellis
Fig. 3. Spectrogram display in Amadeus. There is no context pane, as the waveform displayed is aligned with the spectrogram.
1.1
The Detail-In-Context Problem
Alan Keahey[3] describes the detail-in-context problem thus: “How can we effectively utilize the additional space made available by any nonlinear magnification transformation to enhance the visualization of the data or objects located within that space?” Physical high-resolution presentations of information, such as printed photographs or line drawings, allow the user to examine an area of interest in more detail by looking closely or even magnifying the area with a lens. Traditional film photographers have decried a lack of low-level detail in digital print images, since film resolution theoretically goes to the level of granularity in the film itself. There is an inherent multiresolution aspect to these physical presentations, but when information is presented digitally, the ability to zoom in to an area of interest is affected. On-screen, view magnification is performed digitally and the limitations of magnification are shifted to the limits of the information contained within the displayed data itself. The drawback of this is that the context of the magnification is also removed. When a viewer uses a magnifying lens to look at an area of a photograph, the entire photograph is still within the viewer’s perception. When a user zooms in to a digital image, the context is immediately lost. The user does not know which portion of an image is being considered, unless they were present when the zoom took place, and even then the user must maintain, at cognitive expense, a mental model of the entire data space and the context of the area being considered. Most data interfaces that support zooming also present a “context” or overview as a second display, but since this information is not presented in the user’s locus of attention, the user may not incorporate this information into their mental
Focus-Plus-Context Audio Interaction Design
457
model. Further, an additional window for context adds to “palette clutter,” taking screen-space away from the primary data. A solution to this problem is the non-liner magnification transform, which places a digital “lens” over the data, allowing the user to zoom in on one area while maintaining the overall context. “Focus plus context” (FPC) is one of many terms used to describe such zoomable display systems employing continuous nonlinear magnification transformations [4], [8], [9]. Terms such as detail-in-context, polyfocal projection, fisheye [7] and distortion-oriented presentation have also been used. FPC displays present both a focus area and the wider context in the same window. The user does not have to switch between looking at different panes, nor does she need to maintain a mental model of the context. In FPC displays, the metaphor of the magnifying glass is taken several steps beyond the isolated bounds of the focal lens. Nonlinear transformations provide varying levels of detail in the surrounding context, providing more focused detail for visually perceptive purposes. Using the multi-window approach in audio display analysis, the user must judge the relative position of the focal region using limited visual cues in the global context. Using an FPC display would eliminate the need for this difficult perceptive judgment. FPC versus magnification overlays. There are three ways to display FPC information. The first way is to create a focal area and contract the contextual area in order to make room for the focal area. This method makes sure that all of the context information is displayed. As a side effect, it is often harder to code and slower to display as the context information needs to be altered whenever the focal point is moved. The second way to create a focal area is to have the focal area cover up some of the context area. This allows for quicker and more efficient code to be written as the context area does not have to be recalculated. A good example of this method is the magnifying glass option in Apple’s Aperture3 program. The third way to create a focal area is to split the context area and shift each side away from the focus area, leaving sufficient room between the two context areas. The dock on the Mac OSX4 (see Figure 4) is a good example of this. As a focal point is selected, the context information is moved outward in order to compensate for the larger focal point. 1.2
Current Focus-Plus-Context Applications
Aside from dock magnification in Mac OS X, there are very few mainstream examples of FPC applications. Zoomable user interfaces (ZUIs) are an attempt to provide a context-specific view of larger data spaces by allowing the user to zoom in on a subspace of a display. The most common example of a ZUI is the Virtual Desktop metaphor, where each desktop is a subset of a larger set of 3 4
www.apple.com/aperture http://www.apple.com
458
D. Gerhard, B. Park, and J. Ellis
Fig. 4. Dock magnification in Macintosh OS X
desktops, shown in a contextualized window. While this does constitute an FPC display, it shares the same problem of other systems, in that the context for the focus is not within the user’s locus of attention and instead is presented as a second, separate view of the full context, often requiring a command to make the virtual desktop set visible. This means that the user must maintain a mental model of the complete virtual desktop context in order to know which desktop to use at what time.
Fig. 5. An example of the virtual desktop metaphor overlayed on top of a normal desktop display. The context is brought into view with a hotkey combination.
A classic example of a “stronger” version of a zoomable user interface is the Pad++ interface[1] developed by the University of Maryland Computer Science department, but no longer actively being worked upon. Pad++ is like a virtual desktop environment, but it allows for multiple views and varying scales. The idea behind Pad++ is to provide the user with the ability to navigate large amounts of data using an FPC transformation method for semantic magnification. Some issues with Pad++, mentioned by the authors, are a lack of customization for sizes of objects (or nodes) with no location constraints and no animation between magnified transitions. Transitions are immediate and abrupt, giving no visual cues to the user as to what object has been magnified. One benefit of Pad++ is its ability to use multiple foci on the same data. Persons with visual disabilities have varying specific needs when it comes to presenting data at readable resolutions. Many current operating systems provide an accessibility feature which allows the user’s display to be zoomed in to varying levels of magnification. The focus window is centered on the mouse, and moves around the (virtual) user interface with the mouse movements. The advantage
Focus-Plus-Context Audio Interaction Design
459
is that the entire display is enlarged by the same amount (rather that only increasing font size, for example), however, there is no context presented, and the user must maintain a mental model of the underlying environment. More and more, web browsers and other traditional applications are being offered on mobile devices with very small screens. Previous attempts at rendering web content on small screens has been most successful with so-called “mobile content,” alternative versions of websites designed for smaller screens. There are two main difficulties with this implementation: First, the familiarity that a user develops with the normal version of a website is defeated by these smaller versions, making them difficult to navigate; and second, websites without these minimalist versions are rendered poorly by the mobile browsers. New browsers are being developed, including Apple’s mobile Safari and Microsoft’s Deepfish, which render a website as if it were on a large screen and allow the user to scroll around within a zoomed sub-view of the full rendered page. Once again, a lack of context requires the user to maintain a mental model of the page as they are maneuvering around within it. New interface paradigms such as multi-touch may reduce the cognitive load associated with non-contextualized focus applications, but this remains to be studied. 1.3
Pseudo-non-linear and Multi-level Mappings
The computational cost of nonlinear transformations has been prohibitive to implementing true FPC displays in the past, and while modern systems provide sufficient computational overhead, The need to dedicate significant processing power to implementing such transforms continues to be a barrier to mainstream usage. The transitions from focus to context do not have to be non-linear, however. With piece-wise discrete interfaces such as menus and icon displays, each element can be linearly scaled to a degree relating to the distance from the center of the focus, making an apparent non-linear zoom. This is the technique employed by dock magnification in Mac OS X described above, and it has been used in other contexts as well. Figure 6 shows an example of “text zooming,” where a large textual hierarchy, for example a menu or a document, can be navigated with the use of FPC magnification. Each menu item or word is a discrete object in the contextual space, and can be zoomed using the font size to indicate distance from the focus. While discrete elements can be zoomed with little computational cost, continuous information such as linear time audio data must be handled differently. Each pixel in the context image can be expanded into many pixels in the focus area, up to the maximal data resolution. Further, continuous data that does not have a natural analog must have overt indicators to describe the amount of focus and the type of transition between the focus window and the context. Because of this, a simple zoom of the data point is not possible—instead, a re-interpolation must be used to draw the data at higher resolutions in the focus window. Three methods of this re-interpolation are: multiple zoomed layers; linear interpolation; and non-linear transformation.
460
D. Gerhard, B. Park, and J. Ellis
Fig. 6. Text zooming for large lists
Fig. 7. One-dimensional FPC display using multiple zoomed layers
Multiple zoomed layers. Because the metaphor of discrete elements is prevalent in modern FPC implementations, it makes sense to begin with a translation of discrete elements into the continuous arena. The “multiple zoomed layers” approach consists of defining a focus region and constructing a set of concentric levels between the focus region and the underlying context (Figure 7). Each level is at a resolution between that of the focus and the context. Linear transformation. The next obvious transition is to draw a straight line from the focus area to the context area, and linearly transform the scale function across this line (Figure 8). This implementation is more complex, requiring a linear interpolation across a significant amount of data, but computationally this will add only minimal additional burden. The result is a smooth transition and a more natural localized structure for the focus window. Non-linear transformation. The most flexible but also most complex transform is to present a generalized nonlinear transition between the focus and the context area. In general, this means a single continuous function across the entire context space, but since the focus window display will need to be re-calculated at each shift of its location, it makes more sense to re-calculate only on the portion that is different from the initially calculated contextual backdrop. An example of a spherical transition is presented in Figure 9. As noted earlier, in an FPC display, the context can either be hidden, contracted, or spread out to make room for the data in the focus window. The
Focus-Plus-Context Audio Interaction Design
461
Fig. 8. One-dimensional FPC display using linear transformation
Fig. 9. One-dimensional FPC display using a spherical non-linear transformation
contraction method can be seen in the above diagrams. In each case, when the focus area is enlarged, the context area is reduced by a proportional amount to make room for the focus area. 1.4
Compressed Context Display
One of the fundamental issues inherent in the use of an FPC audio editing application is that the waveform in the context area for long tracks is compresses and lacks detail. When displaying an audio track longer than a few minutes, the detail of the waveform in the context area becomes difficult to see as each pixel represents a increasingly large time interval. This causes the waveform to look uniform in most places and only audio events that happen over several pixels (a large period of time) can be seen. This issue is caused for two reasons; the whole track must be shown for context, and the width of the computer screen is finite. There are two possible solutions to this problem, which involve modifications to the way the context is displayed. More and more, display devices are becoming available with higher resolutions than the standard 72 dpi of a workstation monitor. A first solution to the compressed context problem would be the use of such higher resolution displays. With higher resolution displays, the context area will contain more detail even if it is compressed, and the user will be more able to discern events of interest. A second solution would be to display the context area in such a way that it is less compressed. There are several alternatives for this method, including multi-line
462
D. Gerhard, B. Park, and J. Ellis
displays and multiple monitors. We propose a solution which involves drawing the context in a second dimension orthogonal to the focus area. This method, which we call “Horizontal Focus plus Vertical Context” is presented as future work in Section 5.1.
2
Focus and Context in Audio
There are a number of standard interaction paradigms for working with audio, many of which would benefit from an FPC interface of some form. We present a discussion of some of the inherent difficulties in such implementations, as well as some resolutions to these difficulties. 2.1
Audio Interfaces and Typical Tasks
As seen earlier in Figure 1, the typical audio interface displays a waveform at a single scale, with a vertical bar indicating the “play head” corresponding to the next sound that would be heard if the “play” button were clicked. Other standard interface elements include playback and selection controls. Users are able to select chunks of audio by indicating start and stop times or samples, or by dragging in the audio display window. Global track information is often presented in the form of muting, stereo panning and local sound characteristics. It is important to recognize that these indicators and track-level features are a holdover from the days of solid-state mixing boards, where each channel in the board corresponds to an audio input, with muting, soloing, trim, pan and other controls in a vertical stripe up the board for each channel. The audio interaction interfaces are designed to facilitate common tasks relating to recorded audio. Some of these tasks will be discussed here, along with how these tasks could be made easier with FPC displays. Splitting a large file. One of the more common audio tasks performed by the average user is transferring audio media from one format to another, usually from a physical audio format such as tape or vinyl to a digital format. The typical sequence for such a transfer is to attach the physical media player to the computer, start the media playing at normal speed and start recording, then walk away for half an hour. The nature of this task means that the transfer is real-time, and no time saving is available. Vinyl and Tape albums are often divided into tracks, and if these tracks are separated with silence, then some automated track segmentation can be done. This process can be easily frustrated by recording noise and live or continuous albums with no silence between tracks. The standard metaphor for splitting a large file into smaller tracks is to look at the full file, try to see where natural track splits might have occurred (by finding small low-energy areas in the waveform), zooming in to these areas, splitting the track, and zooming out to find the next one. The difficulties in this method are numerous: • not every low-energy area is a track break; • not every track break is low-energy;
Focus-Plus-Context Audio Interaction Design
463
• track breaks are best made at the sample level; • track breaks should incorporate fading out of the new track ending and fading into the new track beginning. Further, once a track break is made, the user must zoom out to the complete context and start to search for the next track break. FPC displays can help this process in many ways. When a user focuses on an area that they suspect is a track break, they can see immediately if it is a candidate or not, without having to zoom in. A medium-level context can be selected to more easily show the potential track breaks, and false positives can be more easily discarded without having to zoom in to verify. The user can manipulate the focus window until it corresponds with the desired fade in and fade out, and then execute a single command instead of selecting a break point and creating a fade-out and a fade-in. Soundtrack composition. When creating a soundtrack for a movie, television show or video, there are three components that are typically employed: ambience, foley and effects. Ambience is the underlying noise of the surroundings, such as street noise, office noise, or nature noise, depending on the surroundings in the video. Foley is the addition of sound samples which correspond to actions by actors or other objects in the scene. A classic example of foley is footsteps added to a scene after it has been shot. Foley is used because it is often very difficult to record sound events live, especially in wide shots. Foley is typically recorded in a studio as the video is played. Effects are similar to foley, but are not recorded live and are often taken from existing effects libraries, such as honking horns and telephone rings. Composing a soundtrack usually consists of interacting with multiple tracks simultaneously. FPC displays would allow a user to accurately manipulate the location of a foley sound within the context of the entire soundtrack without having to zoom in and out. Manipulating the location of a series of footsteps would be considerably easier. Further, a more natural correspondence between the audio and video representations can be maintained if the user does not have to continually zoom in and out to alter the location of an effect. Filtering and processing. Filtering and effects processing are common sound manipulation activities. Here, manipulations are applied to the entire file or to larger chunks of the piece being considered. Reverb, compression and equalization are examples of this type of task. In existing systems, the typical procedure is to apply the filter to a small subset of the sound file (often called a preview) to verify that the filter parameters are appropriate, then apply the filter to the entire piece. Application of a filter to a large sound file can take time, and normally the only feedback is a progress bar. Once the filtering is done, information is sometimes presented to the user to indicate whether there were any problems with the filtering, but the user usually must listen to the entire work to verify that the desired acoustic effect was achieved. An FPC display can help in this instance as well, to give an indication of the progress of the application of a filter. The full context of the file is displayed, and
464
D. Gerhard, B. Park, and J. Ellis
as the filter is applied to each local section, a focus window is traced across the file showing the application of the filter and the result, and the user can identify problems as they arise, or stop the filter if there is a problem. Traditional displays can follow along with the progress of the filter, but it is difficult and cognitively expensive to integrate the progress of the filter into a the context of the full file. Simple playback. Every sound editor is also a sound player, and in traditional interfaces the user has the option of watching the playhead slowly traverse the entire file or watching the zoomed-in waveform pass under a stationary playhead. FPC displays can enhance this process in much the same way as the following of filter progress described above. By following a focus window as it traverses an overall context, the user can see both what is happing at a low level and where the sounds are occurring at a higher level. This combines the two interface options for playback: the playhead remains in the center of the focus window, and the audio moves past it, while at the same time the focus window itself moves along the audio track, following the playback and displaying the audio which is about to be played and which has just been played. Breathers and other vocal editing. One of the classic vocal editing problems is the removal of “breathers,” or audible inhalations just before a sung or played musical phrase. Although the presence of breathers can be stylistically desirable (for example, in the piano recordings of Glen Gould, where Gould can be heard quietly humming along as he plays), many professional studios do what they can to remove breathers. The typical procedure is to examine the onset of each phrase in the vocal (or instrumental) line, detect breathers by observation of the waveform, or more typically the spectrogram, and then delete or filter out the breath noise using a fade in, noise removal or other technique depending on the surrounding noise. FPC techniques can make this process easier and more accurate by enhancing the spectral context of the breather, thereby confirming that the sound to be removed is the desired target. As before, finding events of interest within the timeline can be facilitated with the incorporation of FPC methods, which allow a user to examine the low level details of the editing without losing the context. Regardless of the task, there are two classic forms of information that are used to analyze and interact with audio: the time waveform and the spectrum. Several methods exist for converting from the time domain to the frequency domain, the most popular of which continues to be the Fourier transform. In the following sections, we will discuss FPC display issues surrounding both time-domain and frequency-domain displays.
3
Zooming Issues
In the early days of focus-plus-context research, investigators employed tricks to make a two-dimensional visual area appear to be warped in 3-D space. Computing power was at a premium, so simple graphical transformations were employed
Focus-Plus-Context Audio Interaction Design
465
to simulate the expansion of an area of focus. It might be tempting to look back on these methods and expect that with the rise of dedicated 3-D graphics processing units (GPUs), all one needs to do is map the visual area onto a 3-D surface and stretch the surface to provide a closer view of one area. The problem with this is that in order to provide sufficient focus detail, the surface would have to be stretched by a large proportion, leading to distorted contextual information. Orthogonal 3-D graphics views are typically optimized for a high degree of detail in the foreground with a less-detailed background, or in some cases a static image as a background. Rarely are the background and foreground connected in the way that an FPC display would require. In audio applications, there are two primary displays: the time waveform and the spectrogram. Both displays can benefit from FPC integration, and the following sections will describe the theoretical basis for zooming in time and in frequency. 3.1
Time Zooming
The time display of the waveform is perhaps the most prevalent audio display, being found in oscilloscopes and used in many movies and TV shows when it is required to show that someone is interacting with audio. There are typically two classical implementations of time waveform presentation, depending on the viewing range. When viewing large sections of audio, each pixel on the screen represents a range of time and the average energy in the waveform at that time. For smaller ranges, each pixel represents the waveform value at that time, either interpolated or sub-sampled to fill the range. The difficulty with perceiving a time waveform in isolation is that there are no perceptual cues to indicate the current scale. When viewing information that has familiar visual characteristics, such as a photograph, humans achieve a sense of scale by making use of perspective and falling back on familiar metaphors. We are familiar with, for example, the average size of a person, so when a visual field is ambiguous (as in an architectural model, for example) person-shaped objects are often added to give a sense of scale. If a person is very familiar with audio processing and has looked at many waveforms, they may be able to pick up cues as to the scale of the waveform, for example, if they know they are looking at music and they know the approximate tempo, they can infer the scale from the distance between prominent peaks. This method and other “landmark finding” methods are not reliable, however, because landmarks in audio waveforms are typically ambiguous and can be very difficult to interpret. Tempo doubling errors are common, for example, because music often has sub-beats between the primary peaks. Speech is another interaction area where landmarks can be used to give a sense of scale, since humans tend to speak at a rate of around 4 syllables per second. Again, this method proves useful only when a user has considerable experience on which to draw. Applying FPC to a time waveform can give a sense of scale, since the entire waveform is present and can be viewed at once. The user must still be aware of the time duration of the sample in order to disambiguate the display, but this
466
D. Gerhard, B. Park, and J. Ellis
is easier than maintaining a complete mental model of the waveform itself. The amount of zoom utilized in such an application must also be indicated, since the user may make scale errors if the amount of zoom is unknown. There are a number of ways to indicate the amount of scale, including the size and slope of the transition from context to focus, the thickness of the waveform trace itself, or an external iconic or numeric scale display. Regardless, the difficulties with scale perception in audio must be considered when designing such interfaces. 3.2
Frequency Zooming
The frequency display of an audio file normally corresponds to the short-time Fourier transform (STFT) of the waveform, although other techniques are employed for specific purposes. The STFT is calculated by breaking the waveform into overlapping fixed-size windows and calculating the spectrum of each window. The display is typically collocated in time with the waveform itself, to make corresponding analysis easier. STFTs and other spectral transforms suffer from an uncertainty principle: the more accurately you measure the frequency of a signal, the less accurately you can know the time at which that frequency occurred. This is evident in two extremes: If the STFT window is taken to be the entire length of the waveform, the complete frequency information can be calculated but it corresponds only to the entire waveform and not to any specific part within it. Similarly, the smallest unit of time in a waveform is the sample, corresponding to a single measure of air pressure. In itself, a sample has no frequency information but is located as accurately as possible in time. As a consequence of this spectral uncertainty, audio interfaces typically allow a number of parameters to be manipulated when displaying the spectrogram. If the user is more interested in time-accuracy of the spectrogram, a compactlysupported window is employed. If frequency-accuracy is demanded, a larger window is used. Wavelets and other multi-resolution techniques have been employed to allow better time-resolution at higher frequencies, but low frequencies cannot be extracted using a compactly-supported window. Despite the problems, the STFT remains the frequency analysis method of choice because it represents frequency information visually in a way that people can learn to interpret. The spectrogram representation is fundamentally an image, and as such, it is reasonable to expect that focus-plus-context zooming paradigms designed for images would also be appropriate for spectrograms. This is not the case for two reasons. The first is that image zooming metaphors assume that the image is available at full resolution, and the context area is created by down-sampling the image. Spectrogram data is fundamentally different at different frequency and time resolutions, so it is not sufficient to simply calculate the best possible spectrogram and zoom in. As has been stated, there is no “full resolution” spectrogram, and zooming must incorporate re-calculation. The second reason is related to the difficulty of zooming in the time waveform. General images often have landmarks or contextual information that provide a hint of the scale at which it is being viewed. Spectrograms have no such cues, and two different spectra can look the same when viewed at different resolutions if they
Focus-Plus-Context Audio Interaction Design
467
are harmonically related. For these reasons, a re-calculating metaphor is required. 3.3
Spectrogram Re-calculation
It is worthwhile to re-visit the classic formulation of the short-time Fourier transform to see where our modifications take place. Equation 1 shows the discrete STFT. ∞ � x[n]w[n − m]e−jωn (1) X(m, ω) = n=−∞
The windowing function w[·] is a function which establishes a finite range for the window, and tapers to zero at both ends of the range to reduce discontinuities. Typical windowing functions include the Hanning, Parzen, and Triangular windows. The windowing function provides time-localization to the STFT, and windows are overlapped to compensate for the discarded information in the tapering of the windowing function. The length (support ) of the window dictates the minimum frequency that can be represented; the sampling frequency fs dictates the maximum frequency, and the relationship between the amount of overlap and the window size determines the time-resolution of the resulting spectrogram image. It should be noted that no additional information is presented when the overlap is greater than what is required to compensate for the tapering. There are three inter-related parameters, then, in the construction of a spectrogram based on the STFT: The window length, the sampling frequency, and the overlap. If an audio waveform is sampled at 44,100 Hz (the standard CD sampling rate), and a 1024-sample window is used in the STFT, the longest sinusoid that can be detected is 1024 samples which is equivalent to 0.023 seconds or 43 Hz. The shortest sinusoid that can be detected is half the sampling frequency, in this case 22,050 Hz. The key to frequency zooming is in adjusting the time and frequency bounds of the spectrogram. A full spectrogram can be calculated with a reasonable balance between time and frequency to create the background context. A zoomed window over top of the spectrum provides detail. The three parameters over which we have control can manipulated to alter the frequency and time bounds of the resulting spectrogram. Time bounds. The upper and lower time bounds can be manipulated by adjusting the beginning and ending of the waveform to be analyzed. In order to fill the pixel range, the window size and the window overlap can both be manipulated. As we will see, the window size has an effect on the frequency bounds, so it cannot be considered an independent variable in this case. Upper frequency bound. Since the maximum frequency that can be displayed is dependent on the sampling frequency of the signal, we can reduce the sampling frequency in order to bring down the upper frequency bound. Down-sampling can be achieved by interpolating between the waveform samples and re-sampling
468
D. Gerhard, B. Park, and J. Ellis
at a lower sampling frequency. Initially, it might seem like this would reduce the amount of information available to the viewer, and while this is strictly the case, it is necessary to keep in mind that the goal of this transformation is only to increase the viewing resolution for a small portion of the frequency display, and contextualizing this focused portion with the complete spectrum. Lower frequency bound. Since the minimum frequency that can be displayed is dependent on the window size, we would like to re-sample within the window in order to modify the displayed frequency. A window size could be selected which corresponds directly to the minimum frequency desired, and this window would then be up-sampled (through the same interpolation and re-sampling procedure discussed above) to make a window of standard size (for example 1024 samples). The difficulty with this method is that in modifying the window size, the calculation of the entire spectrum is altered, rather than just the low frequency bound. In this case, the easiest and least intrusive method to assign the lower frequency bound is simply to discard the information below that frequency. The complete focus-generation sequence is then: 1. Select the upper frequency limit fl desired for the window. 2. Select the time range for the focus window, and copy 12 fs /fl times that number of samples from the original waveform. 3. Re-sample using a sampling ratio defined by fl / 12 fs . 4. Calculate the STFT on this new waveform, using a window overlap appropriate for the number of pixels required in the image 5. Discard the result below the lower frequency limit. If a signal is discretized at a sampling frequency of fs , the maximum frequency that can be represented is 12 fs . Parametrization. Because one of the goals of such a system would be usability, a user should not be required to interface with the algorithm-level parameters if they are not familiar to her. A “zoom amount” parameter could equally well define the maximal frequency, resample factor and overlap, given the appropriate mathematical mapping. If a user wanted to double the scale of the spectrogram, the maximal frequency would correspond to the location and size of the focus area. Imagine the focus area was at the center of the display, and was one-third the size of the full spectrum display. The maximal frequency of the focus area would then be twothirds of the maximal frequency of the overall spectrogram, or fs /3. Limitations. Re-sampling and window overlapping will work best when using whole-number ratios of the original values. This has the potential to impart an undue restriction on the usability of the system. The spectrogram zooming will also have limits imposed by time-frequency tradeoffs. In a linear FPC display, the context can be shifted, scaled or overlapped to make room for the focus window. In a two-dimensional FPC display such as the one proposed for the spectrogram, these context manipulations are less direct— splitting the context in one dimension means that the entire display will be split
Focus-Plus-Context Audio Interaction Design
469
Fig. 10. Two-dimensional FPC display using a single layer of focus on top of a cohesive context
and a gap would be present where the focus in the other dimension is not present. Alternatively, the contextual area can be scaled to incorporate one dimension of scaling, but this removes familiarity with the standard appearance of an STFT, and further obfuscates the interaction. Nonlinear zooming is more likely to be useful here, with the metaphor of the “bubble,” magnifying part of the STFT and smoothly transitioning to the context.
4
Implementation
As a proof-of-concept, we have implemented a Focus-Plus-Context display as part of the Audacity audio editor described earlier. We have implemented the focus window as an overlay in the main editing environment. Additional transition areas have not been implemented at this point. The primary purpose of the implementation was to explore the technical issues inherent in implementing an FPC display in an existing application. Our results were encouraging, showing that although significant modifications to several underlying structures were required, implementation overall is possible including some of the more complicated transition techniques discussed above. Figures 11 and 12 show examples of the FPC display in Audacity. 4.1
Deciding Where to Focus
One issue to consider with an FPC audio editing system is how the focus area is moved around through the audio track. Three approaches were considered. The first is to have the center of the focus area follow the location of the cursor when
470
D. Gerhard, B. Park, and J. Ellis
Fig. 11. A Screenshot of the FPC display as implemented within the framework of the Audacity audio editor
Fig. 12. FPC display at a higher focus-zoom level
the cursor is over the audio track. This method allows the user to scan through the audio track and quickly and accurately focus in on an event or target of interest. A problem with this approach is that it makes selecting audio difficult because as you are moving the mouse to do a selection, the focus area is also moving. This causes a side effect such that for each pixel the mouse moves in one
Focus-Plus-Context Audio Interaction Design
471
direction, the waveform underneath the cursor moves in the opposite direction at a rate proportional to the focus window magnification. If the focus window is magnified to a great extend, each pixel of mouse movement will result in many samples of focus window movement. The granularity of selection by the mouse could be partially offset by altering the size and magnitude of the transition between the focus area and the context area. For example, if a user is selecting an area from left to right, the right transition area can be expanded both in zoom and width in order to compensate for the mouse movement. The transition area on the left would be contracted in zoom and width. By changing the transition area on both sides, we can then move the audio displayed in the focus area at a slower rate, which should produce a better user experience as well as finer control. The second method to move the focus area within the audio track is by using mouse and keyboard queues. There are many ways in which this can be implemented. For example, the user may just have to click on any point in the track, and the focal area will surround the selected point. This conflicts with many programs as clicking on a track usually results in moving the play head to that location. Another queue could be by clicking on the track (which positions the play head) then pressing a keyboard button to signify that we want to move the focal area to this point. Yet another option could be to hover the mouse over the position and press a key in order to select the focal point and in addition, this would allow a user to change the focal point without changing slide location. The third method is to use the horizontal selection bar. This method is appealing since we are showing the whole context of the audio. The track is always the width of the screen so the there is never an occasion when it would be used in its conventional manner. The highlighted part of the bar could be the same width and in the same location as that of the focal point. Scrolling is an intuitive user interface technique, although horizontal scrolling typically requires the user to move the cursor away from the focus area. Devices are becoming available which allow both horizontal and vertical scrolling, and a common interface device for audio interaction is the “jog wheel” which often implements horizontal scrolling. WIth dedicated input devices such as these, using the scroll bar becomes less necessary. By using the scroll bar as the focus selection control, we create a relation between the two objects, however, we are also removing the user from the normal paradigm of using the bar to “scroll” the whole window. Focus To Selection. While editing audio, quite frequently a user wants to get more detail on a section of audio. In order to do so, the user usually selects the area that they want to view, and focus on the selection. However, in the FPC environment, there are two parameters to the focus area: width and zoom. It may not always be possible to display the selected area with the present zoom. Therefore, focusing on the selection may not have the desired outcome for the user. There are two ways in which this problem can be solved. The first option is to adjust the width of the focal area so that the zoomed selection can fit into the new focal width. Depending on the level of zoom, the focus window may not be able to expand far enough to fit the whole selection
472
D. Gerhard, B. Park, and J. Ellis
into the focal area. It is suggested that a threshold be created (for example 75% of the track window) such that, if the width of the focal area were to extend beyond this threshold (due to a large selection and high zoom level) then the zoom level of the focal area would be scaled down to the point that the selection can fit in the focal area while retaining a minimal focal zoom level of two (twice the context area). It would also be possible to discard part of the selection rather than changing the zoom level. However, changing the selection or the zoom level of the focal area will not provide the user with the expected result. The user expects to see the full selection in the focal area with the original focal zoom level which may not always be possible. Therefore, a compromise must be made in these cases. Since the user has explicitly selected an area on which they wish to focus on, changing the zoom level should provide the closest result to the users expectations. The second option is to only adjust the zoom level of the focal area so that the selection can fit into the focal area without adjusting the focal width. This option may work well if the user is consistently making selections with approximately the same width as the focal area. This will result in the zoom level being more or less constant. However, if the user is making large changes in selection width, the corresponding large change in zoom level could confuse the user. A good example is if the user has a small focal width with a high level of zoom, and the user makes a very large selection and wants to zoom in on the selection. This would result in the zoom level being dramatically decreased, possibly to the point where the focal area would have a smaller zoom level then the context area (essentially swapping the focal and context areas). Since the focal area should never have a smaller zoom than the context area, the program would be forced to not widen the focal area beyond a large portion of the track width, and as a result not enclose all of the selection in the focal area. 4.2
Moving the Focal Area During Playback
As discussed earlier, when playing back audio, a playhead is drawn on the track in the location of the audio that is currently playing. As the track plays, the playhead is slid along the track. It is possible for the focal area to follow the playhead such that the playhead is always in the middle of the focal area. This allows the user to see in greater detail the waveform of the audio as its being played. This has two negative effects. The first being that the focal area moves from the previous point that it was set to. The second effect is that the waveform moves very quickly past the playhead. This can make it harder to predict what the waveform will look like next and confuse the user as to where they are in the track. It may be recommended to move the focal area but only at a moderately low zoom level such that the waveform does not move overly fast. An issue with our particular implementation is that the focal area moves at a consistent rate but the playhead jumps back and forth within the focal area at different rates because of the change in pixels per second from the context to the focal areas. The real-time continuous changing of the focal point also results in high demand of the processor.
Focus-Plus-Context Audio Interaction Design
4.3
473
Rendering a Waveform in FPC
The implementation method chosen was to alter the open source audio editing program Audacity to use FPC. The major issue with modifying an existing application to use FPC is that the basic assumption of almost all editing applications is that a direct relation exists between audio track time and pixel location. For example, Audacity uses a variable called zoom which represents how many pixels are displayed per second of audio. Therefore, if a pixel location is given in a function, the corresponding time of that pixel can be calculated by dividing the number of pixels by the zoom. Also, if a time is given, the number of pixels needed to represent that quantity of audio can be calculated by multiplying the time by the zoom. Being that the conversion from time to pixels and pixels to time is a primary calculation that is done during audio selection, editing, and display, it is heavily entrenched into the program. When creating an FPC editor, the basic assumption that a direct relation exists between pixels and time is false. This difference causes many issues when trying to modify an existing audio editing application. Even after all of the time/pixel relations are modified to use the new FPC mappings, several problems still exist due to caching and file reading issues which are used to speed up Audacity. For example, when displaying the audio waveform, Audacity checks to see how many file blocks are used to calculate the pixel to be displayed. It then reads in the audio data in large chunks (256B or 64KB) if possible in order to speed up file reading and calculation of the minimum, maximum, and root mean square points. When using FPC the number of blocks per pixel varies depending on pixel location. This results in the inability to read data in large chunks using Audacity’s existing functions and structures because they do not allow for different chunk sizes concurrently. In addition to file reading issues, caching also creates many problems with FPC. Caching. During normal use, Audacity caches the information it needs to display the audio waveform. The end result is that the waveform only needs be calculated a single time unless the zoom factor, start time, or window width changes. The existing caching methods are not compatible with an FPC application because of the lack of constant time/pixel relation and the ability to move the focal window. A caching scheme similar to Audacity’s could be implemented. In order to do this, two caching arrays could be used; one for the context area and one for the focal area. The context area cache would have to be the same size as the number of pixels being displayed for the waveform minus the number of pixels being displayed in the focal area. The focal area cache would be approximately the size of the focal window times the focal zoom factor. This caching scheme would be ineffective in several situations. The whole cache would have to recalculated when the focal window zoom or width was changed. The transition area between the focal window and context area would have to be recalculated on the fly as caching this information would be inefficient and the transition area would have to remain a constant size to avoid cache recalculation. Also, the cache size of the focal window could become very large at large zoom factors.
474
D. Gerhard, B. Park, and J. Ellis
Therefore, caching at a level closer to the sample level would be more useful. The cache resolution should be of a rate equal to the number of samples per pixel of the focal area. This will result in a large cache if the resolution is small or the track length is long. As a compromise, if the cache size grew too large the resolution could be increased to be equal to the number of samples per pixel of the context area. This would speed up the rendering of the context area but would not be useful for the focal or transition areas. Due to these caching issues, it is recommended that different caching schemes be utilized. One way to speed up waveform display calculation is by pre-computing some of the commonly used conversion variables. For example, when using FPC with Audacity if we compute the pixel per second value for each pixel once and then store it in an array, we can speed up many function as this value is used very often. A mapping between pixel location and track time could also be stored in an array. The values stored in the array are only valid if the display width, focal zoom, focal start point, and focal width do not change. The end result is that calculations for the current waveform display can be sped up. By using some change information we can reduce the number of calculations that are needed when re-computing the cache arrays. As an example of efficient re-computation of the cache array, the pixel per second (PPS) cache will be used. If the focal window is moved 50 pixels to the left, only 100 values of the cache array have to be re-calculated (50 pixels at the start of the focal window and 50 pixels past the end of the focal window). Similarly, if the focal window is 20 pixels wide and is moved 100 pixels to the right, only 40 values need to be recalculated (the 20 pixels at the new location and the 20 pixels at the old location). These informed changes to the caching arrays can reduce the number of new values that are being computed and stored. However, they may not yield an overly large performance benefit when compared to the existing caching methods of Audacity. Performance. Another speed issue caused by FPC results from the fact that we have to show the entire track on the screen. Normally, Audacity only has to calculate display values for the portion of the track that is displayed on the screen. Because Audacity only displays a subset of the whole track, the number of samples that need to be read for calculating the waveform does not correlate to the length of the track. With FPC, we need to read all of the samples for the entire track in order to display the waveform. This creates a large performance hit when drawing the waveform of long tracks. A one minute track could take almost twice as long as a half minute track to display. An additional way of speeding up the rendering of the waveform in both tradiational Audacity and Audacity with FPC is to speed up the rate of performing calculations. This could be done quite practically through the use of the graphics processing unit (GPU). The GPU’s in modern machines are much faster at floating point calculation than CPU’s. By moving the root mean squared calculations as well as other common expensive calculations off of the CPU and onto the GPU a very large performance increase can be gained.
Focus-Plus-Context Audio Interaction Design
5 5.1
475
Future Work Horizontal Focus Plus Vertical Context (HFPVC)
One improvement on the standard horizontal editing bar is to utilize more screen real estate by expanding the waveform in a vertical direction at both edges which can be referred to as Horizontal Focus Plus Vertical Context, seen in Figure 13.
Fig. 13. Horizontal Focus Plus Vertical Context (HFPVC) display mock-up
The waveform begins in the upper left corner of the screen and is drawn in a downward direction. Just before the focal area is encountered, the waveform is warped into a horizontal direction. The entire horizontal run of the waveform is the focal area. As the waveform reaches the right side of the screen the context area is again displayed and warped in a downward direction until it hits the bottom of the screen. The HFPVC interface has several benefits over standard FPC and conventional user interfaces. One of the most important aspects of the HFPVC user interface is the additional screen space that the waveform can be displayed in. By using more space, the context area can be larger which helps to mediate the issue of losing context detail when viewing long tracks. The curved corners between the context area and focal area provide a natural transition between the two which may make it easier for a user to understand the boundaries and degree of zoom change between the areas. By having the context area and focal area drawn in different
476
D. Gerhard, B. Park, and J. Ellis
directions, a very clear difference is made between the two areas so they will not likely be confused. In order for a user to change the focal point most of the same methods from the normal FPC environment can be used. The main focal selection method that needs to be changed is the scroll bar. The scroll bar should now be in the vertical direction at the right side of the screen and positioned at the location of the horizontal focus. As the scroll bar is moved up or down, the focal area will move accordingly. The context area warps itself to the focal area as the focal area moves. When the focal area is at the top of the screen it is focusing on the start of the track and the majority of the context area is shown along the right side of the screen. Also, when the focal area is at the bottom of the screen it is focusing on the end of the track and the majority of the context area is shown along the left side of the screen. Several issues also exist with an HFPVC environment. Selecting an area of track other than the focal area may cause some difficulties. To start with, the cursor would have to change to a horizontal bar in the context area in order for the user to select a point with greater accuracy. Also, it may be beneficial to manipulate the cursor so it follows the curve between the context and focal areas. Having the context waveform being displayed vertically may cause initial discord for the user as audio editing is always done in a horizontal fashion. This could probably be overcome in a short period of time. Another issue with the HFPVC interface is drawing speed. The focal area and context area would not create more overhead than the original FPC interface. However, the transitional curve between the two would be quite a bit more complex and slower to draw.
6
Conclusions
We have presented a discussion of the issues involved in focus-plus-context displays for audio interaction. While it may be true that these displays will add a computational burden to what has traditionally been a relatively simple task, it is perhaps more appropriate to think of this as a shift in cognitive burden from the human to the computer. In traditional audio editing displays, users are forced to maintain and update a mental model of the entire file being considered, and difficulties can arise when there are repeated segments in a file. FPC interfaces can alleviate many of the current task-related difficulties of audio interaction. We have presented theoretical aspects of generating FPC displays of waveform and spectral information. Additionally, we have presented an implementation of some of these ideas in the context of an open-source audio editor (Audacity), and we have discussed the issues and difficulties inherent in this implementation. While it may be tempting to suggest that audio interaction programs have been successfully used for many years and that, although learning is required, the current systems are capable of performing the tasks, it is worthwhile to recall that most of the people who work with these programs have extensive experience and strong familiarity with the paradigm, the result of which can be overestimating the ease of use of the familiar interface. FPC audio displays have
Focus-Plus-Context Audio Interaction Design
477
the potential to remove considerable cognitive burden for people who work with audio, regardless of whether they consider themselves burdened.
References 1. Bederson, B.B., Hollan, J.D.: Pad++: a zooming graphical interface for exploring alternate interface physics. In: UIST 1994: Proceedings of the 7th annual ACM symposium on User interface software and technology, pp. 17–26. ACM Press, New York (1994) 2. Hornbæk, K., Bederson, B.B., Plaisant, C.: Navigation patterns and usability of zoomable user interfaces with and without an overview. ACM Trans. Comput.-Hum. Interact. 9(4), 362–389 (2002) 3. Keahey, A.: The generalized detail-in-context problem. In: INFOVIS 1998: Proceedings of the 1998 IEEE Symposium on Information Visualization, Washington, DC, USA, pp. 44–51. IEEE Computer Society, Los Alamitos (1998) 4. Keahey, A.: Nonlinear magnification infocenter [accessed November 13, 2007], http://alan.keahey.org/research/nlm/nlm.html 5. Plumlee, M.D., Ware, C.: Zooming versus multiple window interfaces: Cognitive costs of visual comparisons. ACM Trans. Comput.-Hum. Interact. 13(2), 179–209 (2006) 6. Raskin, J.: The Humane Interface: New Directions for Designing Interactive Systems. Addison-Wesley Professional, Reading (2000) 7. Rauschenbach, U.: The rectangular fish eye view as an efficient method for the transmission and display of images. In: ICIP 1999: Proceedings of the 1999 IEEE conference on Image Processing, Washington, DC, USA. IEEE Computer Society, Los Alamitos (1999) 8. Rauschenbach, U., Weinkauf, T., Schumann, H.: Interactive focus and context display of large raster images. In: WSCG 2000: The 8-th International Conference in Central Europe on Computer Graphics, Visualization and Interactive Digital Media (2000) 9. Woodruff, A., Landay, J., Stonebraker, M.: Constant information density in zoomable interfaces. In: AVI 1998: Proceedings of the working conference on Advanced visual interfaces, pp. 57–65. ACM Press, New York (1998)