Appl. Comput. Math. 6 (2007), no.2, pp.288-294
FORECASTING MAXIMUM TEMPERATURES VIA FUZZY NEAREST NEIGHBOUR MODEL OVER DELHI A.K MITRA †, SANKAR NATH †, § Abstract. This paper introduces nearest neighbour based fuzzy model (NNFM) based on membership values for forecasting the daily maximum temperature at Delhi . Fuzzy membership values has been used to make single point forecasts into the future on the basis of past nearest neighbours. Compared with other statistical method and artificial neural network (ANN) technique, this approach has the advantages of faster and highly automated model synthesis as well as improved prediction and forecasting accuracies. The NNFM model developed using daily temperature data of 15 years (1991 to 2005) that were used to predict the maximum temperature for the next days. The model forecast has been tested with the actual observation of the independent data sets of 2006 and also the results are compared with the method of persistence and ANN technique. The overall performance statistics shows that the proposed model is capable to produce good results with independent cases, providing about 91% correct forecast within ±2◦ Cof the observed values for the next day along with a positive value of skill score over persistence method as well as ANN technique. The method is found to be promising for operational application. Key words: NNFM, APE, DOS, Skill Scores,ANN
Introduction Various authors have carried out studies on maximum temperatures. Kendall et al [1] and Panofsky and Brier [2] provide detailed description of various forecasting techniques based on statistical methodology, including the widely used technique of multiple regression analysis. Klein and Hammons [3] suggested many predictors for prediction of maximum/minimum temperature. Mohanty et al. [4] have developed a statistical model for prediction of minimum temperature during winter and maximum temperature during summer at Delhi. It has been realized that statistical techniques have limited capabilities when modeling time-series data, and more advanced methods including neural networks have been frequently used (Azoff [5]). Recently, many conventional statistical techniques such as autoregressive (AR), adaptive filtering and AR-Integrated Moving Average (ARIMA) models have been extensively used for temperature forecasting (Adel-Aal and Elhadidy [6] ; Delugio [7] ; Singh and Jaipal [8] ; Suresh [9]). Intelligent systems (IS) using artificial intelligence techniques have been used to forecast severe weather and other climatological conditions. The IS modelling approach is complementary to the NWP (Numerical Weather Prediction) scheme that uses computationally intense dynamical, thermo dynamical and statistical algorithms to produce large-scale weather forecasts. Many case-based techniques have been proposed for prediction of weather and weather parameters. These methods use different pattern-recognition techniques. Riordan and Bjarne [10] proposed a fuzzy case-based system for weather prediction. Following the approach of case based reasoning; Singh et al [11] proposed the nearest neighbour model for prediction of weather at a station in terms of snow day/no snow day and the expected snowfall amount under different well-established snowfall categories. †India meteorological department,New Delhi, e-mail: ashim
[email protected] §Manuscript received 14 July, 2007. 288
A.K MITRA,SANKAR NATH: FORECASTING MAXIMUM TEMPERATURES VIA FUZZY NEAREST ... 289
Farmer and Sidorowich[12] state that local approximation and nearest neighbour techniques can be used in forecasting to give results several orders of magnitude better than conventional statistical techniques and climatology. During recent years other methods such as fuzzy modeling ( Zadeh[13]; Tatli and en[14]), neuro-fuzzy (Abraham et al [15]), and pattern recognition method (Lai et al.[16]), temporal recurrent neural networks (Tatli et al.[17]; Dibike and Coulibaly [18]) has been widely applied for handling complex and non-linear problems. In this paper, nearest neighbour with fuzzy membership values is employed for one day ahead forecasting of maximum temperature of Delhi. The NNFM model is compared with ANN model as well as persistence method. The ANN model is based on Multi Layer Perceptron ( MLP) which trained and tested with same period of data-set as NNFM. The ANN algorithm used in this study is described in detail in Hayati [19] et al. (2007)
1. Methodology and data 1.1. Methodology. The model proposed here for predicting maximum temperatures, 24 h in advance, is based on identifying the relationship between current and past values with reasonable accuracy. A nearest neighbour method is usually based on the identification of several historic neighbours that may be then used in forecasting by either averaging their contribution or using an extrapolation method. The accuracy of the method is directly dependent on the ability to identify good neighbours. For developing the model for predicting maximum temperatures, 15-year of maximum temperature data (1991-2005) for the months of January–December have been utilized. To obtain good model, it is important to ensure that the development set is a good representation of the problem space. For instance, in a development set, temperature data derived from only one season would not produce an adequate module for use over the whole year. Twenty-four hour lead-time has been chosen for issuing the forecasts. All the data taken for model development are recorded before the time of issue of the forecast. The individual data gaps were filled up by using liner interpolation of the previous and subsequent observations of meteorological parameters. In order to obtain a reliable forecast from NNFM, first we need to formalize time-series analysis mathematically. In the formulation of the model we consider the time series as a vector p = {p1 , p2 , . . . , pn } where n is the total number of points in the series. This series could also be represented by a function of time e.g. pn = pt , pn−1 = pt−1 and so on. The main aim of the NNFM is to forecast pn+1 when the time-series data {p1 , p2 , . . . , pn } is given. For this purpose, proceed by identifying the nearest neighbors of pn and the same series movement around pn in the past data. A total of k- neighbors in a pattern, selected and represented as {qt1 , qt2 , . . . , qtk } where qtk is the series value at time tk . The forecast p∗n+1 of actual pn+1 , is based on either the averaging or extrapolating of values {qt1+1 , qt2+1 , . . . , qtk+1 } (Singh [20]). The relationship between a current series value pn and the past values pi (i = 1, 2, . . . , n − 1) could be determined by using a fuzzy membership function (Pal and Majumdar [21] ). The function value of one (1) denotes the nearest of all neighbors whereas function values towards the tail end near zero (0) denote poor neighbors. The model proposed here is that nearest neighbors are selected when the series movement (up or down) in their range matches the series movement around pn corresponding fuzzy optimal membership threshold value of λ. Taking the current time-series value as pn identify the membership of pn and past values . The proximity between pn and a past value pi is calculated , Singh [20], as follows : µ (pi ) = 1/ [1 + {d (pi , pn ) /η ]
(1)
In Equation 1, µ (pi ) denotes the fuzzy membership of pi and pn and d is the Euclidean distance between pi and pn . The constant η is determined through experimentation to yield minimal prediction error ((Pal and Majumdar [21] ). Scale the membership values within the
290
APPL. COMPUT. MATH., VOL. 6, NO.2, 2007
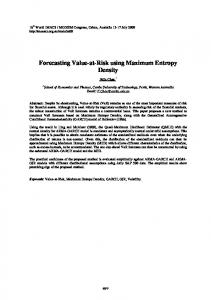
[0, 1] in such a way that if pn = pi , i = 1, . . . , n − 1, then µ (pi ) = 1, else 0 ≤ µ (pi ) < 1 shown in Figure 1. µ0 (pi ) ≥ λ and same series movement (up or down) in their range matches the series movement around pn where λ is a threshold within the [0, 1] range set by the experimenter. As λ increases, a smaller numbers of nearest neighbours are selected. A total of k-nearest neighbours selected from the past data is denoted as {qt1 , qt2 , . . . , qtk }. Forecast for time step n+1 by taking weighted average of the k nearest neighbours can be defined as: Pk
1 ωi qti+i (2) P k 1 ωi In Equation (2), ωi is the corresponding normalized membership value. The basic purpose in the development data set was to arrive at the threshold membership value and pattern, which gave the least error both in APE and DOS error by varying within the [0, 1] range.
p∗n+1
=
1.2. Data. The daily maximum temperature at Delhi for the period of 15 years (1991 to 2005) was obtained from India Meteorological Department for the study. The developed model is tested with independent data set of 2006. 2. Results and discussion NNFM Model developed for maximum temperatures are tested with independent data set of year 2006. The error analysis of the forecasts for both the developmental sample and the independent data sets is given in Table 1. The skill scores for forecast are estimated as µ ¶ 2 RM SEm Skill Score = 1 − ∗ 100% (3) RM SEp2 Where RM SEm and RM SEp stand for RM SE of the NNFM model prediction and persistence or ANN respectively. A positive value of skill score stands for a better performance of the NNFM model over persistence and ANN while a negative value of skill score indicates that the model does not have skill even to match the persistence and ANN. Though there are few occasions with the forecast errors of maximum temperature exceeding 4 C, the skill scores given in Tables 1, clearly indicate that the developed model have positive skills and perform better than the persistence and ANN with independent data sets. Figure 2 shows the predicted (NNFM) and observed maximum temperature for the year 2006. It is obvious that periodic pattern in the daily maximum temperature sequences is modeled successfully with the proposed model in the development data set, the¡actual values¢and predicted ones do not fall on each other and consequently the error amount is pn+1 − p∗n+1 . However, in order to assess the validity of NNFM prediction it is necessary to have an overall measure of the individual errors with the persistence forecasts and ANN technique. Tatli and en [14] found the practical acceptable limit of APE for any model should not more than 10 %. It was seen that due to significant changes in the meteorological parameters such as humidity and moisture increase on local basis within the observation period, maximum temperature changes are significant. From figure 2 and Table 1 it is found that 91% of the forecast is correct within ±2◦ C and about 94% of the forecast is within 3◦ C of the actual observed values with independent data set. Further, the persistence of maximum temperature is studied for the year 2006 and compare with NNFM to see its effect on model predictions and is represented in Table 2. In most of the cases it was found that the rapid movement of synoptic systems are associated with precipitation, thunderstorm. when these system passes across the station in a time-frame less than the selected range of forecast (24 h), the model output (NNFM) resulted in sudden change which led to such large deviations. The overall performance analysis indicates that (Table-1 and Table-2), The mean bias is very close to zero (between 0◦ C and 0.2◦ C) and a marked reduction of maximum error compared to the persistence forecast and ANN technique with good correlation coefficient
A.K MITRA,SANKAR NATH: FORECASTING MAXIMUM TEMPERATURES VIA FUZZY NEAREST ... 291
(CC). This intern reveals that the performance of model is appreciably good over conventional technique. 3. Conclusions Prediction of meteorological parameters such as maximum temperature using NNFM has found to be the most promising approach with successful test results. The accuracy of the forecasts depends on the ability of the algorithm to detect good neighbors. The following are the main conclusions drawn from the study. • Maximum temperature are well predicted by the NNFM, as in 91% of the cases errors are within ± 2 along with direction of future change was 60%. In the Monsoon and PreMonsoon season, APE was 4.66% and 4.46% respectively. Similarly in winter and Postmonsoon season, accuracies are around 55% with 7.33% and 4.82% APE respectively. • The performance of the model indicates that in each of the cases and season there is definite positive skill in the forecast produced by NNFM over the persistence. • The forecasting accuracy of the NNFM is data dependent and therefore its optimization parameters including threshold λ and pattern should be selected through experimentation, based on season, time and location • The nearest neighbour method will work better with large data sets where we have an increased probability of finding good neighbors. The NNFM method has the advantage of simple computational approach for prediction of maximum temperature and non-linear data to the complex computations as well as simulation of real weather events in dynamical models. As the data volume increases in near future, the model performance will improve and stabilize. This method can be used for issuing aviation as well as non-aviation forecasting of maximum temperature over Delhi during hot weather season. The performance of the model developed so far is satisfactory with respect to the available information and easy to implement operationally. On a few occasion, large deviation of the forecast observed. These are mainly attributed to rapid movement of synoptic system in this region. In the present study, only historical data have been used to develop the models. Further work need to be done towards advanced Fuzzy-Neuro methods for weather forecasting. It is important to utilize the ability of such methods in to well-established statistical methods and numerical weather prediction (NWP) for better forecast. Acknowledgement Authors are grateful to Director General of Meteorology for his constant encouragement during the course of study. Authors are very much thankful to Dr. Hasan Tatli, C anakkale Onsekiz Mart University, Department of Geography, Turkey for his tremendous help and valuable suggestions. Thanks are also due to Dr. Soma Sen Roy, Scientist, IMD for providing the valuable software and system support. References [1] Abraham, A., and Joseph, B., Long term rain forecasting using soft computing models, International Journal of Neural, parallel and science computer, 2001,10, 157-158. [2] Adel-Aal, R.E., M.A.Elhadidy., Modeling and Forecasting the Daily Maximum Temperature Using Abductive Machine Learning, Weather and Forecasting., 1994, 10,310-325. [3] Azoff, M. E., Neural Network Time Series Forecasting, John Wiley and Sons. 1994. [4] Delugio, S., Forecasting: Principles and Applications, McGraw-Hill, 1998. [5] Dibike, YB., and Coulibaly, P., Temporal neural networks for downscaling climate variability and extremes, Neural Networks, 2006, 19,135-144. [6] Farmer, J. D. and Sidorowich, J. J., Predicting Chaotic Dynamics, in Dynamic Patterns in Complex Systems, 1988. J. A. S. [7] Kendall, M. G. and Stuart, A., The Advanced Theory of Statistics, Griffin, London, 1968, Vol.2, pp. 278–374. [8] Klein, W. H. and Hammons, G. A., Mon. Weather Rev, 1975,103, 796–806. [9] Lai, E.P., Chu, M., and Wong, W., “Pattern reorganization of radar echoes for short-range rainfall forecast”, 15th International Conference on Pattern reorganization IEEE, 2000, 4, 299-302.
292
APPL. COMPUT. MATH., VOL. 6, NO.2, 2007
[10] Mohanty, U. C., Ravi, N., Madan, O. P. and Paliwal, R. K., Meteorol. Appl., 1997, 4, 37–48. [11] Mohsen Hayati, and Zahra Mohebi,”Application of Artificial Neural Networks for Temperature Forecasting, INTERNATIONAL JOURNAL OF APPLIED SCIENCE, ENGINEERING AND TECHNOLOGY VOLUME 4 NUMBER 3 2007 ISSN 1307-4318 [12] Pal, S.K., and Majumdar, D.D., Fuzzy Mathematical Approach to Pattern Recognizing. John Wiley, New York, 1986. [13] Panofsky, H. A. and Brier, G. W., Some Application of Statistics to Meteorology, University Park, Pennsylvania, 1968, pp. 117–118; 191–208. [14] Riordan, D. and Bjarne, H. K., A fuzzy case based system for weather prediction. Eng. Int. Syst., 2002, 10, 139–145. [15] Singh, S. ”Forecasting using a Fuzzy Nearest Neighbour Method”, Proc. 6th International Conference on Fuzzy Theory and Technology , Fourth Joint Conference on Information Sciences (JCIS’98), North Carolina, vol. 1, pp.80-83,1998 (23-28October ,1998) [16] Singh, D., Ganju, A. and Singh, A., Weather prediction using nearest neighbour model. Curr. Sci., 2005, 88, 1283–1289. [17] Singh, D. and Jaipal., Forecasting night minimum temperature over New Delhi, Mausam, 1983, 34, 185–188. [18] Suresh, R., Forecasting maximum and minimum temperature over airport with special relevance to aviation in flight planning, Mausam, 1999, 50, 121-128. [19] Tatli, H., and Sen, Z., Fuzzy-modeling approach for predicting the maximum temperature from a time series, Turkish Journal of engineering and Environmental Sciences, 1999, 3,173-180. [20] Tatli, H., Dalfes, H.N., and Mentes S.S., A statistical downscaling method for monthly total precipitation over Turkey, International Journal of Climatology, 2004, 24, 161-180. [21] Zadeh, L.A., Fuzzy Sets, Information and control, 1965, 8, 338-353.
LIST OF FIGURES AND TABLES Figure 1: Figure 2: Table 1: Table 2:
Scales of the membership values Observed and 24 h predicted maximum temperature for 2005. Error analysis and skill score for maximum temperature (24 h forecast). Comparison between NNFM and persistence forecast for 2005 FIGURES AND TABLES
Figure 1. Scales of the membership values
A.K MITRA,SANKAR NATH: FORECASTING MAXIMUM TEMPERATURES VIA FUZZY NEAREST ... 293
Figure 2. Observed and 24 h predicted maximum temperature for 2005. Table1. Error analysis and skill score for maximum temperature (24 h forecast)
294
APPL. COMPUT. MATH., VOL. 6, NO.2, 2007
Table2. Comparison between NNFM and persistence forecast for 2005