Resumen. CAMARERO, J.J., S. Siso & E. GIL-PELEGR(N (2003). La dimension fractal no describe ade- cuadamente la complejidad del contorno foliar en ...
FRACTAL DIMENSION DOES NOT ADEQUATELY DESCRIBE THE COMPLEXITY OF LEAF MARGIN IN SEEDLINGS OF QUERCUS SPECIES by M
JESUS JULIO CAMARERO , SERGIO SIS6', EUSTAQUIO GIL-PELEGRJN' 1
!
Unidad de Recursos Forestales, Servicio de Investigation Agroalimentaria (S. I. A.), Gobiemo de Arag6n. Apartado 727. E-50080 Zaragoza Dept. d'Ecologia, Universitat de Barcelona. Avda. Diagonal, 645. E-08028 Barcelona
Resumen CAMARERO, J.J., S. Siso & E. GIL-PELEGR(N (2003). La dimension fractal no describe adecuadamente la complejidad del contorno foliar en plantulas de especies del genero Quercus. AnalesJard. Bot. Madrid 60(1): 63-71 (en ingles). Se ha cuantificado la complejidad del margen de las hojas de varias especies arboreas del genero Quercus utilizando la dimension fractal estimada mediante el m&odo del recuento de cajas (FDb). Se tomaron hojas procedentes de plantulas pertenecientes a 15 especies de Quercus con un amplio rango de morfologfa foliar (Q. agrifolia, Q. alba, Q. cerris, Q. chrysolepis, Q. coccifera, Q. faginea, Q. frainetto, Q. ilex subsp. ballota, Q. ilex subsp. ilex, Q. petraea, Q. pyrenaica, Q. robur, Q. rubra, Q. suber y Q. velutina). Se usaron varios Indices sencillos para describir la complejidad del borde de la hoja: P/L, la relation entre el perimetro foliar (P) y la longitud maxima de la hoja siguiendo el eje principal (L); P/A, la relation entre el perimetro y el area foliar (A), asl como su versidn adimensional (P/A0!); y WM/Wm, la relaci6n entre la distancia maxima desde el Spice distal de un 16bulo al nervio principal (WM) y la distancia minima desde la incisi6n del 16bulo al nervio principal (Wm). Se hallfj una fuerte relation positiva entre FDb y P/A. Un analisis de agrupamiento revel6 la existencia de tres grupos de hojas segun su lobulacidn y el tipo de margen: margen recto o espinoso (p. ej., Q. coccifera, Q. velutina), lobulos superficiales (p. ej., Q. petraea) y ldbulos profundos (p. ej., Q. pyrenaica). Para las especies estudiadas del genero Quercus, la relation WM/Wm es un (ndice sencillo y adecuado de lobulacidn de hojas. Se sugiere que la tasa de flujo a traves del contorno foliar esta relacionada con la complejidad de dicho borde. Palabras clave: complejidad, dimensi6n fractal, lobulacidn de la hoja, metodo de recuento de cajas, roble. Abstract CAMARERO, J.J., S. Sis6 & E. GiL-PELEGRfN (2003). Fractal dimension does not adequately describe the complexity of leaf margin in seedlings of Quercus species. Armies Jard Bot. Madrid 60(1): 63-71. We quantified the complexity of leaf margin in a set of Quercus tree species using fractal dimension estimated by the box-counting method (FDb). Leaves were sampled from seedlings in a set of 15 Quercus species with a wide range of leaf morphology (Q. agrifolia, Q. alba, Q. cerris, Q. chrysolepis, Q. coccifera, Q.faginea, Q. frainetto, Q. ilex subsp. ballota, Q. ilex subsp. ilex, Q. petraea, Q. pyrenaica, Q. robur, Q. rubra, Q. suber, and Q. velutina). To describe leaf-edge roughness, we used simple indices: P/L - the ratio of leaf perimeter (P) to maximum leaf length (L) along the main nerve; P/A - the ratio of leaf perimeter to leaf-blade area (A) and its dimensionless version (P/A0'); and WM/Wm -the ratio of maximum distance from the lobe tip to the main nerve (WM) to minimum distance from the lobe incision to the main nerve (Wm). There was a strong positive relationship between FDb and P/A. Clustering analy-
64
ANALES JARDfN BOTANICO DE MADRID, 60(1) 2003
sis revealed the existence of three groups of leaves, namely those with: smooth or spiny margins (e.g., Q. coccifera, Q. velutina), shallow lobes (e.g., Q. petraea), and deep lobes (e.g., Q. pyrenaica). In the studied Quercus species, the ratio WM/Wm is a simple and suitable leaflobation index. It is suggested that the flux rate along the leaf edge is related to the complexity of this boundary. Key words: complexity, fractal dimension, leaf lobation. box-counting method, oak.
INTRODUCTION
Fractal geometry can be regarded as a unifying (and recurrent) theme in biology, because it integrates scale-related phenomena and complexity into the description of scaledependent patterns (MANDELBROT, 1982; KENKEL & WALKER, 1996). The dependence of length on measurement scale allows an estimate to be made of the complexity of shape of a natural form, namely its fractal dimension (FD). Some authors have emphasized the potential of FD in estimating the complexity of "biological boundaries" in the plane (1 < FD < 2), from leaf edges to ecotones (LORTMER & ai, 1994). According to fractal theory, the most complex biological interfaces (FD ~ 2) should enhance the rate of exchange or flux of matter and energy dirough these contact zones (FRONTIER, 1987). This approach would permit a better understanding of the underlying processes, including adaptative traits (HERRERA, 1993). There has been an intense use of fractal geometry to describe the complexity of various characteristics, from leaf shape to tree crowns, in plant ecology (ZEIDE, 1991). Fractal dimension had been previously used as an index to estimate the complexity of leaf outline (VLCEK & CHEUNG, 1986; MCLELLAN & ENDLER, 1998; BORKOWSKI, 1999). More complex leaf outlines had higher FD. VLCEK & CHEUNG (1986) suggested that FD might become a new taxomonic characteristic in spite of its high intraspecific variability. BORKOWSKI (1999) showed that FD of leaf edge could be used as a discriminating interspecific feature in trees if: (i) FD was properly defined and estimated, (ii) FD was combined with simple leaf-shape descriptors. Other shape measures have been also used to identify plants by applying automatic image-analyses of leaf shape (YONEKAWA & ai, 1996).
The diversity in leaf shape has been interpreted as a function of environmental variability (BRENNER, 1902; GIVNISH, 1979). For over a century several terms have been need to describe the form of leaves. For instance, the term "pinnatilobatum" describes leaves with incisions up to 1/4-1/3 of the lamina. This diverse morphology is exemplified by leaf lobation in the genus Quercus, which has been explained by focusing on different environmental factors: 1) lobed leaves are effective convection-heat dissipators (VOGEL, 1970); 2) leaf lobation influences the interception of direct solar radiation (NIKLAS, 1989); 3) lobation may be a way to reduce blade area and decrease leaf hydraulic resistance (Siso & al, 2001). Therefore, quantitative descriptions of leaf lobation are needed in order to assess its adaptive relevance. In this study, (i) we quantify die complexity of leaf margin in 15 Quercus species, and (ii) we objectively describe leaf lobation.
MATERIALS AND METHODS
Plant material In order to study a wide range of leaf morphologies, from deeply lobed to nearly straight ones, 15 Quercus species were selected (nomenclature follows Krussman, 1986). They belong to two different subgenera: Quercus (Q. alba L., Q. cerris L., Q. chrysolepis Liebm., Q. coccifera L., Q. faginea Lam., Q. frainetto Ten., Q. ilex subsp. ballota L., Q. ilex subsp. ilex L., Q. petraea Liebl., Q. pyrenaica Willd., Q. roburh., and Q. suber L.), and Lobatae (Q. agrifolia N6e., Q. rubra L., and Q. velutina Lam.). This selection provided a wide range of foliar phenology (evergreen -e.g., Q. coccifera- vs. deciduous -e.g., Q. robur- species) and phytoclimatic origin (mediterranean -e.g., Q. ilex-, nemoro-
J.J. CAMARERO & AL.: FRACTAL ANALYSIS OF LEAF MARGIN
mediterranean -e.g., Q. pyrenaica-, and nemoral species -e.g., Q. alba). To reduce the ontogenetic and environmental variability, seedlings were grown under uniform nutrient supply, light conditions and without water limitation. The provenance of seeds and growth conditions are described by Sis6 & al. (2001). At the end of the second cycle of growth (July), 5 seedlings per species were randomly harvested for leaf morphology measurements. A minimum of 10 leaves per oak species were studied sampling randomly at least 2 leaves per seedling. The sample size of some species with great intraspecific variability was greater than 10 leaves. We studied 15-50 leaves for Q. frainetto, Q. petraea, Q. pyrenaica, and Q. robur. The second growth cycle was selected for all leaf measurements except for Q. cerris, because of its great variability of leaf lobation between the first and second growth cycles. Therefore, Q. cerris seedlings were grouped according to their ontogenic development: the first (Q. cerris with even straighter-edged leaves -Q. cerris entire) and the second growth cycle (Q. cerris with even more lobed leaves -Q. cerris lobed). In summary, we studied 16 different groups of leaves according to their morphology. It must be noted that the leaf shape of several of the studied oak species had not reached its final form when they were sampled, i.e. in the second year. For example, lobed and slightlylobed leaves are found in Q. rubra and Q. velutina adult trees (SARGENT, 1965), whereas most 2-year seedlings of both species showed smooth margins Therefore, our results must be considered for leaves from 2-year old seedlings and not for leaves from adult individuals.
65
lobe incision to the main nerve) widths of the leaf following the direction of leaf lobes (fig. 1). Then all leaves (n = 259) were digitised with the same resolution (72 d.p.i.) using a scanner (Agfa Snapscan 1236u). This resolution was selected following SLICE (1993). It is 2 orders of magnitude finer than the outline radius of circles with similar area to the scanned leaves. The images were converted to black and white (the black part was the leaf margin) and stored as PICT files. All images were processed similarly to avoid the spurious effect of varying line thickness on fractal estimates (BERNSTON, 1994). This methodology was first calibrated against images of known fractal dimension. Throughout this study, lobation is considered to be a potential measure of the degree of complexity of leaf outline (MCLELLAN & ENDLER, 1998). In order to determine the fractal dimension, we chose the metric approach based on the Hausdorff-Besicovitch dimension (FEDER, 1988). Leaf outlines are curves whose dimension must be a number between 1 and 2 (1 < FD < 2). Among the several methods to estimate the fractal dimension, the one based on box-counting was chosen (FDb). The length of leaf outline depends on
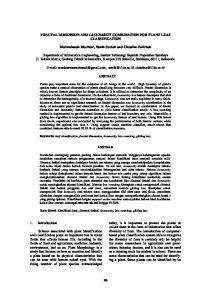
Fractal analysis of leaf shape Inmediately after sampling, leaf perimeter (P) and area (A) were measured with a leafarea meter (Delta-T Devices Ltd., Cambridge, UK). Two additional variables were measured: maximum length (L) of the leaf following the axis of the main nerve; maximum (WM, distance from the lobe tip to the main nerve) and minimum (Wm, distance from the
Fig. 1.-Variables measured in a schematic oak leaf (Q. pyrenaica). Abbreviations: A, area; L, maximum length of the leaf following the axis of the main nerve; P, perimeter; WM, maximum distance from the lobe tip to the main nerve; Wm, minimum distance from the lobe incision to the main nerve.
66
ANALES JARDI'N BOTANICO DE MADRID, 60(1) 2003
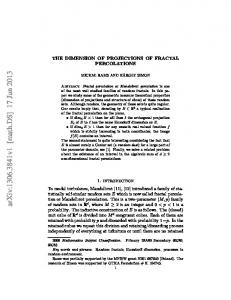
the size of the box (s) used to measure it. A square mesh of various sizes s was laid over the leaf edge (fig. 2). The number of mesh boxes N (s) that contained part of the image were counted. The box-counting dimension (FDb) was given by the slope of the linear portion of a log(N(s)) vs. log(l/s) graph. The graphed value of N (s) is the average of N (s) from the different mesh origins. The best fit was obtained by removing the smallest box sizes (s, 2s; ALADOS & al, 1999). The range
of the box sizes was determined by the accuracy of outline digitisation (minimum s) and figure size (maximum s). The box-counting dimension (FDb) of leaf edge was computed using Fractal Dimension Calculator software (BOURKE, 1993). For a selected subset of leaves (n = 156) we also computed the fractal dimension of leaf outline using the dividers (compass) method (FDc) to test how both measurements of fractal dimension were related (KENKEL & WALKER, 1996). This
Fig. 2.-Schematic description of the procedure used to estimate the fractal dimension of leaf outline using the boxcounting method (FDb). Both leaves correspond to Q. pyrenaka, but the complexity of the leaf outline is greater for the upper (A, FDb = 1.17) than for the lower leaf (B, FDb= 1.12). Three box sizes are presented and those boxes touching or including the leaf edge are filled in gray.
J J . CAMARERO & AL.: FRACTAL ANALYSIS OF LEAF MARGIN
method is analogous to moving a set of dividers of fixed length along the leaf contour. This is repeated for several scale values (ruler lengths). It must be noted mat this method is exact only for statistically self-similar curves. In this second case, the scanned images were stored as *.raw files with a constant size (512 * 512 pixels). This method was based on a search algorithm, which followed me leaf silhouette using rulers of progressively shorther length. The FDc was estimated using software developed by E. Rivas (SIA, DGA). The slope of a log-log area-perimeter plot for a group of objects is a good estimate of a fractal dimension (BURROUGH, 1986). This method quantifies how complex or convoluted are objects within a two-dimensional plane. Therefore, we regarded the P/A ratio and the dimensionless P/A05 index as good approximations of leaf-outline complexity. Other two simple and dimensionless indices of leaf lobation were computed: the P/L and the WM/Wm ratios. Additional leaf-lobation indices have been proposed by YONEKAWA & al. (1996). Relationship among leaf-lobation indexes were studied using the non-parametric Spearman's coefficient (rs) because most of them differed significandy (p < 0.05; KolmogorovSmirnov test) from a normal distribution (P/A, P/A05, WM/Wm, FDb). To perform later analyses (ANOVA), the raw data of all variables excepting P/L were previously transformed to follow normality (p > 0.10; Kol-
67
mogorov-Smirnov test). The values of P/A and FDb (x) were transformed using jt°J and log (x), respectively. The values of P/A05 and WM/Wm were transformed using 1/x and l/x2, respectively. After one-way ANOVA using species as factor, mean values of FDb for each species were compared using a post-hoc Tukey test for unequal sample sizes -Spj0tvoll & Stoline test- (SOKAL & ROHLF, 1995). To identify multivariate groups using the biometric indices of leaf-edge complexity (P/L, P/A, P/A05, WM/Wm), and fractal dimension (FDb), cluster analyses were computed using all leaves (n = 259). A preliminary hierarchical agglomeration suggested the existence of 3 distinct clusters. Then, a /c-means algorithm was applied with k = 3 groups (KAUFMAN & ROUSSEEUW, 1990). All statistical analyses were done using the STATISTICA package (Statsoft Inc. 1996, Tulsa, USA), with the exception of cluster analyses that were performed with S-PLUS 4.5 (MathSoft Inc. 198898, Seattie, USA). RESULTS
The box-counting fractal dimension of leaf oudine (FDb) was significant (p < 0.001) and positively (rs = 0.81) related to the dividers fractal dimension (FDc). All leaf-lobation indices were also highly and positively related, but the shape variable most related to FDb was the P/A ratio (table 1). The P/A05 and WM/Wm indices were also related to FDb.
TABLE 1 CORRELATION (SPEARMAN'S COEFFICIENT) VALUES BETWEEN ALL LOBATION INDICES FOR ALL LEAVES (n = 2 5 9 ) [All correlation values are highly significant (p < 0.001), excepting those underlined (p S 0.05). Abbreviations: A, leaf area; FDb, box-counting fractal dimension of leaf outline; L, maximum lenght of the leaf following the main nerve direction; P, leaf perimeter; WM, maximum distance from the lobe tip to the main nerve; Wm, minimum distance from the lobe incision to the main nerve]
P/L P/A (cm 1 ) P/A 05 WM/Wm
FDb
P/L -
P/A (cm 1 )
P/A 0 !
WM/Wm
FDb
0.35
0.48 0.18
0.48 0.16 0.78
0.44 0.54 0.43 0.42
t
-
-
-
68
ANALES JARDfN BOTANICO DE MADRID. 60( 1) 2003
Interspecific differences were found when comparing mean fractal dimension (FDb) values (fig. 3). Overall, the differences of fractal dimension of the leaf margin were significant (F = 9.60, p < 0.001). For Q. cerris, the mean values of leaf-outline fractal dimension did not differ significantly (p > 0.05) between the two growth cycles (fig. 3). We distinguished at least three groups of Quercus leaves according to the morphometric indices and FDb (fig. 3; table 2): straight-edged or spiny-margin (e.g., Quercus coccifera, Q. rubra, Q. velutina), shallowly-lobed leaves (e.g., Q. petraea), and deeply-lobed leaves (e.g., Q. pyrenaica). The case of Q. coccifera is paradoxical because its leaves were grouped in cluster 1, which was mainly characterized by leaves with smooth margins (table 2). However, this species showed complex spiny margins characterized by high FDb values (fig. 3). The fact that Q. coccifera
leaves were grouped in cluster 1 was due to their very low values of the WMAVm ratio, which indicated a low incision rate. DISCUSSION
Our estimate of fractal dimension using the box-counting method (FDb) is a reliable measure of leaf-outline complexity as shown by its high correlation with the fractal dimension obtained using the dividers method (FDc). Our results confirm the efficiency of fractal dimension in estimating leaf-outline complexity (BORKOWSKI, 1999). As expected, fractal dimension (FDb) is related to the ratio of leaf perimeter to leaf area (MCLELLAN & ENDLER, 1998). The use of both variables to estimate leaf lobation is thus redundant. However, the fractal dimension was not an appropriate index to distinguish between very lobed
Fig. 3.-Mean (± SE) box-counting fractal dimension (FDb) of leaf outline in different Quercus species. Those values followed by different letters are significantly different (p < 0.05) according to a Tukey test for unequal sample sizes. Quercus cerris is subdivided into two groups with more lobed (Q. cerris-LOB.) or straighter-edged (Q. cerris-ENT.) leaves. Sample size is n = 10-20 leaves per species. Three representative leaves (see Table 2) are displayed (from left to right): Q. velutina, Q. petraea, and Q. pyrenaica. The global mean FDb (± SD) is also indicated.
J.J. CAMARERO & AL.: FRACTAL ANALYSIS OF LEAF MARGIN
leaves (e.g., Q. pyrenaica) and spiny ones (e.g., Q. coccifera; fig. 3, table 2). In addition, the fractal dimension was not able to differentiate various leaf shapes, such as the twogrowth-cycle ones in Q. cerris, due to the great intraspecific variability of leaf morphology (fig. 3). This variability was also observed for Q. frainetto and Q. pyrenaica, being both oak species with deeply-lobed leaves in the field. For instance, most of Q. frainetto leaves corresponded to cluster 3 (deeplylobed margins; table 2) but some of them were also located in clusters 1 or 2. We therefore recommend: (i) the performance of further studies including a much broader range of leaf shapes in adult trees to comprise part of the huge intra- and interspecific morphological variability of Quercus species, and (»') the development of specific location indices based on simple morphometric variables, such as the ratio of maximum distance from me lobe tip to the main nerve to minimum distance from the lobe incision to the main nerve (WM/Wm). These indices are simpler and less error-prone measures than fractal dimen-
69
sion because they do not depend on so many assumptions (SLICE, 1993). Our results indicate that an automatized routine procedure to quantify the complexity of leaf silhouettes will bypass reality showing failures in extreme cases (e.g. spiny leaves in Q. coccifera). Nevertheless, there is still a lack of accessible and quick routines for the numerical description of leaf outline to interpret adequately leaf-shape / environment interactions. These routines might be used for automatic species identification (YONEKAWA & al., 1996), paleocological reconstructions based on leaf form (ROTH-NEBELSICK & ai, 2001), and in plant-level models of light capture (PEARCY & YANG, 1996). Furthermore, there is a lack of accessible and user-friendly morphometric indices which provide characteristic features for taxonomic purposes. The ratio of maximum distance from the lobe tip to the main nerve to minimum distance from the lobe incision to the main nerve (WM/Wm) might be one of these indices. It might be used in addition to other leaf-shape indices to disentan-
TABLE2 RESULTS OF THE «--MEANS CLUSTERING (K=3 GROUPS) OF ALL LEAVES (« = 259) USING THE VARIABLES SHOWED IN TABLE 1. SEE FIGURE 3 FOR GRAPHICAL EXAMPLES OF THE 3 CLUSTERS
Cluster Centers for each variable P/L P/A(cm') P/A05 WM/Wm FDb' Within-cluster sum of squares «(%) Quercus species with > 50 % of their leaves within cluster
Leaf margin
2 1 2.791 3.099 1.299 1.438 4.469 5.945 1.280 1.731 1.103 1.126 43.44 103.25 82 (32) 161 (62) Q. agrifolia, Q. alba. Q. petraea, Q. cerris, Q. chrysolepis, Q. robur Q. coccifera, Q. faginea, Q. ilex subsp. ballota, Q. ilex subsp. ilex, Q. rubra, Q. suber, Q. velutina Smooth or spiny Shallowly-lobed
3 3.666 2.042 7.588 2.601 1.159 13.59 16(6) Q. frainetto, Q. pyrenaica
Deeply-lobed
'FDb for leaves from adults of other woody species: Nerium oleander L., FDb = 1.079; Olea europaea L., FDb = 1.084; Platanus x hybrida Brot.. FDb = 1.100; Quercus pyrenaica Willd., FDb = 1.223; Albizzia julibrissin Durass., FDb =1.605.
70
ANALES JARDIN BOTANICO DE MADRID, 60(1) 2003
gle the great taxonomic diversity of Quercus species and their hybrids (e.g., Q. cerris in this study, DUPOUEY, 1983; GRANDJEAN and SIGAUD, 1987). It is also advisable to sample well-characterized populations from a genetic point of view given the great intraspecific variability of oak leaves even under controlled environmental conditions (e.g., Q. cerris). Deeply-lobed leaves are frequent among north temperate trees that grow rapidly under seasonal climates (e.g., deciduous Quercus species) and among pioneer tropical trees (MACARTHUR, 1972). In our analysis, this is the case of the Quercus species present in cluster 3, which grow in areas under nemoromediterranean climate with a moderate summer drought (Q.frainetto, Q. pyrenaica). This might be an adaptative trait for growing rapidly if water stress is not intense and transpiration flux is high (GALLEGO & al, 1994). We suggest that flux along leaf edge is related to the complexity of this boundary. Leaf lobation implies the reduction of the mesophyll area, which might increase leaf hydraulic conductance. For instance, Sis6 & al. (2001) showed that lobed leaves of several oak species have lower hydraulic-resistance values than leaves with more entire margins. Future studies should also take into account the roughness of leaf surface, i.e. leaf lobation in three dimensions, as well as leaf venation architecture (ROTH-NEBELSICK & al., 2001). ACKNOWLEDGEMENTS
This study has been supported by FO96-026 and SC96-086 projects. We thank Eliseo Rivas (SIA, DGA) for providing the software to estimate fractal dimension based on the dividers method. We also thank C.L. Alados and J. Escos (IPE, CSIC) and an anonymous reviewer for their practical advice on fractal analyses and constructive reviews.
BERNSTON, G.M., (1994). Roots systems and fractals: how reliable are calculations of fractal dimension? Ann. Bot. 73:281-284. BORKOWSKI, W. (1999). Fractal dimension based features are useful descriptors of leaf complexity and shape. Can. J. For. Res. 29: 1301-1310. BOURKE, P. (1993). FDC (In: http://astronomy.swin.edu. au/pbourke/fractals/fracdim/). BRENNER, W. (1902). Klima und Blatt bei der Gattung Quercus. Flora 90: 114-160. BURROUGH, P. A. (1986). Principles of geographical systems for land resources assessment. Oxford. DUPOUEY, J.L. (1983). Analyse multivariable de quelques caracteres morphologiques de populations de chenes [Quercus robur L. et Quercus petraea (Matt.) Liebl.] du Hurepoix. Ann. Sci. For. 40: 265-282. FEDER, J. (1988). Fractals. New York. FRONTIER, S. (1987). Applications of fractal theory to ecology. In: P. Legendre & L. Legendre L. (eds.). Developments in numerical ecology: 335-378. Berlin. GALLEGO, H.A., M. Rico, G. MORENO & I. SANTA-REGI-
NA (1994). Leaf water potential and stomatal conductance in Quercus pyrenaica Willd. forests: vertical gradients and response to environmental conditions. Tree Physiol. 14:1039-1047. GIVNISH, T.J. (1979). On the adaptative significance of leaf form. In: O. T. Solbrig, S. Jain, G. B. Johnson & P. H. Raven (eds.). Topics in plant population biology: 375-407. New York. GRANDJEAN, G. & P. SIGAUD (1987). Contribution a la
taxonomie et a l'ecologie des chdnes du Berry. Ann. Sci. For. 44: 35-66. HERRERA, CM. (1993). Selection on complexity of corolla outline in a hawkmoth-pollinated violet. Evol. Trends in Plants!: 9-13. KAUFMAN, L. & P.J. ROUSSEEUW (1990). Finding groups in data: an introduction to cluster analysis. New York. KENKEL, N.C. & D.J. WALKER (1996). Fractals in the bi-
ological sciences. Coenoses 11: 77-100. KRUSSMANN. G. (1986). Manual of cultivated broadleaves trees and shrubs. Portland. LORIMER, N.D., R.G. HAIGHT & R.A. LEARY (1994). The
fractal forest: fractal geometry and applications in forest science. Tech. Rep. NC-170. USDA For. Serv. St. Paul, MN. MACARTHUR, R.H. (1972). Geographical Ecology. New York. MANDELBROT, B.B. (1982). The Fractal Geometry of Nature. San Francisco. MCLELLAN, T. & J.A. ENDLER (1998). The relative success of some methods for measuring and describing the shape of complex objects. Syst. Biol. 47: 264-281. NIKLAS, K.J. (1989). The effect of leaf-lobing on the interception of direct solar radiation. Oecologia 80: 59-64. PEARCY, R.W. & W. YANG (1996). A three-dimensional
REFERENCES
crown architecture model for assessment of light capture and carbon gain by understory plants. Oecologia 108: 1-12.
ALADOS, C.L., J. Esc6s, J.M. EMLEN & D.C. FREEMAN
ROTH-NEBELSICK, A., D. UHL, V. MOSBRUGGER & H. KERP
(1999). Characterization of branch complexity by fractal analyses. Int. J. Plant Sci. 160: S147-S155.
(2001). Evolution and function of leaf venation architecture: a review. Ann. Bot. 87: 553-566.
J.J. CAMARERO & AL.: FRACTAL ANALYSIS OF LEAF MARGIN
SARGENT, C.S. (1965). Manual of the Trees of North America (Vol. I). New York. Sis6, S., J.J. CAMARERO & E. GIL-PELEGRIN (2001). Relationship between hydraulic resistance and leaf morphology in broadleaf Quercus species: a new interpretation of leaf lobation. Trees 15: 341-345. SLICE, D.E. (1993). Fractal analysis of shape. In: L.F. Marcus, E. Bello & A. Garci'a-Valdecasa (eds.), Contributions to morphometries: 161-190. Madrid. SOKAL, R.R. & F.J. ROHLF (1995). Biometry: the Principles and Practice of Statistics in Biological Research. New York. VLCEK, J. & E. CHEUNG (1986). Fractal analysis of leaf shapes. Can. J. For. Res. 16:124-127.
71
VOGEL, S. (1970). Convective cooling at low airspeeds and the shapes of broad leaves. J. Exp. Bot. 21: 91-101. YONEKAWA, S., N. SAKAI & O. KTTANI (1996). Identifica-
tion of idealized leaf types using simple dimensionless shape factors by image analysis. Trans. ASAE 39: 1525-1533. ZEIDE, B. (1991). Fractal geometry in forestry applications. For. Ecol. Manag. 46: 179-188.
Editado por Gonzalo Nieto Feliner Aceptado para publicacion: 21 -XI-2002